
Bitcoin (BTC) is showing short-term signs of a bottom and might confirm them with a breakout from a descending parallel channel.
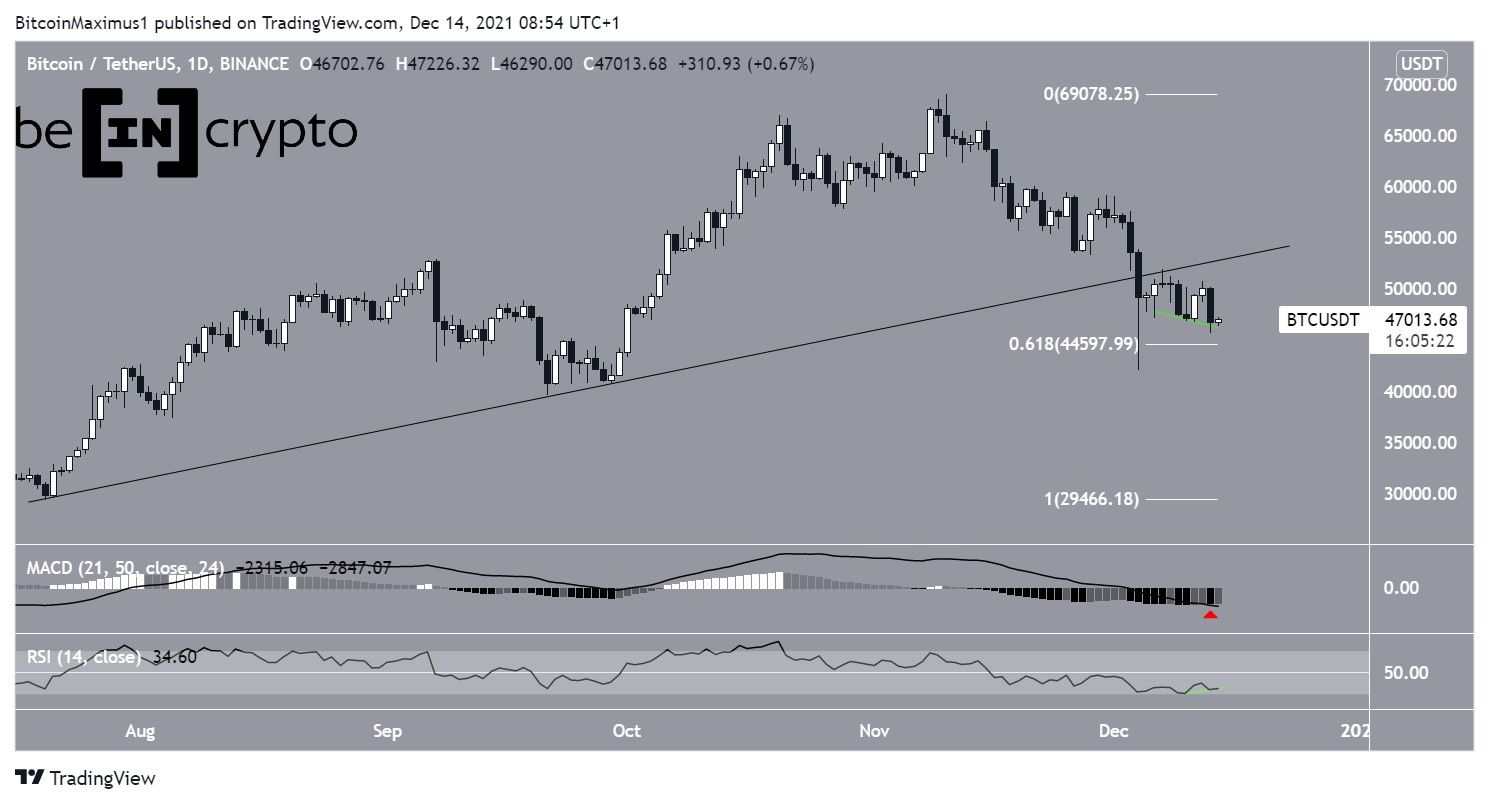
Bitcoin decreased considerably on Dec 13, falling to a low of $45,672 in the process.
Despite the drop, it’s still trading above the 0.618 Fib retracement support level at $44,600. The level has been validated as support during the Dec 4 bounce and long lower wick.
Technical indicators provide a mixed outlook.
The MACD, which is created by short and long-term moving averages (MA), is negative and decreasing. This means that the short-term MA is slower than the long-term average, and is a sign of a bearish trend. While it had created higher successive momentum bars on Dec 11 and 12, it created a lower bar on Dec 13 (red icon), potentially nullifying the chances of a reversal.
However, the RSI has generated a bullish divergence (green line). This is an occurrence in which the price decrease is not accompanied by a decrease in selling pressure, and often precedes bullish trend reversals.
Therefore, the daily time frame provides a mixed outlook.
Current pattern
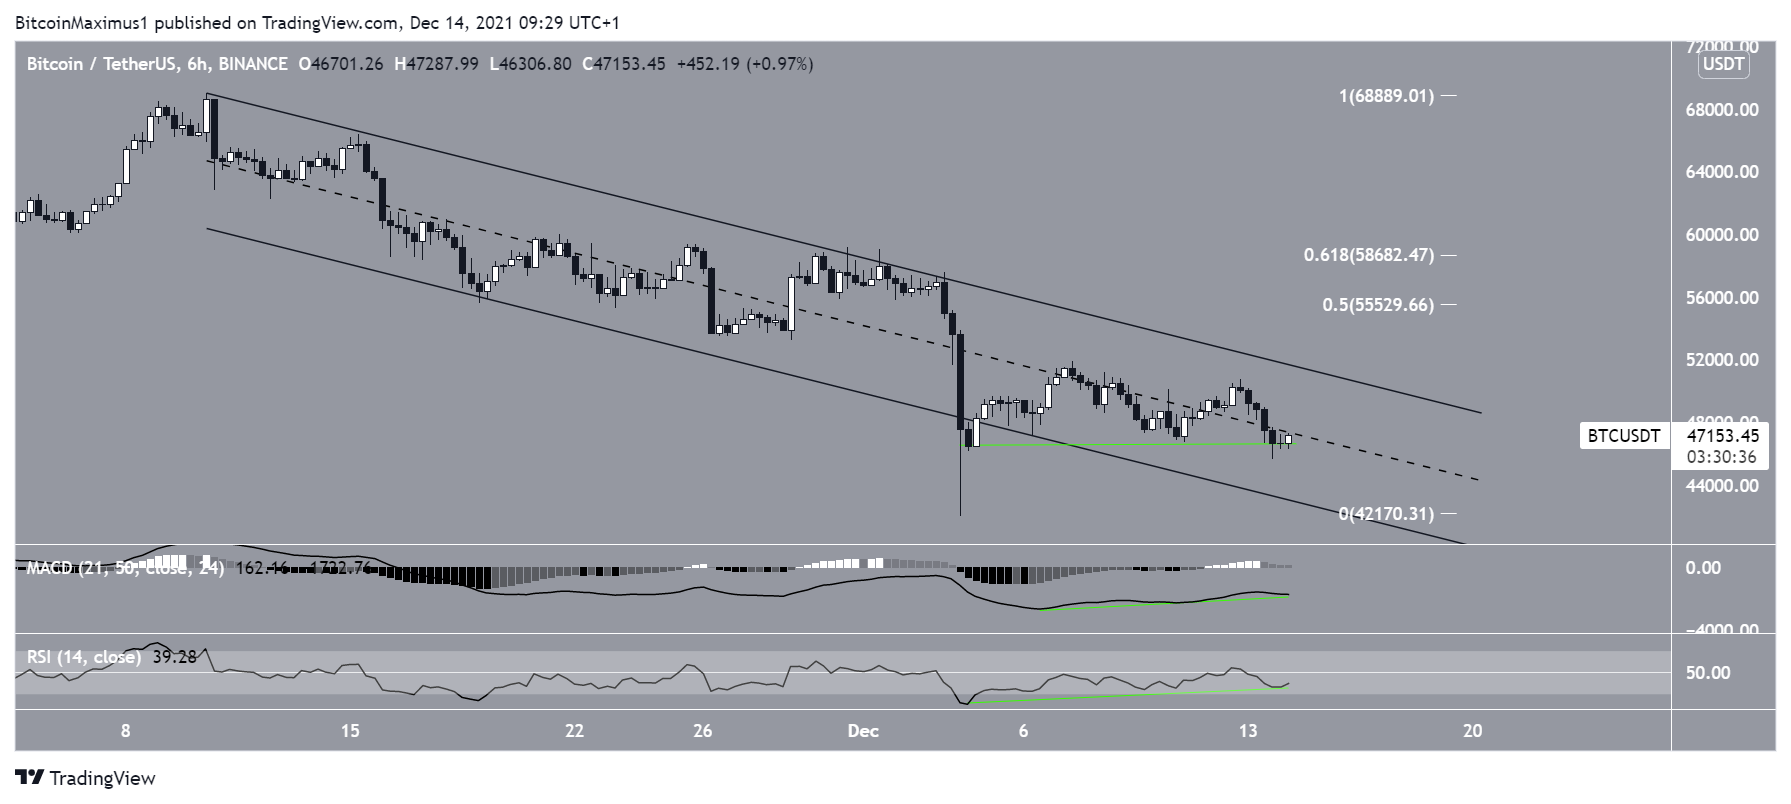
The six-hour chart shows that BTC is trading inside a descending parallel channel since reaching an all-time high price on Nov 10.
Such channels usually contain corrective movements, meaning that a breakout from the channel would be likely.
Similar to the daily time frame, the RSI and MACD have both generated bullish divergences.
Therefore, if BTC manages to break out from the channel, the closest resistance would be found between $55,530 and $58,670. This is an area created by the 0.5-0.618 Fib retracement resistance levels.
Has BTC bottomed?
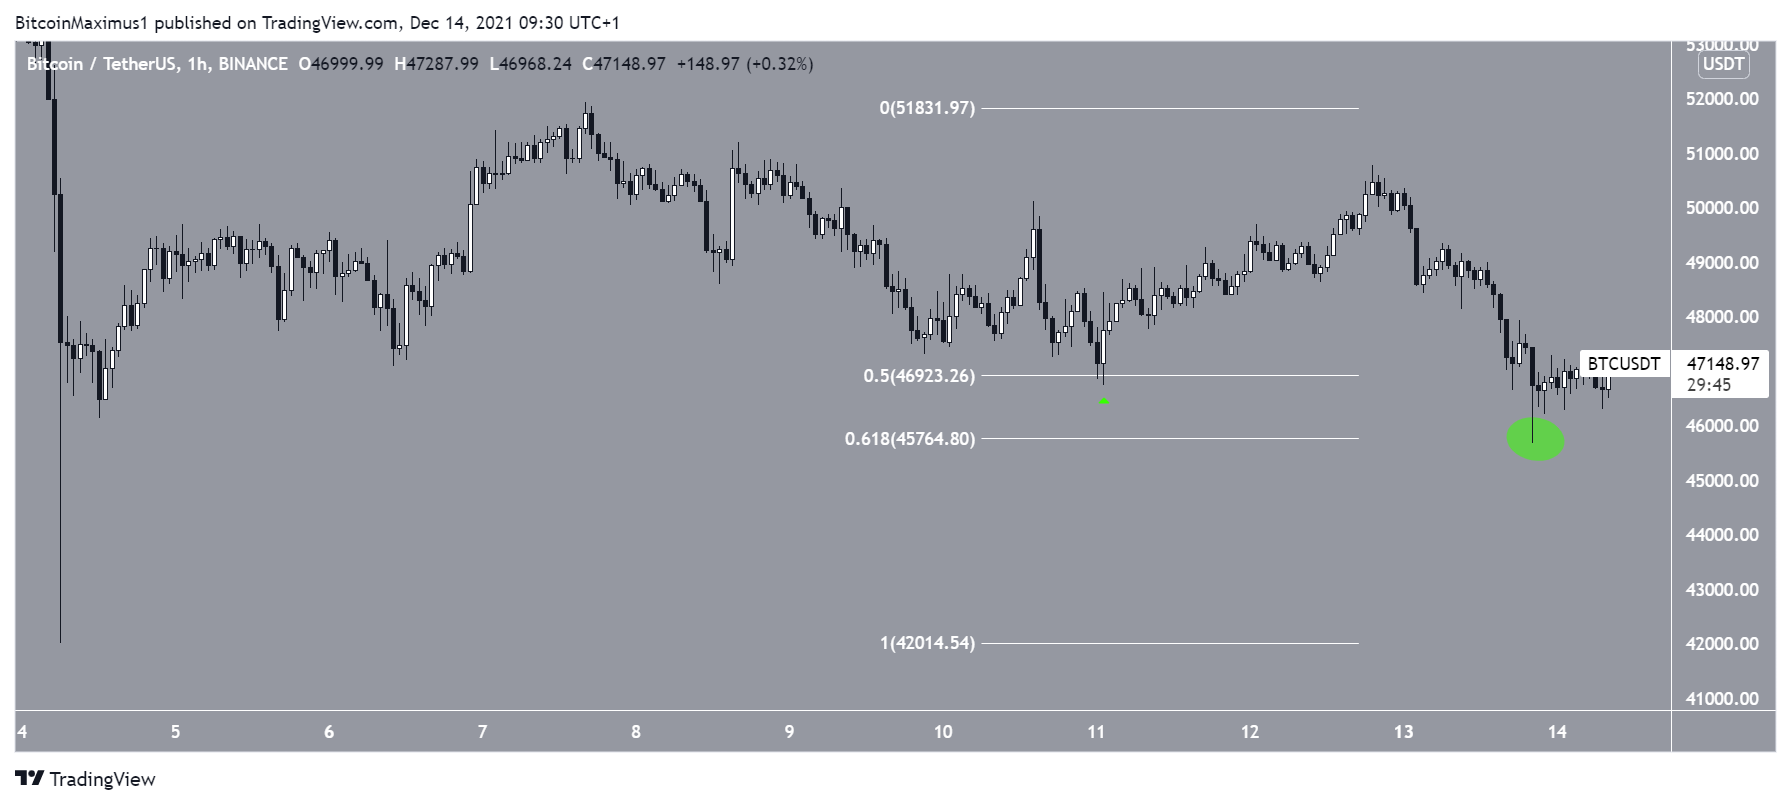
The hourly chart shows that BTC has bounced just above the 0.618 Fib retracement support level at $45,750.
Previously, it bounced at the 0.5 Fib retracement support level on Dec 11 (green icon).
However, it fell once again yesterday and created a slightly lower low at the 0.618 level (green circle). This is a common level for corrections to come to an end.
Therefore, it’s possible that BTC has reached its short-term bottom.
For BeInCrypto’s latest Bitcoin (BTC) analysis, click here.
