


Bitcoin (BTC) is showing strong bullish signals in the daily time frame but has yet to break out above its short-term horizontal resistance levels.
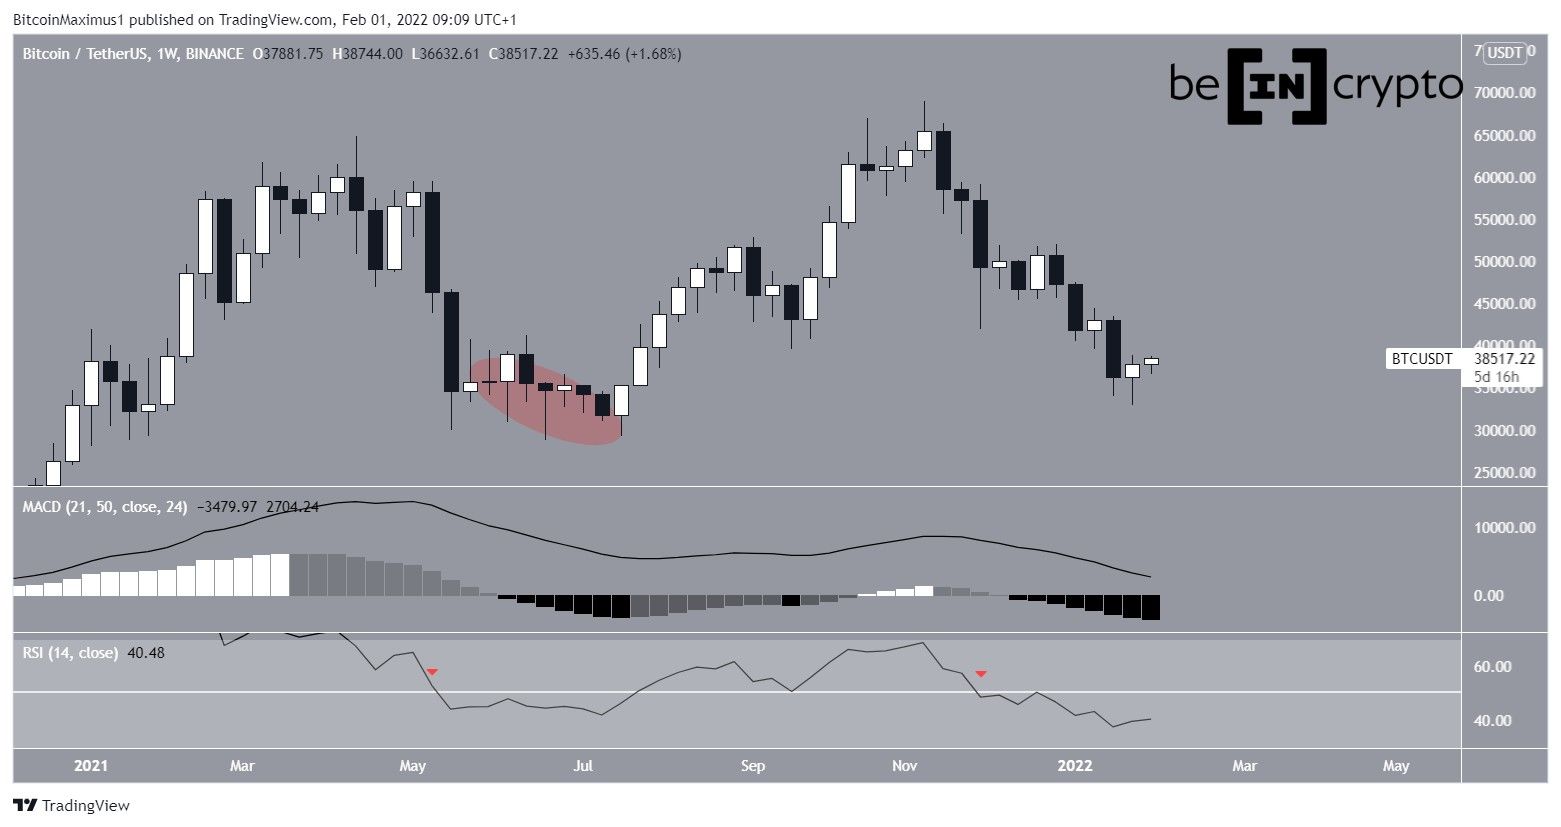
Bitcoin increased slightly during the week of Jan 23-30, creating a small bullish candlestick that was easily contained inside the previous week’s bearish candle.
At the moment, both the RSI and MACD are falling. The RSI, which is a momentum indicator, has fallen below 50 (red icon). This is considered a sign of a bearish trend. However, the previous time the RSI fell below this level, it only caused a deviation (red circle) prior to the continuation of the upward movement.
Overall, the weekly time frame is painting a relatively bearish outlook.
Current trading pattern
The daily chart shows that BTC has been trading inside an ascending parallel channel since April 13, 2021. On Jan 24, 2022, it bounced at the support line of the channel (green icon), creating a long lower wick — a sign of buying pressure. The price has been moving upwards since.
The closest resistance area is found at $40,800, a crucial level that previously acted as support.
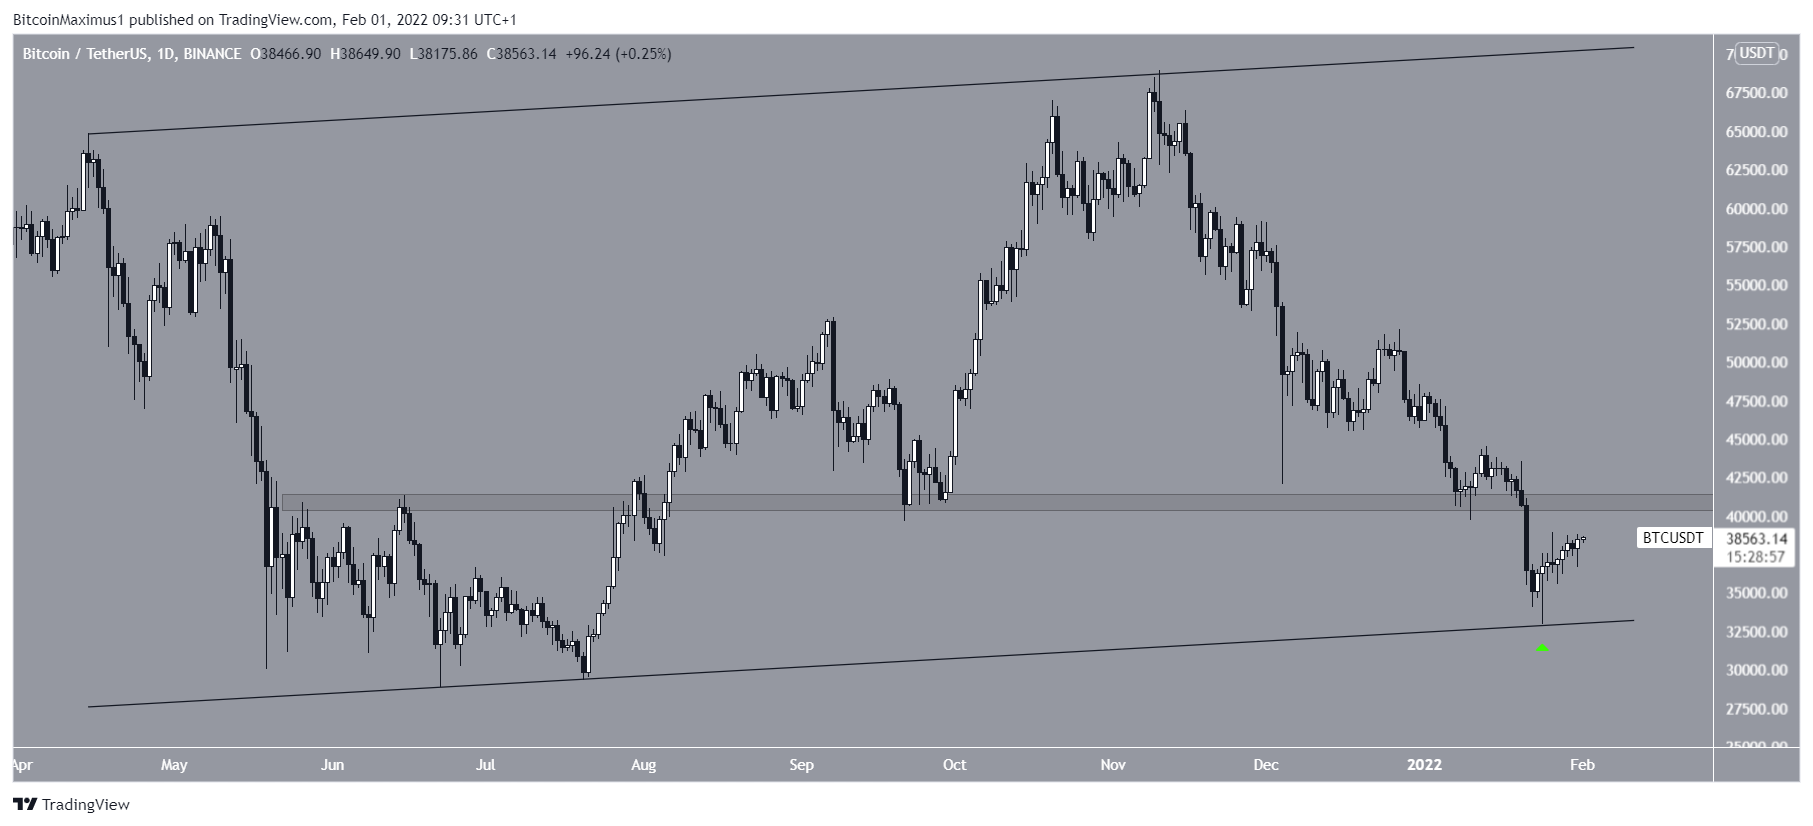
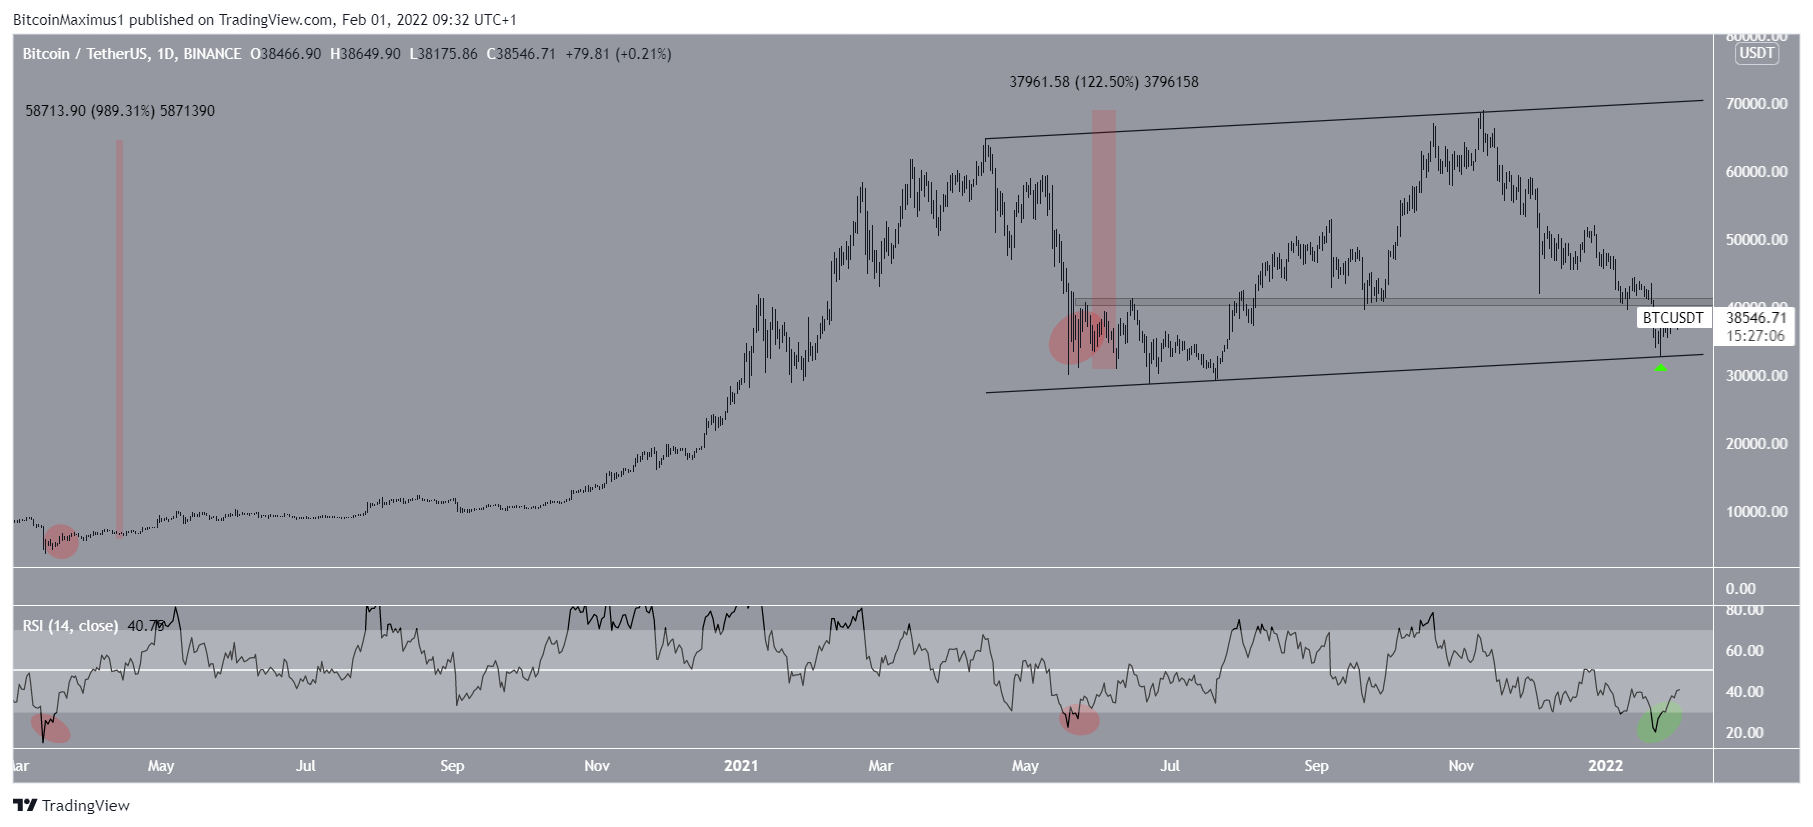
The daily RSI provides an interesting bullish signal as it has moved above the oversold value of 30 (green circle).
Previously, the RSI has fallen below 30 before reclaiming the level twice:
- March 2020 — preceding an upward movement of nearly 1,000%
- May 2021 — preceding an upward movement of 122%
Therefore, this is a bullish sign that has historically transpired close to or at significant price bottoms.
Short-term BTC movement
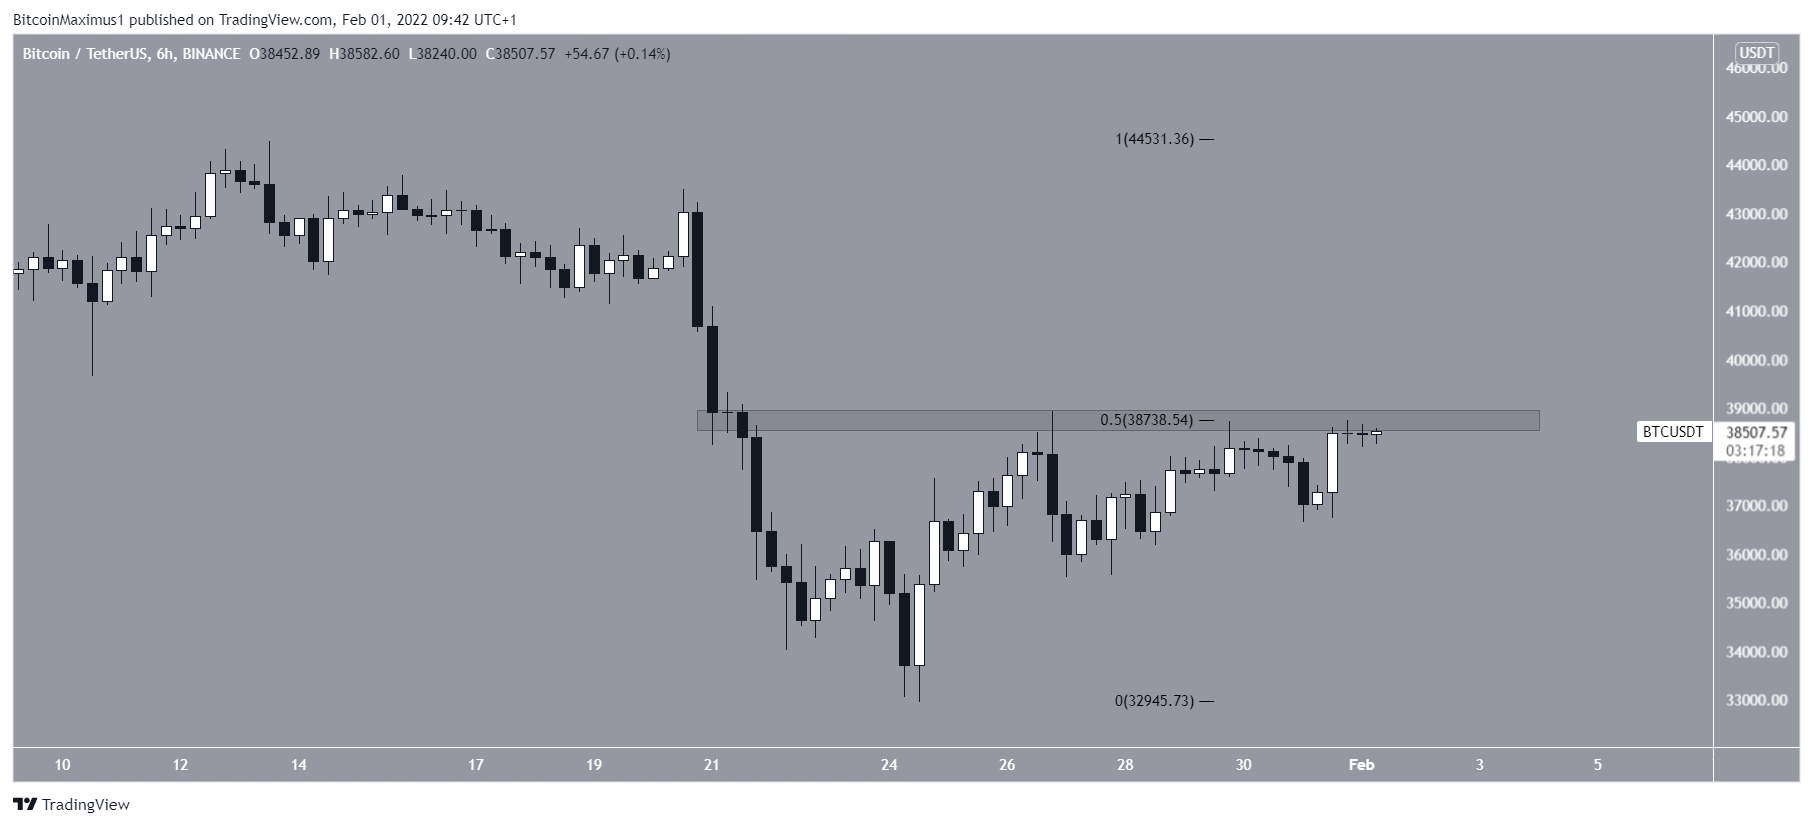
The six-hour chart shows that BTC is trading inside the minor $38,700 resistance, which is both a horizontal resistance area and the 0.5 Fib retracement resistance level.
Previously, it made an attempt at breaking out on Jan 27 and is currently making another breakout attempt.
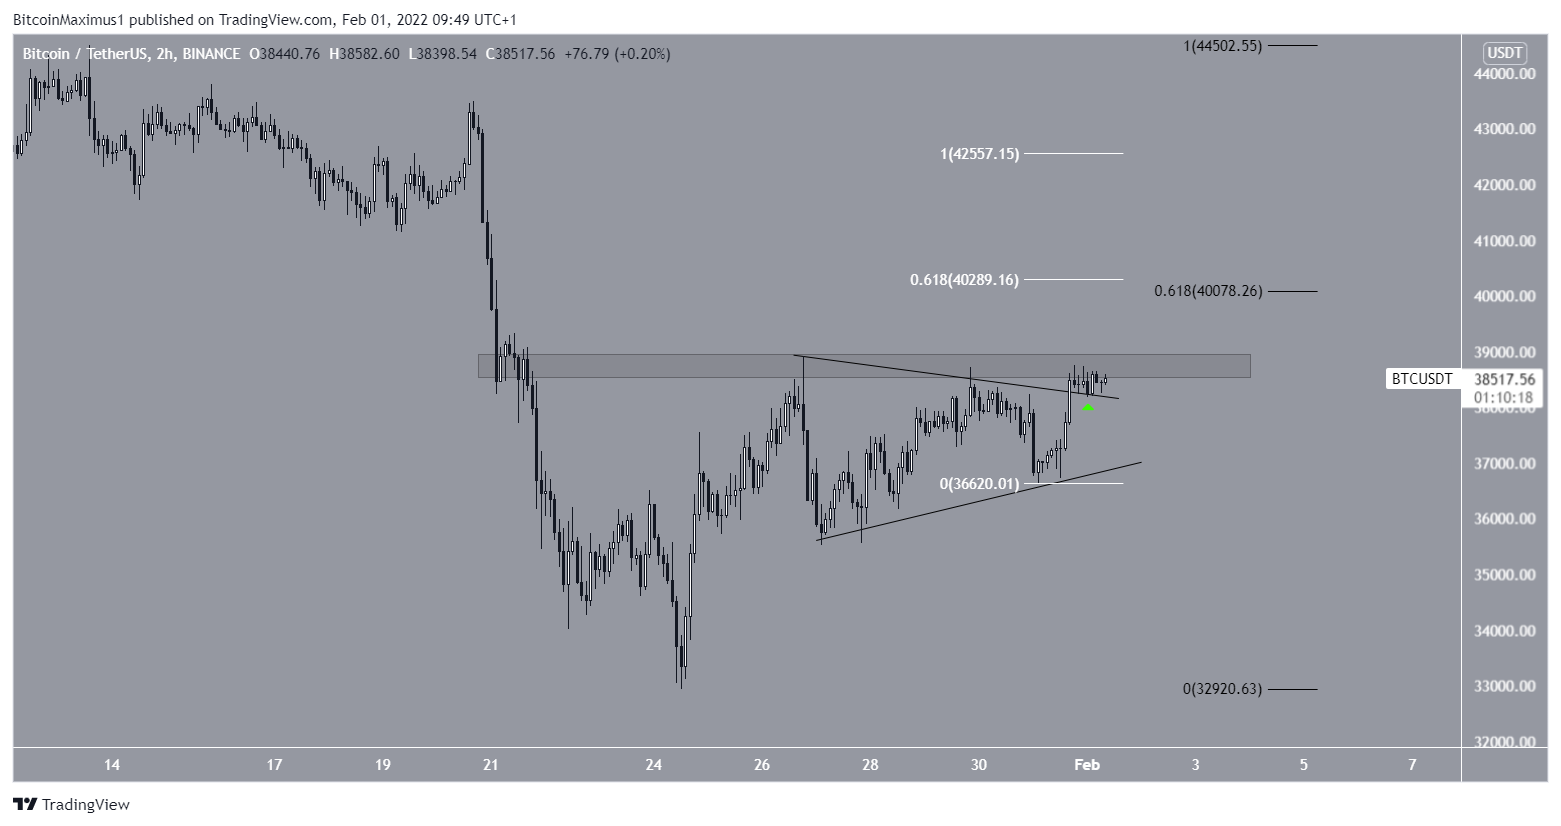
The two-hour chart shows that BTC has already broken out from a symmetrical triangle (green icon), and is in the process of validating it as support.
If it manages to reclaim the previously outlined $37,800 resistance area, the main target would be found between $40,000-$40,300. This target range is found using the 0.618 length of the previous upward move (white) and the 0.618 Fib retracement resistance level.
If BTC manages to move above this level, the next target would be found at $42,500.
For BeInCrypto’s previous Bitcoin (BTC) analysis, click here


