


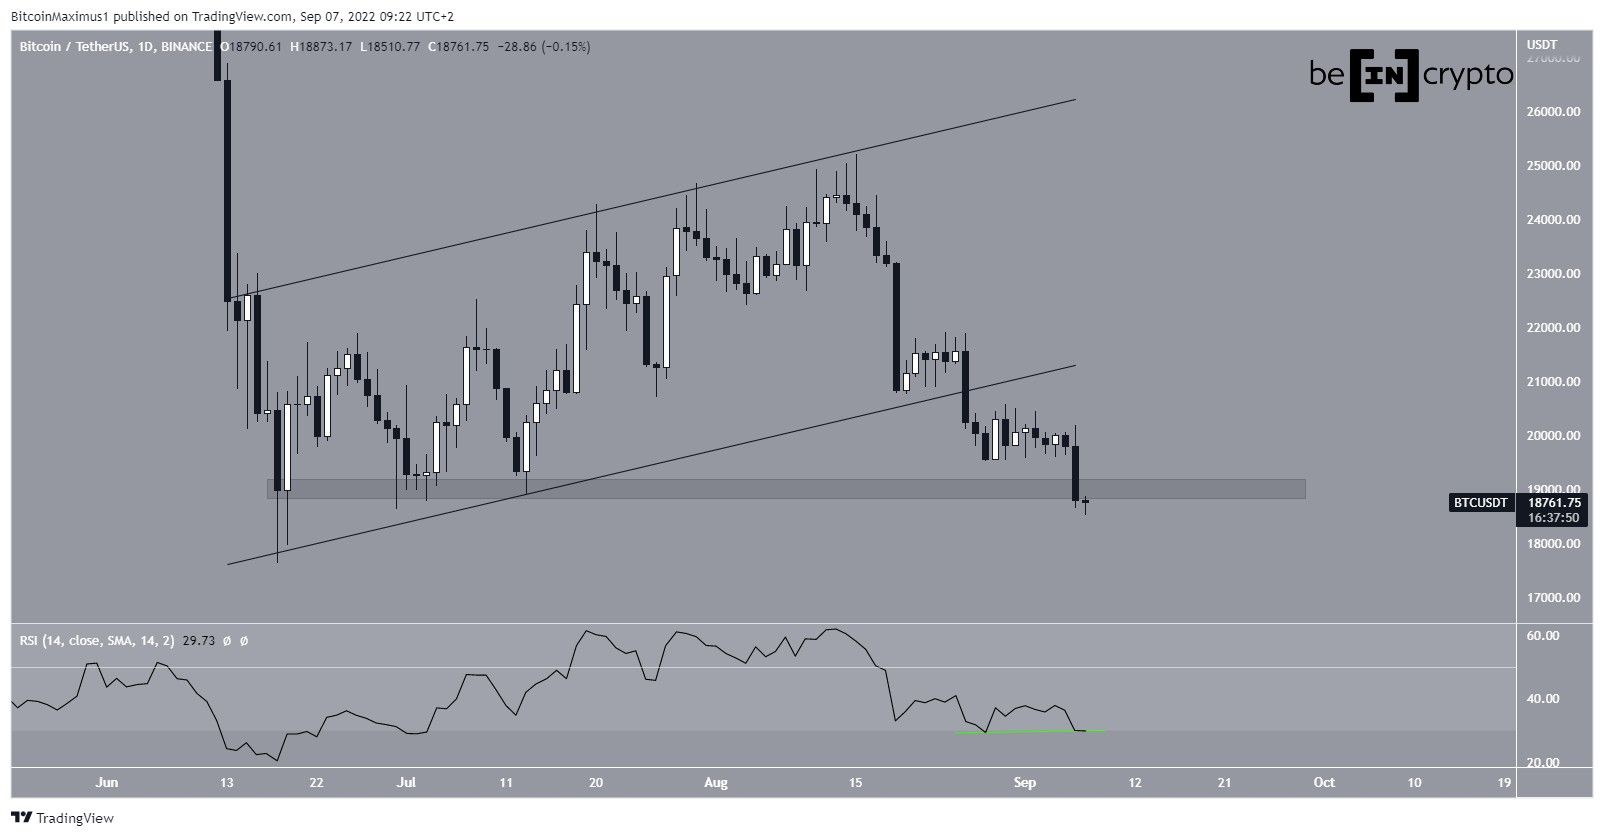
Bitcoin (BTC) has broken down from its corrective pattern and is at risk of breaking down from a horizontal support area. If this were to occur, it would likely take the price below its June lows.
BTC had been increasing inside an ascending parallel channel since its June 18 lows. The upward movement led to a high of $25,200 on Aug 25. The price has been decreasing since and broke down from the channel on Aug 26.
This breakdown suggests that the upward movement that began on June 18 has now come to an end. Furthermore, the daily RSI has fallen below 50, in what is also considered a sign of a bearish trend.
Bitcoin has now reached the closest support area is at $19,000 and decreased slightly below it.
Previously, the leverage ratio, which is measured as the total amount of leverage over the number of coins in an exchange, reached a new all-time high.
Where will BTC bottom?
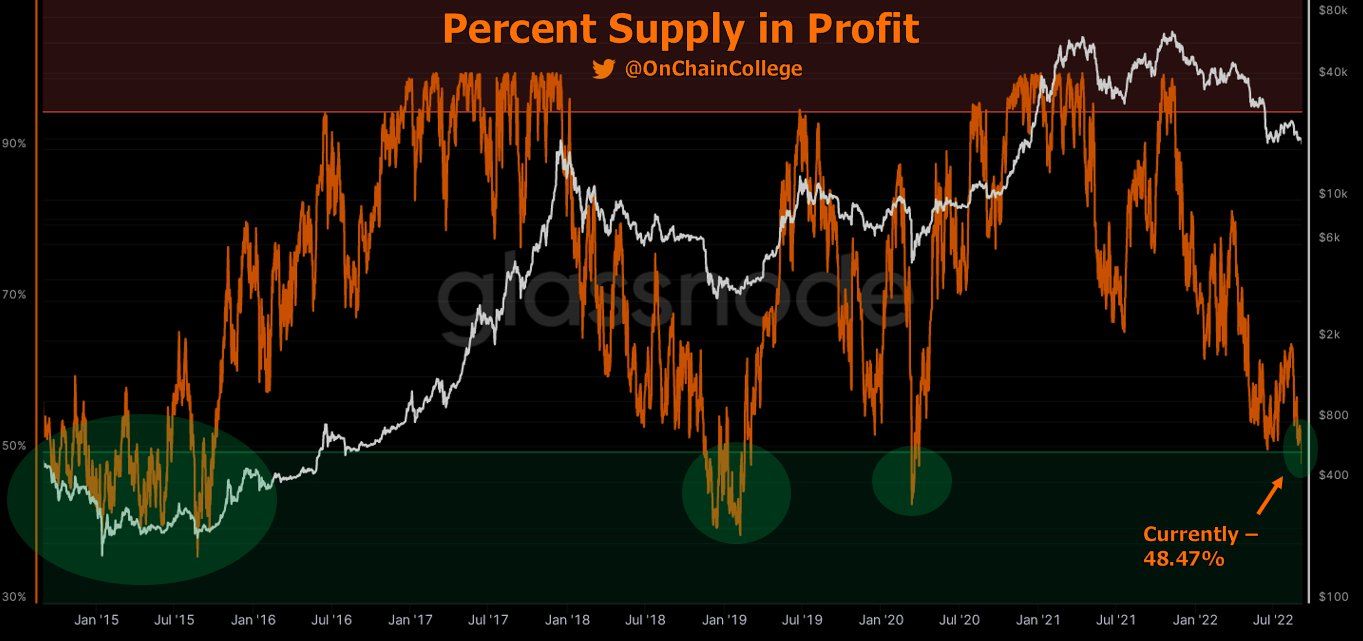
Despite the bearish outlook from the price action and technical indicators, the majority of on-chain indicators implies that a bottom is close. This was further noted by @OnChainCollege, who tweeted a chart of the percent supply in loss, which has dropped below 48%. Values below 50% have previously been associated with market bottoms.
So, a large percentage of on-chain indicators show conditions that have previously been associated with market bottoms.
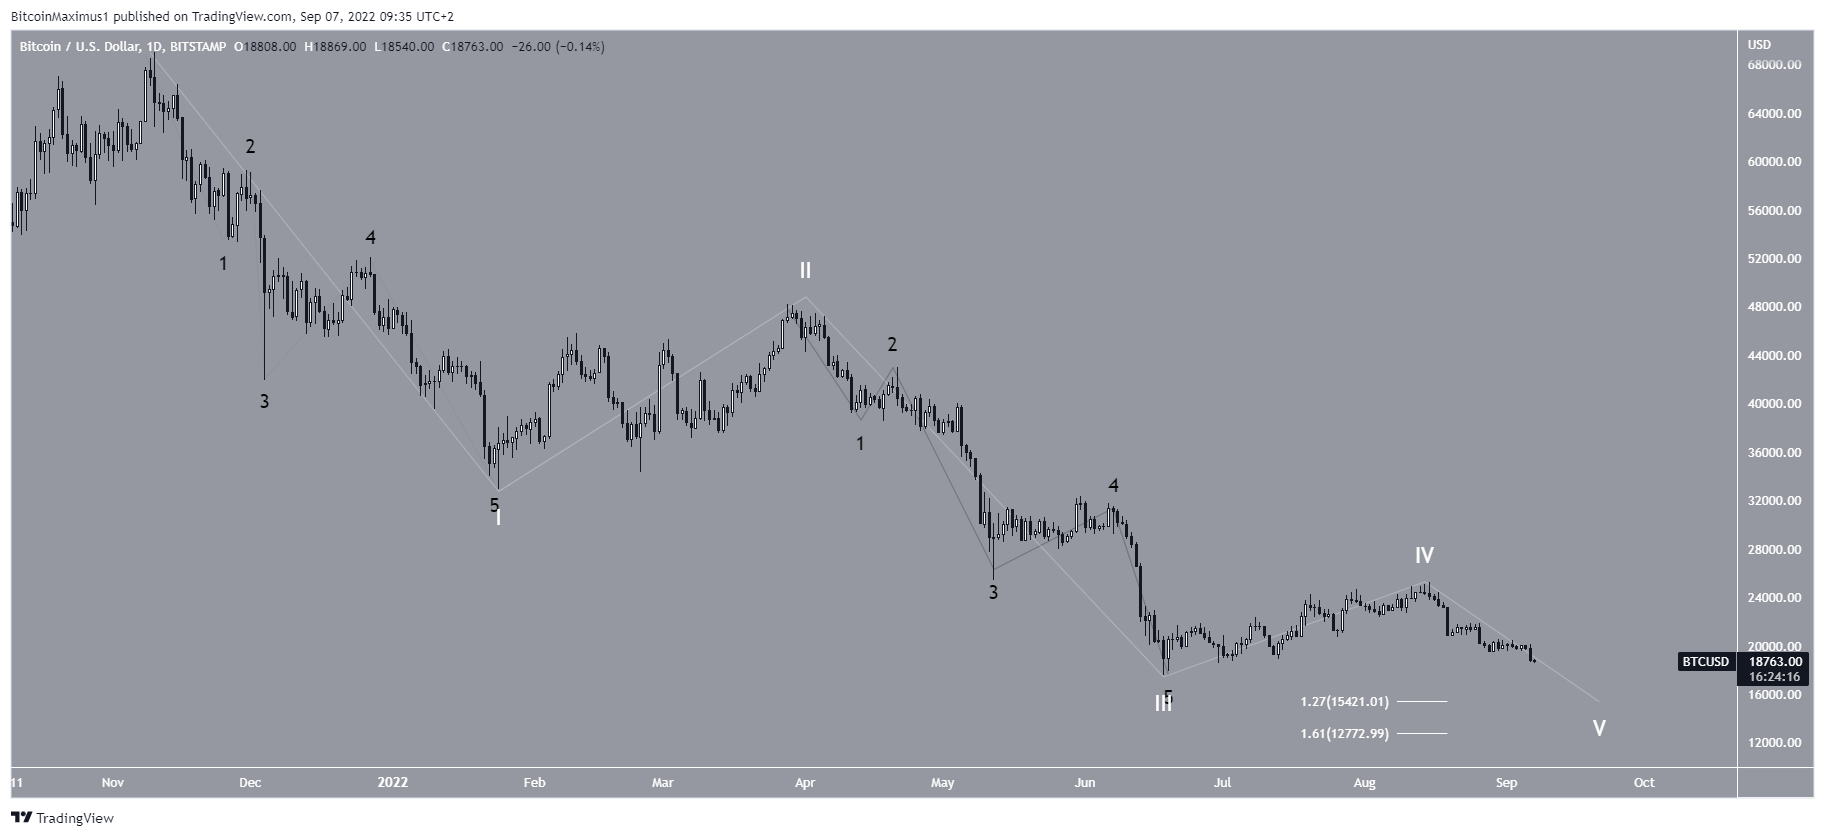
Wave count analysis
The wave count suggests that BTC is in the fifth and final wave of a downward movement (white) that began with the all-time high price in Nov.
If correct, the downward movement would take Bitcoin below its June lows, potentially falling to $15,420 or $12,770. The targets are found using the 1.27 and 1.61 external Fib retracement levels of wave four (white).
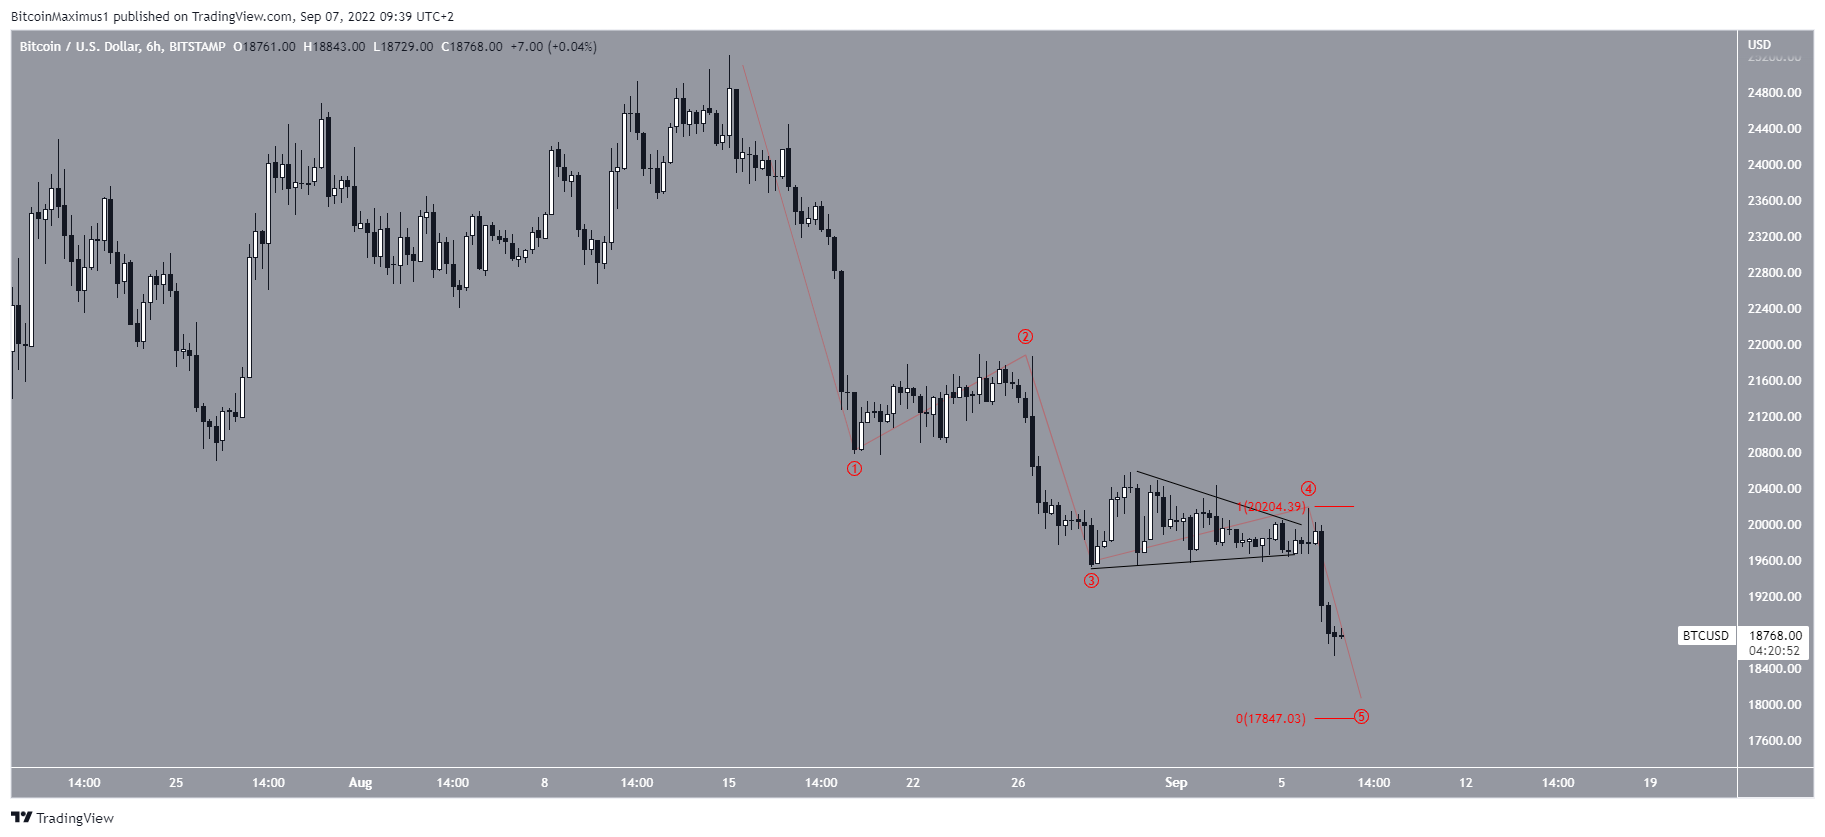
The short-term count shows that BTC is in the fifth sub-wave of this downward movement. The shape of the symmetrical triangle shows that the previous pattern was part of wave four.
Because wave three cannot be the shortest, BTC would be expected to fall to the $17,700 region before bouncing.
For Be[in]Crypto’s previous Bitcoin (BTC) analysis, click here


