
The Bitcoin (BTC) price has been gradually decreasing since Feb. 17 after reaching an all-time high of $52,640.
Despite the decrease, Bitcoin has validated the resistance line from which it previously broke out from. It’s expected to resume its upward trend in the near future.
Bitcoin Returns to Validate Resistance
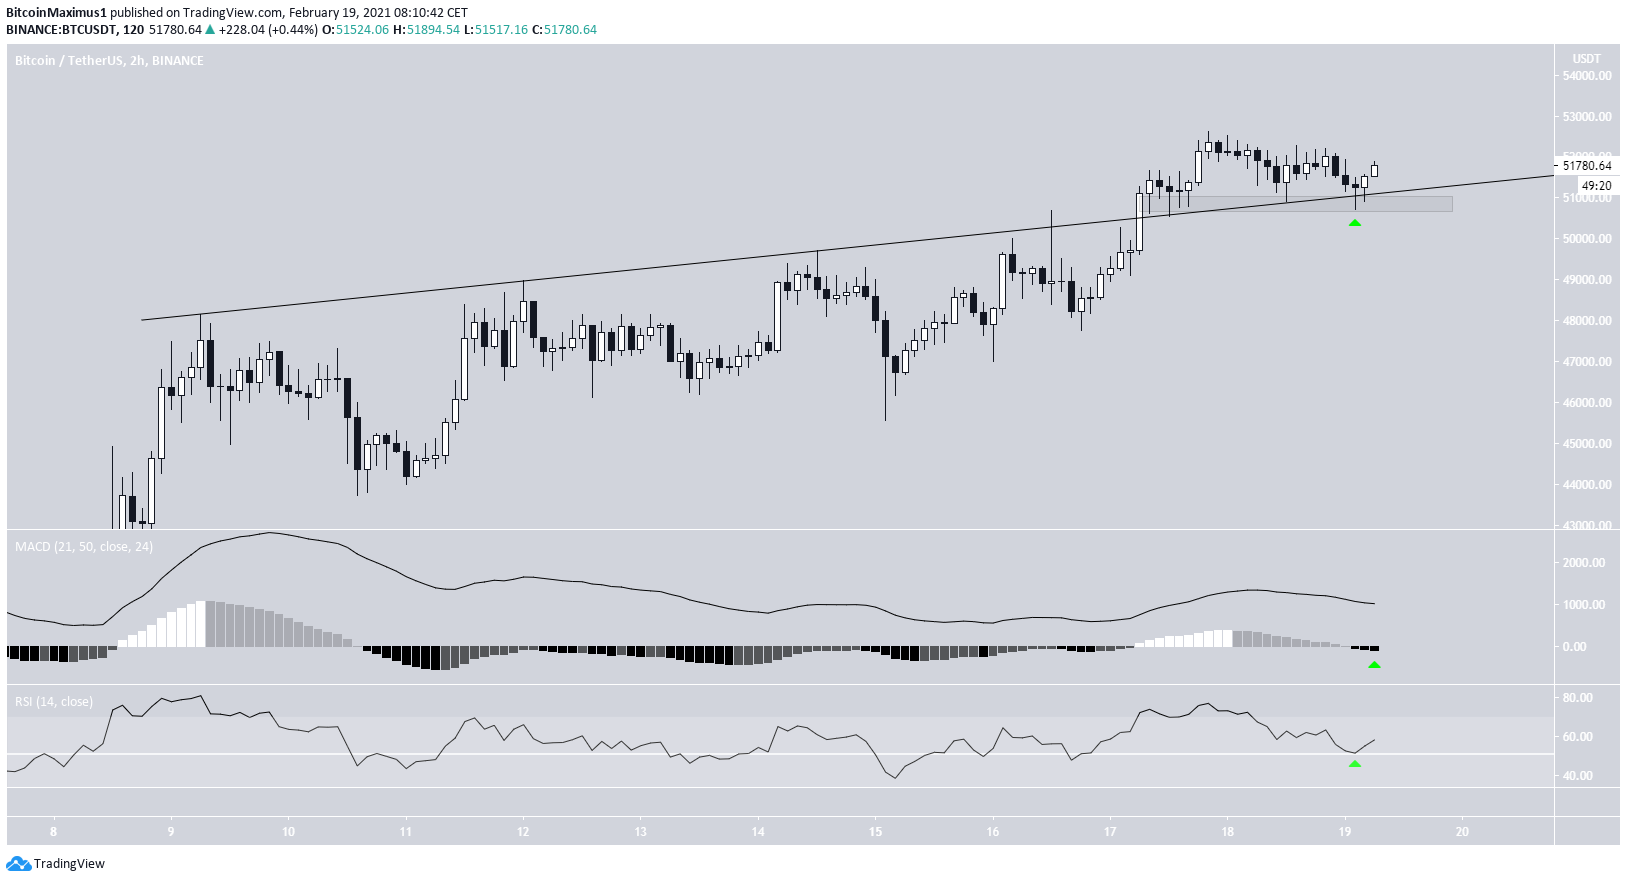
On Feb. 17, BTC broke out from an ascending resistance line that had previously been in place since Feb. 8.
After reaching a high of $52,640, BTC returned and validated the prior ascending resistance line (green arrow). This level is now likely to act as support. The re-test also coincides with an RSI bounce at 50 — a sign that the BTC is ready to move higher.
A MACD histogram cross into positive territory would confirm that the short-term trend is bullish.
BTC Wave Count
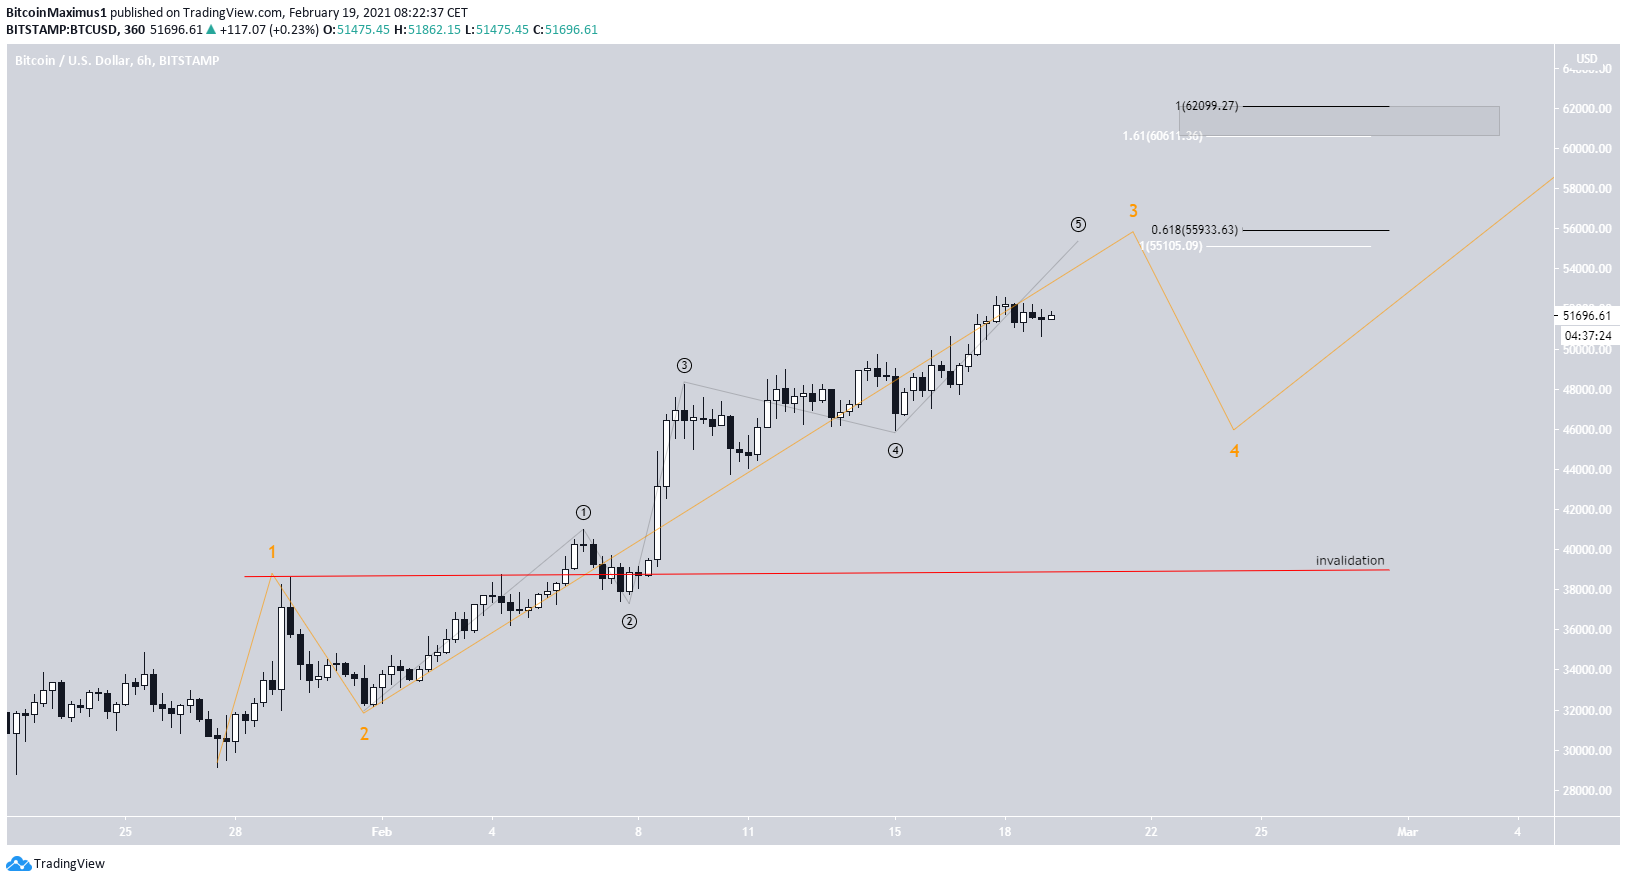
The wave count suggests that BTC has nearly reached the top of wave three (orange). The wave is a part of a bullish impulse that began on Jan. 27, 2021.
The most likely target for the top of this move is found between $55,100-$55,900. After making it past this range, the next likely target would be found between $60,600-$62,000.
The sub-wave count is shown in black and indicates that BTC is in sub-wave five.
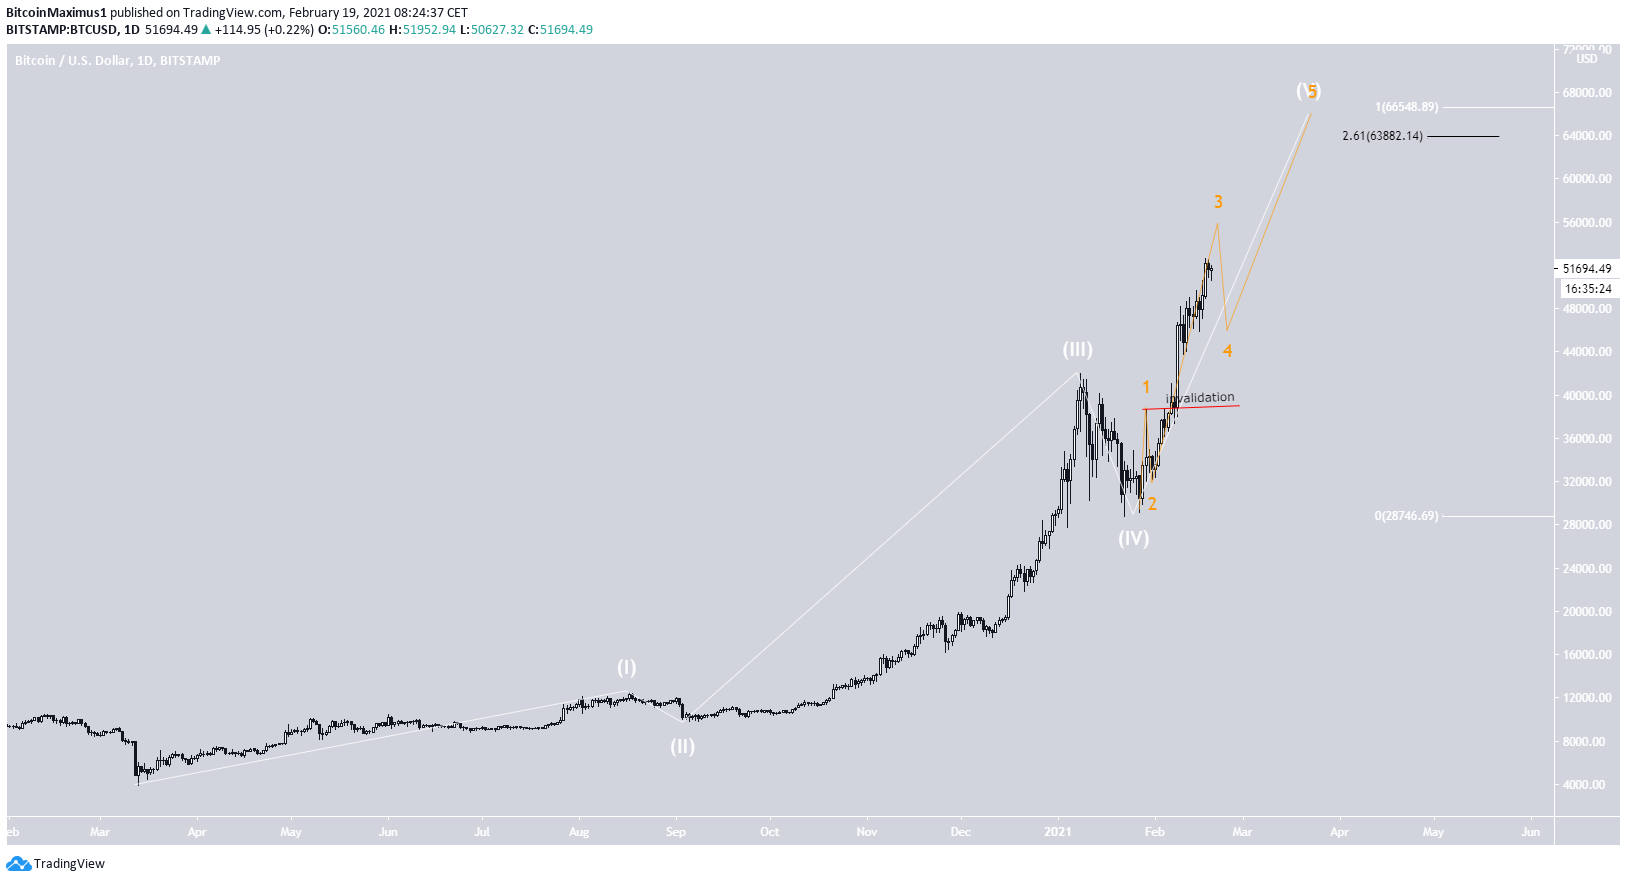
The longer-term count (white) shows that BTC is also nearing the top of a long-term wave five that began in March 2020.
The most likely target for the top of the move is found between $63,800-$66,550.
This target makes it more likely that the move in the previous section will end near $56,000. A final upward move could potentially take BTC towards the $63,800-$66,550 range.
Conclusion
Bitcoin is likely to reach a high between $55,100-$55,900 before correcting. An extended upward move could take BTC toward $60,000 before a correction occurs.
For BeInCrypto’s previous Bitcoin (BTC) analysis, click here
Disclaimer
In line with the Trust Project guidelines, this price analysis article is for informational purposes only and should not be considered financial or investment advice. BeInCrypto is committed to accurate, unbiased reporting, but market conditions are subject to change without notice. Always conduct your own research and consult with a professional before making any financial decisions. Please note that our Terms and Conditions, Privacy Policy, and Disclaimers have been updated.
