


Bitcoin (BTC) has broken out from a short-term descending resistance line and validated it as support after.
While a bullish reversal is not yet confirmed, several bullish developments are indeed taking place.
BTC continues bounce
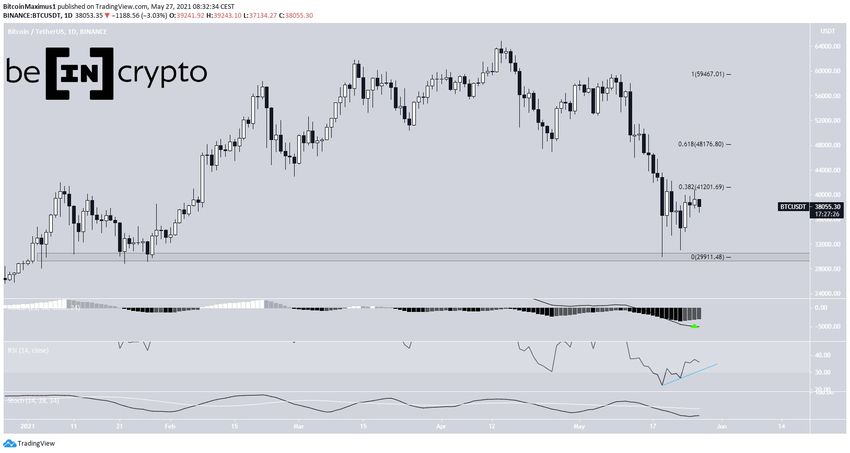
BTC has been moving upwards since it reached a local low of $30,000 on May 19. It created a higher low and a bullish engulfing candlestick on May 23 and 24, respectively.
The 0.382 and 0.618 Fib retracement levels provide the main resistance area. These targets are found at $41,200 and $48,150.
Technical indicators are gradually turning bullish. The MACD gave a bullish reversal signal after the bullish close yesterday. Furthermore, the RSI is increasing after a bullish divergence, and the Stochastic oscillator has stopped falling.
Therefore, numerous bullish signs are developing, hinting at a potential BTC trend reversal.
Short-term breakout
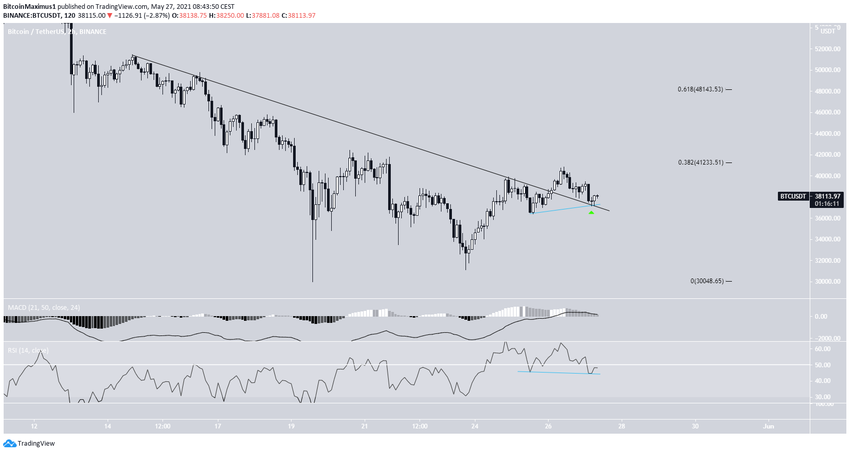
The two-hour chart shows a breakout from a descending resistance line. Following this, the 0.382 Fib retracement rejected the price, causing it to fall and validate the resistance line as support (green icon).
Technical indicators are showing some bullish signs. Even though the MACD has lost momentum, it’s still positive. In addition, the RSI has generated a hidden bullish divergence.
BTC wave count
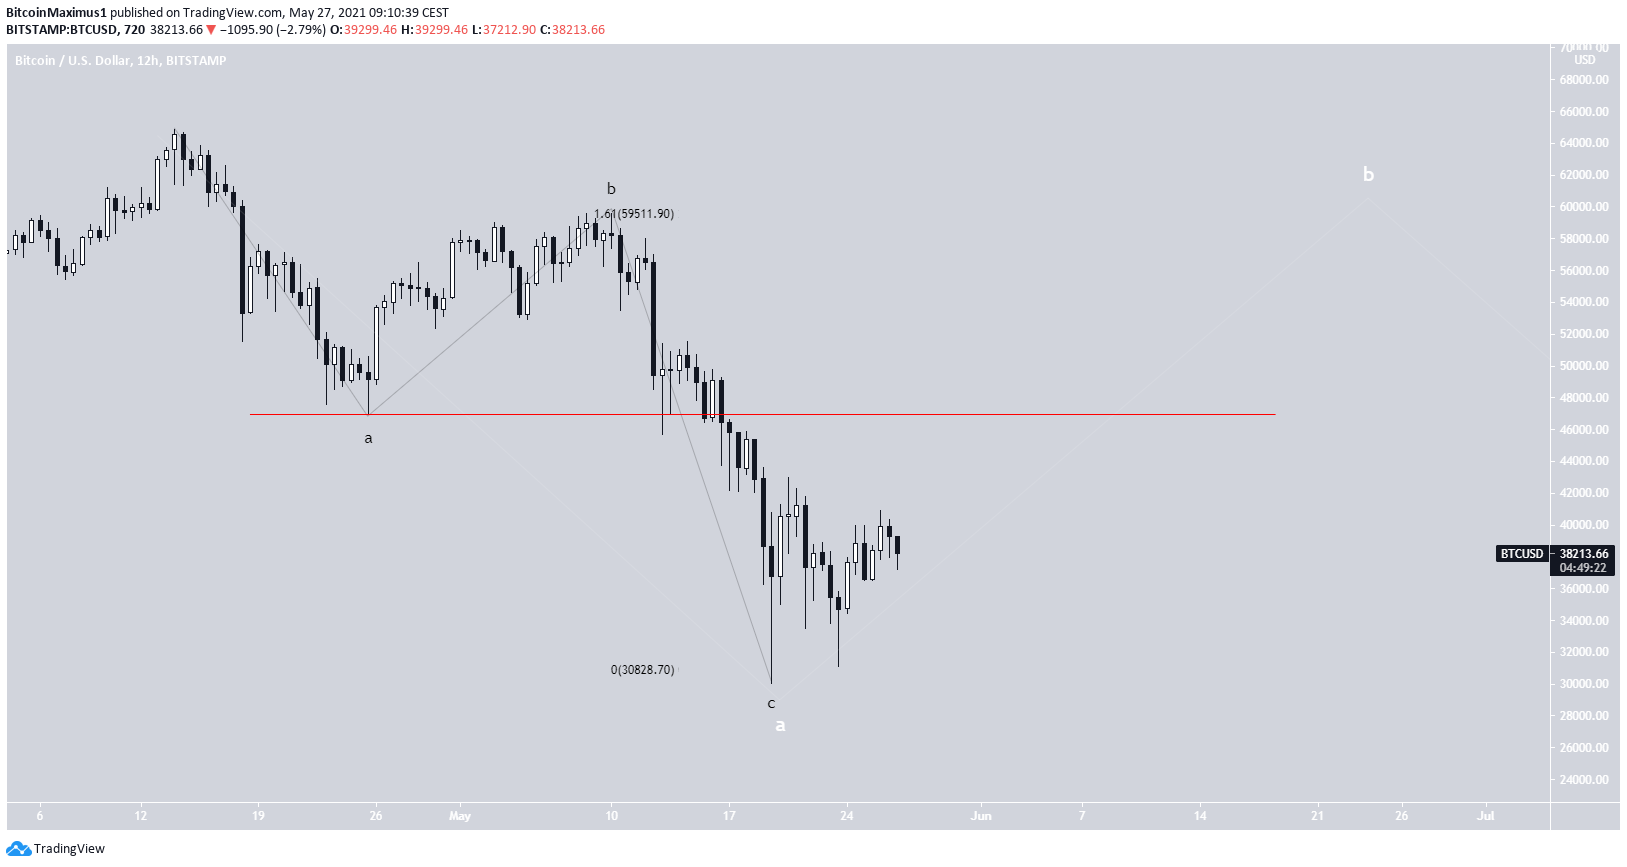
The wave count suggests the decrease from the all-time high is an A-B-C corrective structure (black). In it, waves A:C had a 1:1.61 ratio.
A movement above the A wave low at $47,004 (red line) would likely confirm that this is a correction and not a bearish impulse.
In that case, the movement would likely be the B wave (white) of a longer corrective structure. Judging by the long-term BTC count, it could be either a triangle correction or potentially a flat corrective structure.
For BeInCrypto’s previous bitcoin (BTC) analysis, click here.



