

The Bitcoin (BTC) price increased considerably on March 3. It reached the 0.618 Fib retracement level of the most recent downward movement at $52,475.
Despite the rejection the followed, the bullish structure is still intact. Therefore, Bitcoin is expected to continue increasing and eventually move above this area.
Bitcoin Recovery
BTC increased considerably on Mar. 3, reaching a local high of $52,640. However, it failed to reach a close above the 0.618 Fib retracement resistance at $52,475 and was rejected instead.
This served to isolate the main resistance area as the 0.618 Fib retracement level instead of the 0.5 Fib.
Technical indicators are bullish. The MACD has crossed into positive territory and the RSI is in the process of validating the 50-line as support.

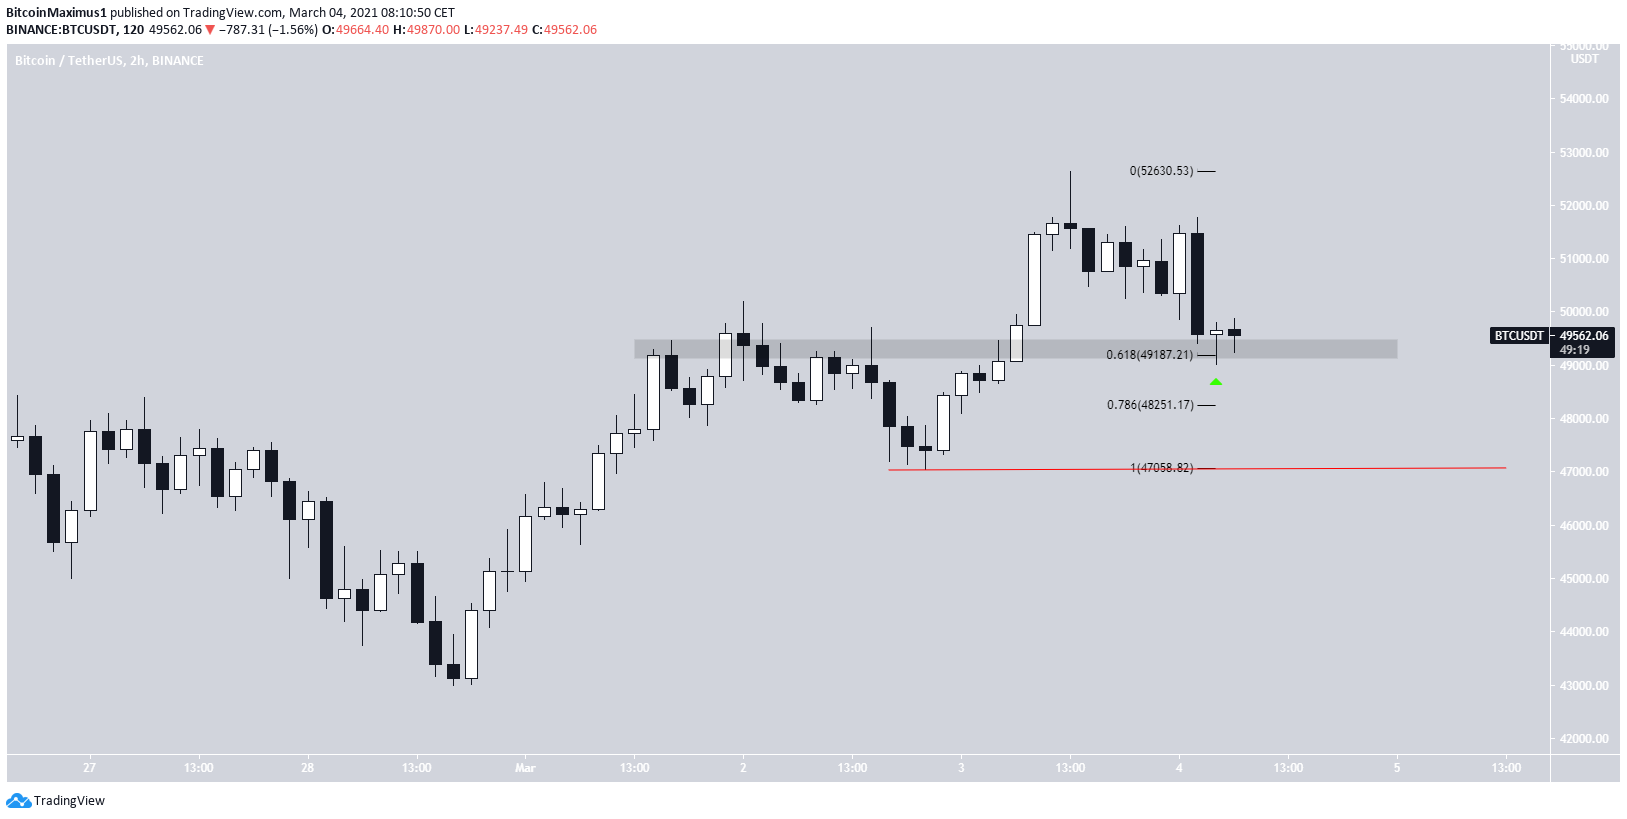
The two-hour chart shows that BTC has retraced to the $49,200 support area. This is also the 0.618 Fib retracement level of the most recent upward movement.
The current decrease looks like a resistance/support flip of this area, which will be confirmed if BTC bounces.
If a breakdown were to occur, the next closest support area would be found at $48,251. This is the 0.786 Fib retracement of the same upward movement.
A decrease below the beginning of the most recent upward movement at $47,058 would put the short-term bullish structure in doubt.
Wave Count
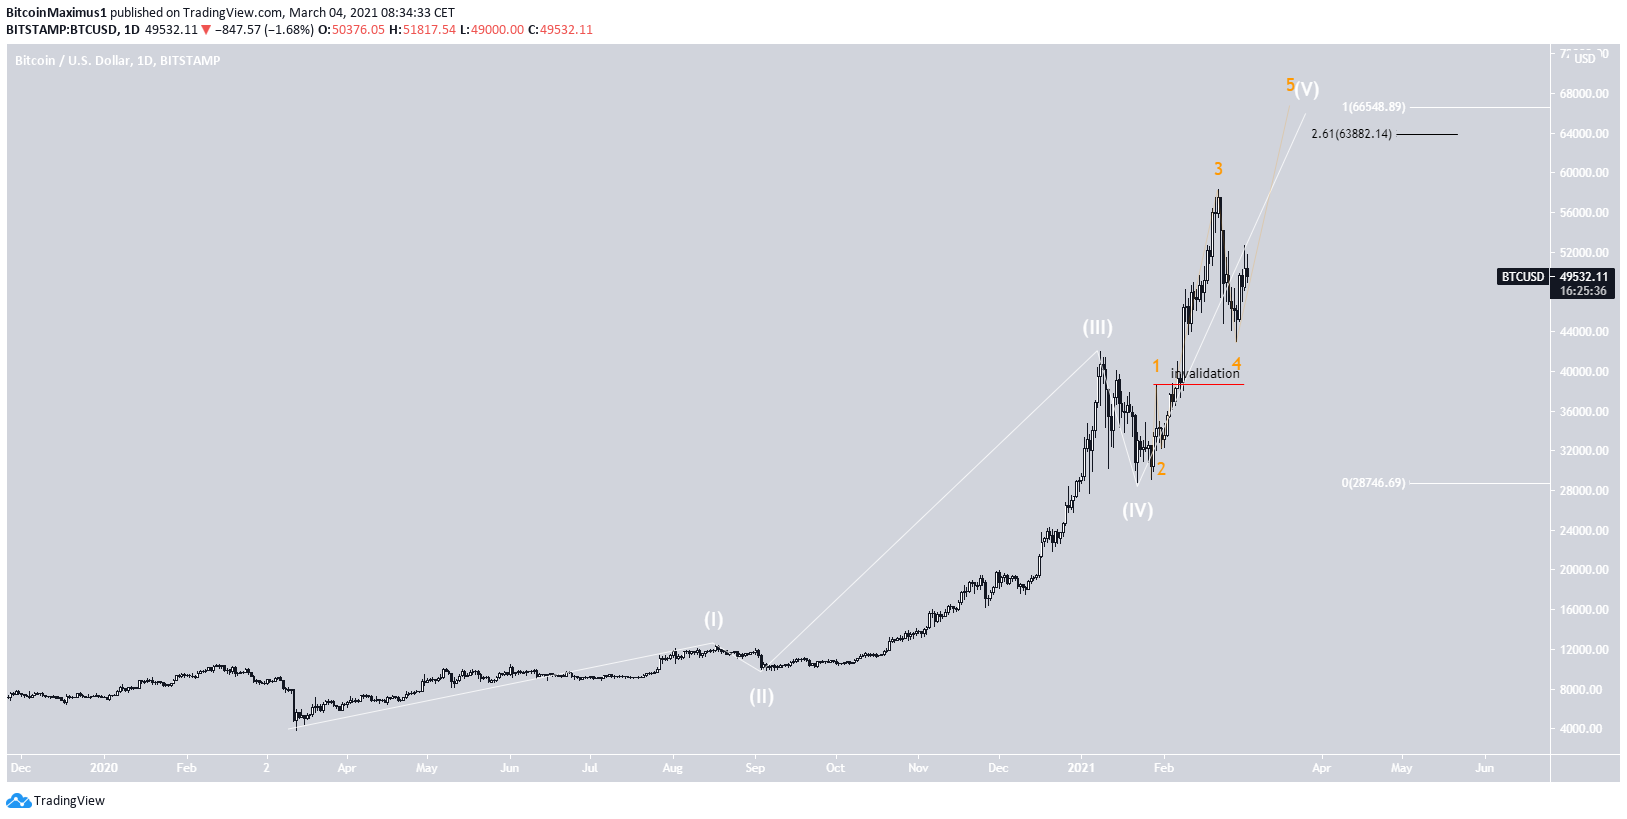
The long-term wave count suggests that BTC is in sub-wave five (orange) of wave five (white) in a bullish impulse that began in March 2020.
The most likely target for the top of this movement is found between $63,882 and $66,548. These levels are found by using an external Fib retracement on wave four (black Fib) and projecting the length of waves 1-3 (white).
A decrease below the sub-wave one high at $38,620 would invalidate this particular wave count. Moreover, this would suggest that the upward movement has ended.
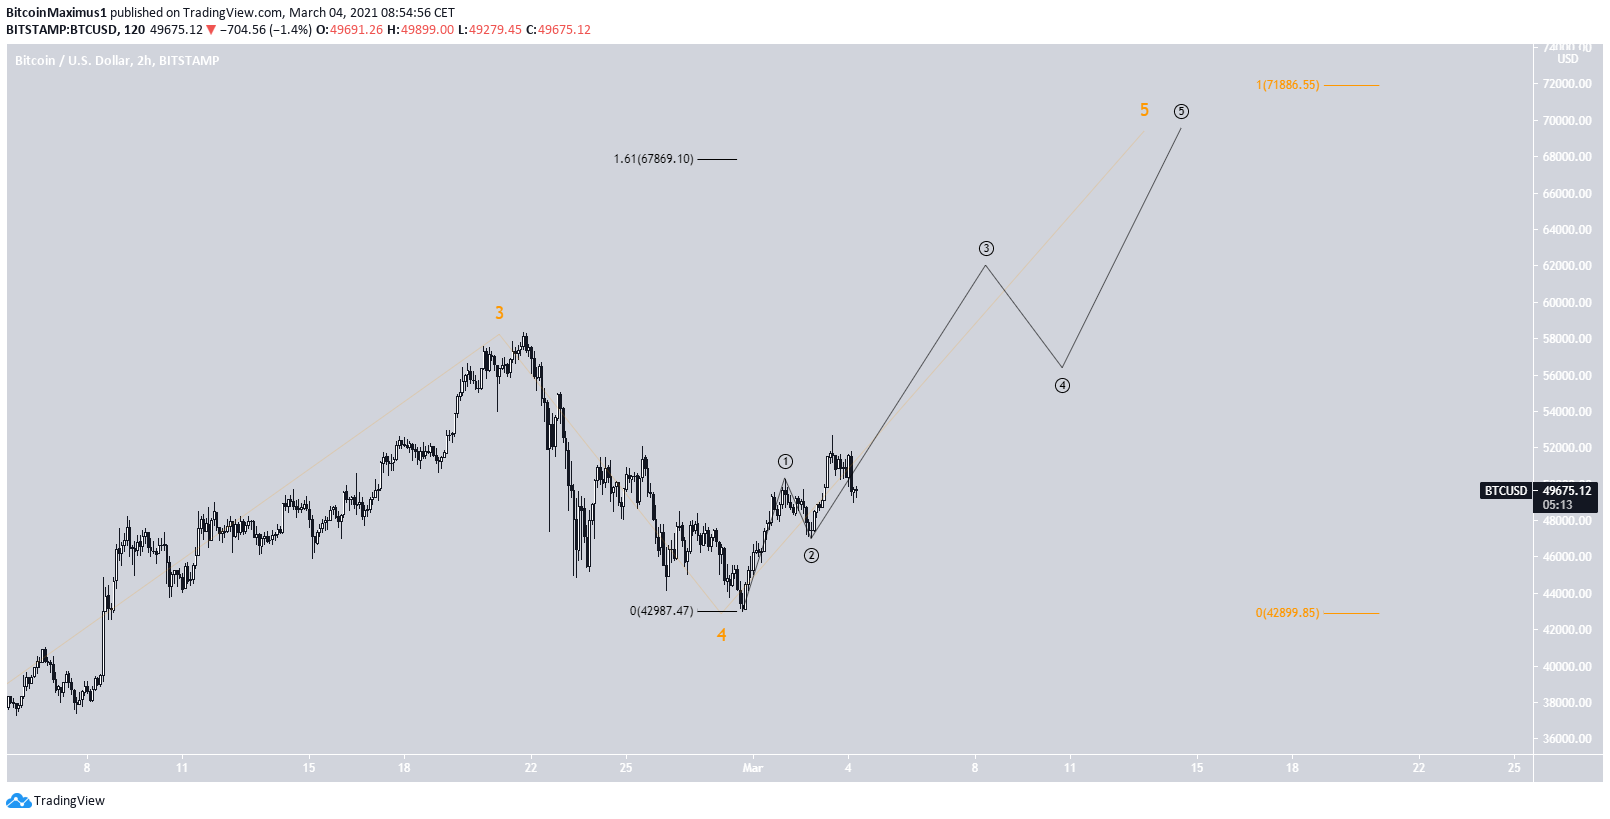
A look at the two-hour chart provides a potential outline for the movement. In addition, it gives slightly higher targets of $67,869 and $71,886.
The minor sub-wave count is shown in black.
Conclusion
Bitcoin is expected to bounce at one of the short-term support areas and continue increasing. Following this, a breakout from the $52,475 resistance area is expected.
For BeInCrypto’s previous Bitcoin (BTC) analysis, click here.
Disclaimer
In line with the Trust Project guidelines, this price analysis article is for informational purposes only and should not be considered financial or investment advice. BeInCrypto is committed to accurate, unbiased reporting, but market conditions are subject to change without notice. Always conduct your own research and consult with a professional before making any financial decisions. Please note that our Terms and Conditions, Privacy Policy, and Disclaimers have been updated.
