
Bitcoin (BTC) began the week of July 19-25 with a downward move that led to a low of $29,278 on July 20. However, the price has been increasing since, reclaiming the $31,300 horizontal support area.
BTC is approaching the range highs at $40,550, a breakout above which could allow the sharp upward move to continue.
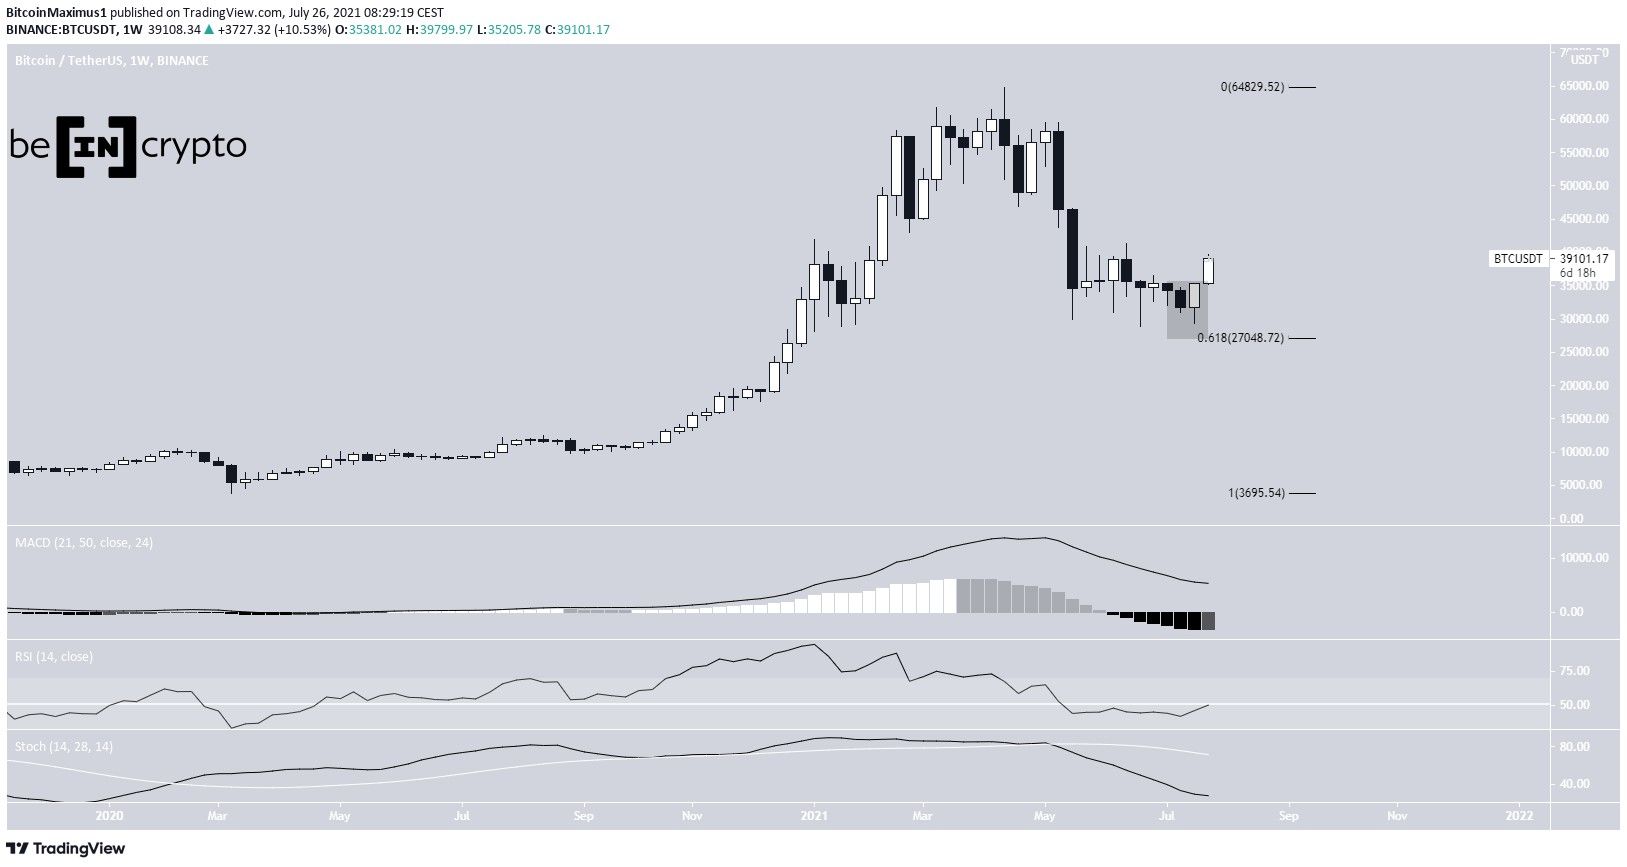
Long-term BTC movement
BTC began the week of July 19-25 by decreasing, falling to a low of $29,278. However, a sharp upward movement followed and it managed to reach a high of $35,398 and a close of $35,381. This created a bullish engulfing candlestick.
BTC is still trading above the 0.618 Fib retracement support level of $27,050.
Despite this, technical indicators in the weekly time-frame are still bearish. The MACD is negative and is falling, the RSI has decreased below 5, and the Stochastic oscillator has made a bearish cross.
Therefore, it’s likely that the long-term trend is still bearish.
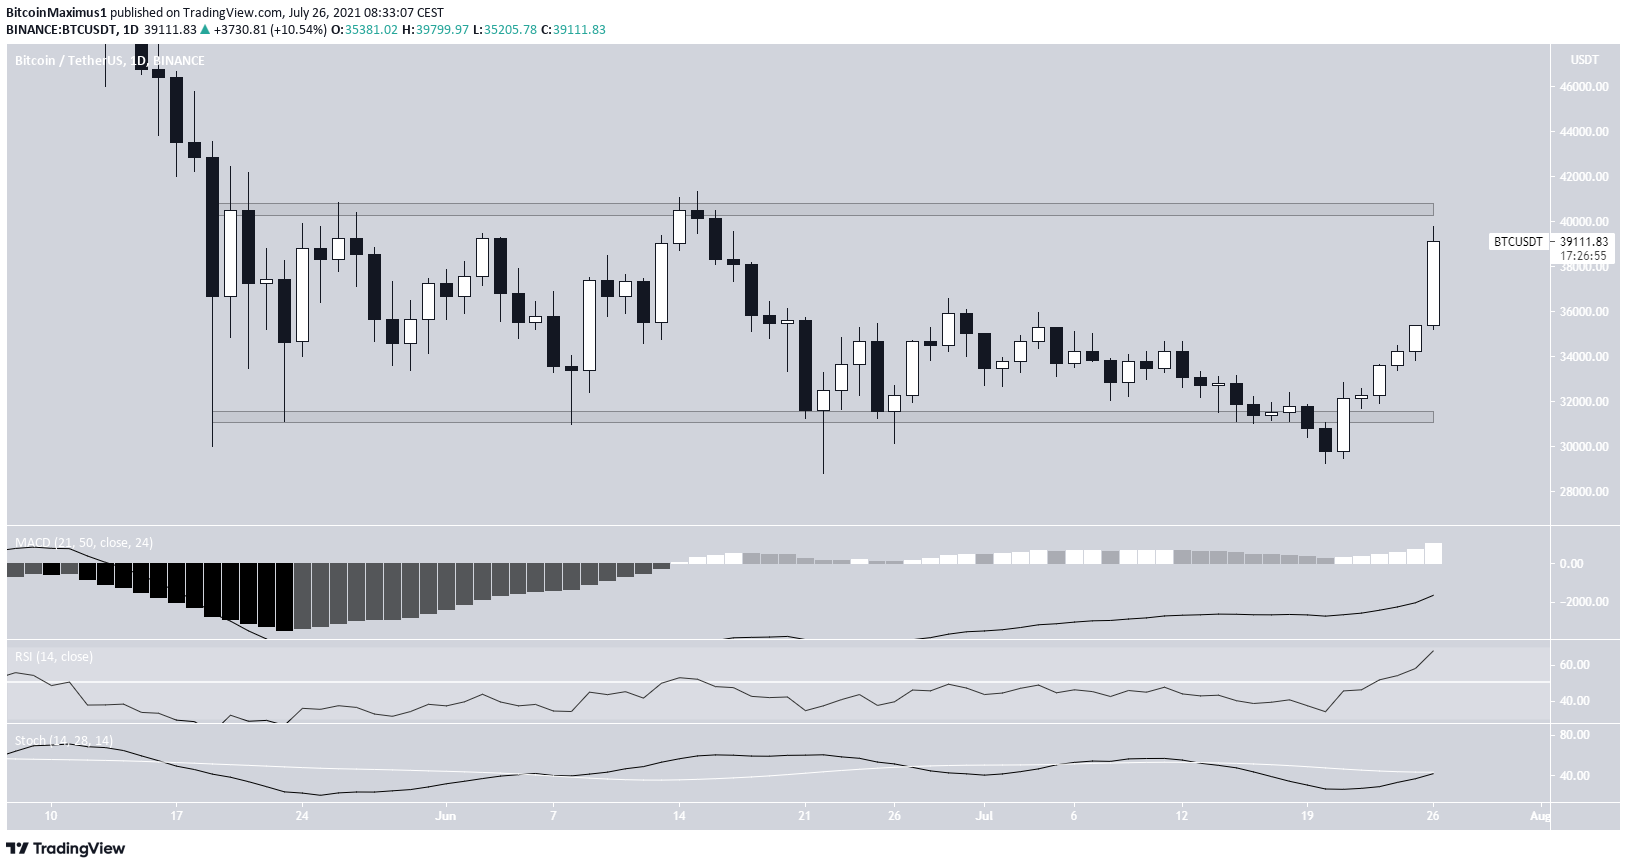
BTC reclaims support
The daily chart provides a more bullish outlook. We can see that the decrease of July 20 turned out to be only a deviation, since BTC reclaimed the $31,300 horizontal area shortly afterwards.
Afterwards, it initiated a rapid upward move and created six bullish candlestick in a row.
So far, it has reached a high of $39,799 and is very close to the range high of $40,500.
Unlike the weekly time frame, technical indicators are bullish on the daily chart. The RSI has moved above 50 and the Stochastic oscillator is close to making a bullish cross. In addition to this, the MACD is moving upwards, even though the signal line is not positive yet.
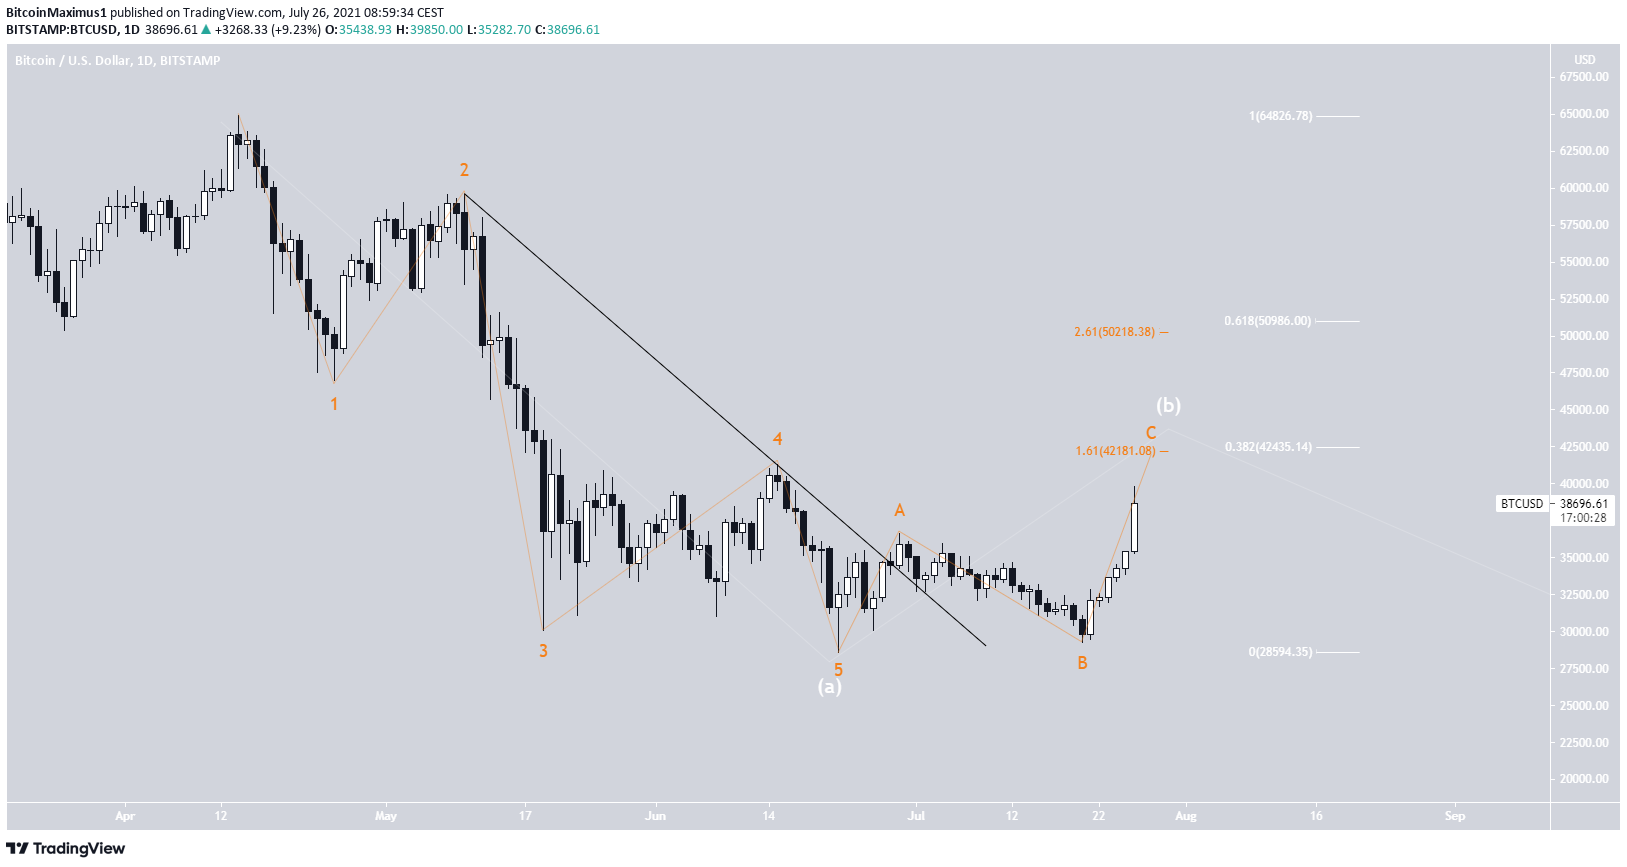
Wave count
The most likely wave count suggests that BTC is in the B wave (white) of a long-term A-B-C corrective structure that’s been in place since the April all-time highs.
The sub-wave count is shown in orange, suggesting that BTC is in sub-wave C.
The most likely target for the top of this move is between $42,181 and $42,435. This would give waves A:C a 1:1.61 ratio (orange) and would reach the 0.382 Fib retracement resistance level (white).
Beyond that, BTC could make its way to the range of $50,218 and $50,986. This would give waves A:C a 1:2.61 ratio and would reach the 0.618 Fib retracement resistance level.
Following this BTC would be expected to decrease once again.
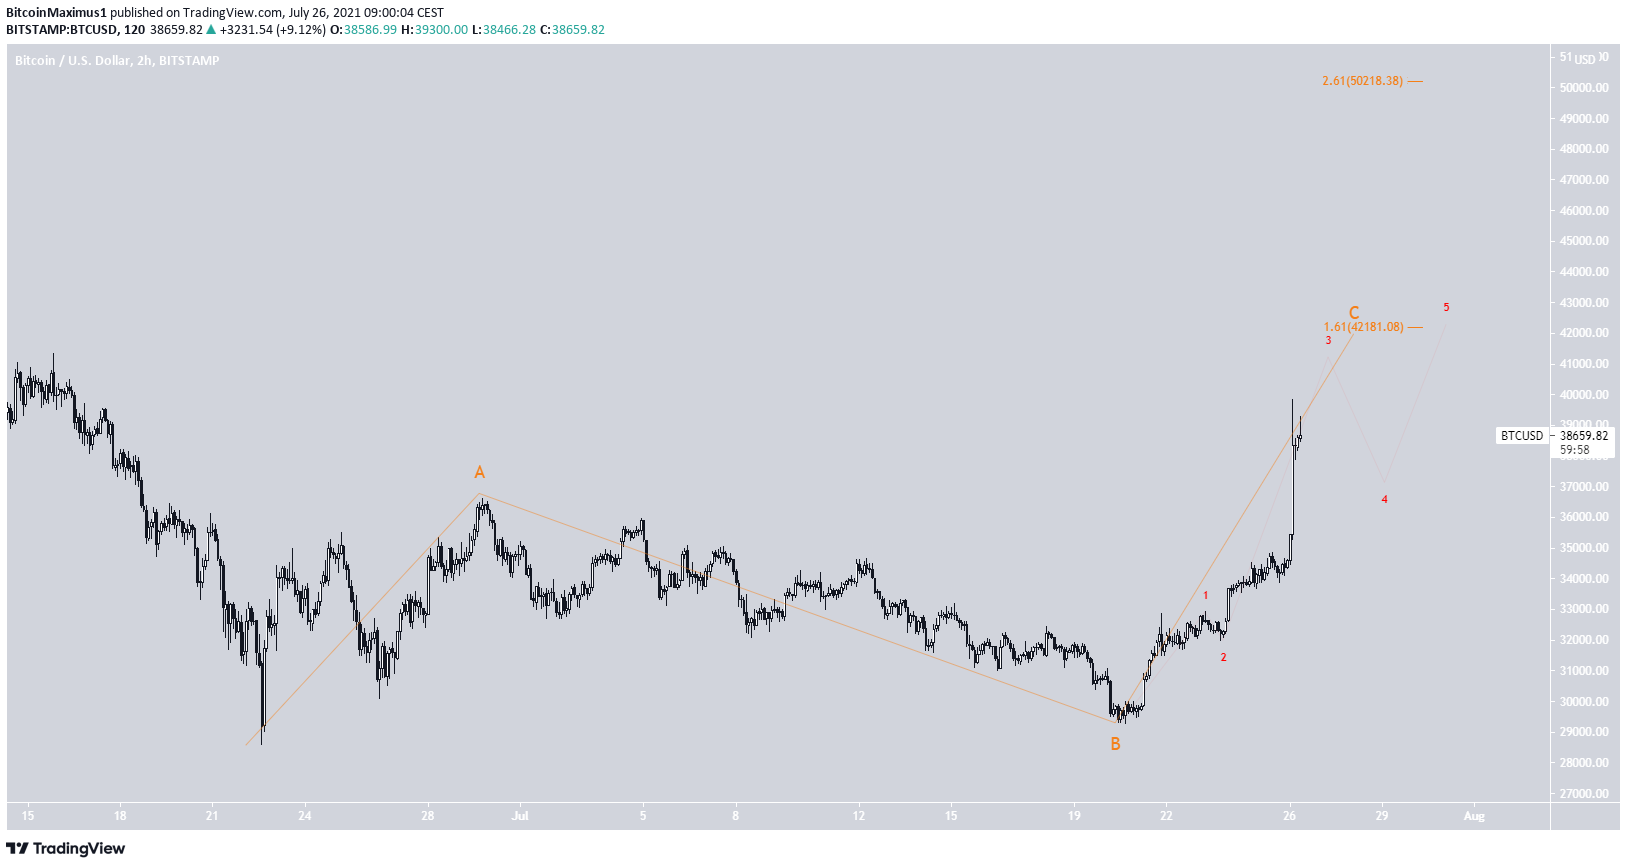
The two-hour chart shows that BTC is in sub-wave three (red) of a five wave impulse.
Where bitcoin goes from here will largely depend on where sub-waves 3 and 4 end.
For BeInCrypto’s previous bitcoin (BTC) analysis, click here.
