
Bitcoin (BTC) broke down on June 22. falling to a low of $28,805. However, it rallied back up almost immediately, reaching a close of $32,509.
While technical indicators are still bearish, the most likely wave count indicates that the bottom is in.
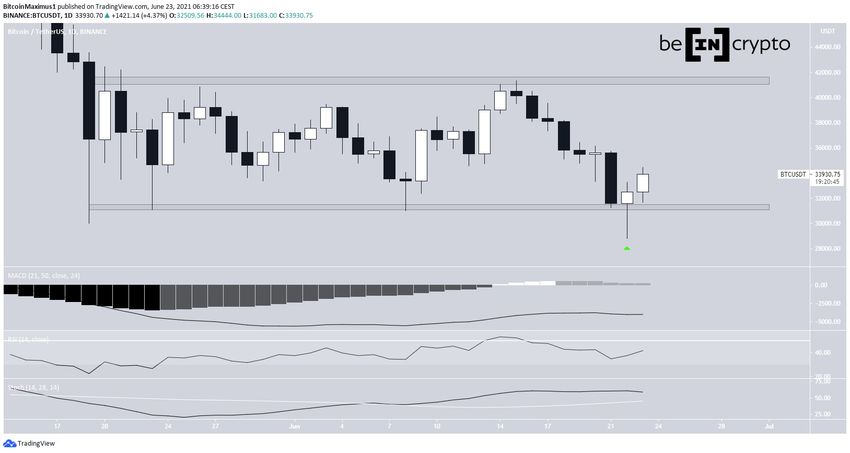
BTC breaks down and bounces
On June 22, BTC broke down and reached a low of $28,805. However, it bounced almost immediately after, creating a bullish hammer candlestick in the process (green icon). In addition, it managed to reclaim the $31,300 support area in the process.
Despite the rally, daily time-frame indicators are still bearish. The MACD signal line is negative, the RSI is below 50, and the Stochastic oscillator has yet to move upwards.
The closest resistance area is found at $41,500.
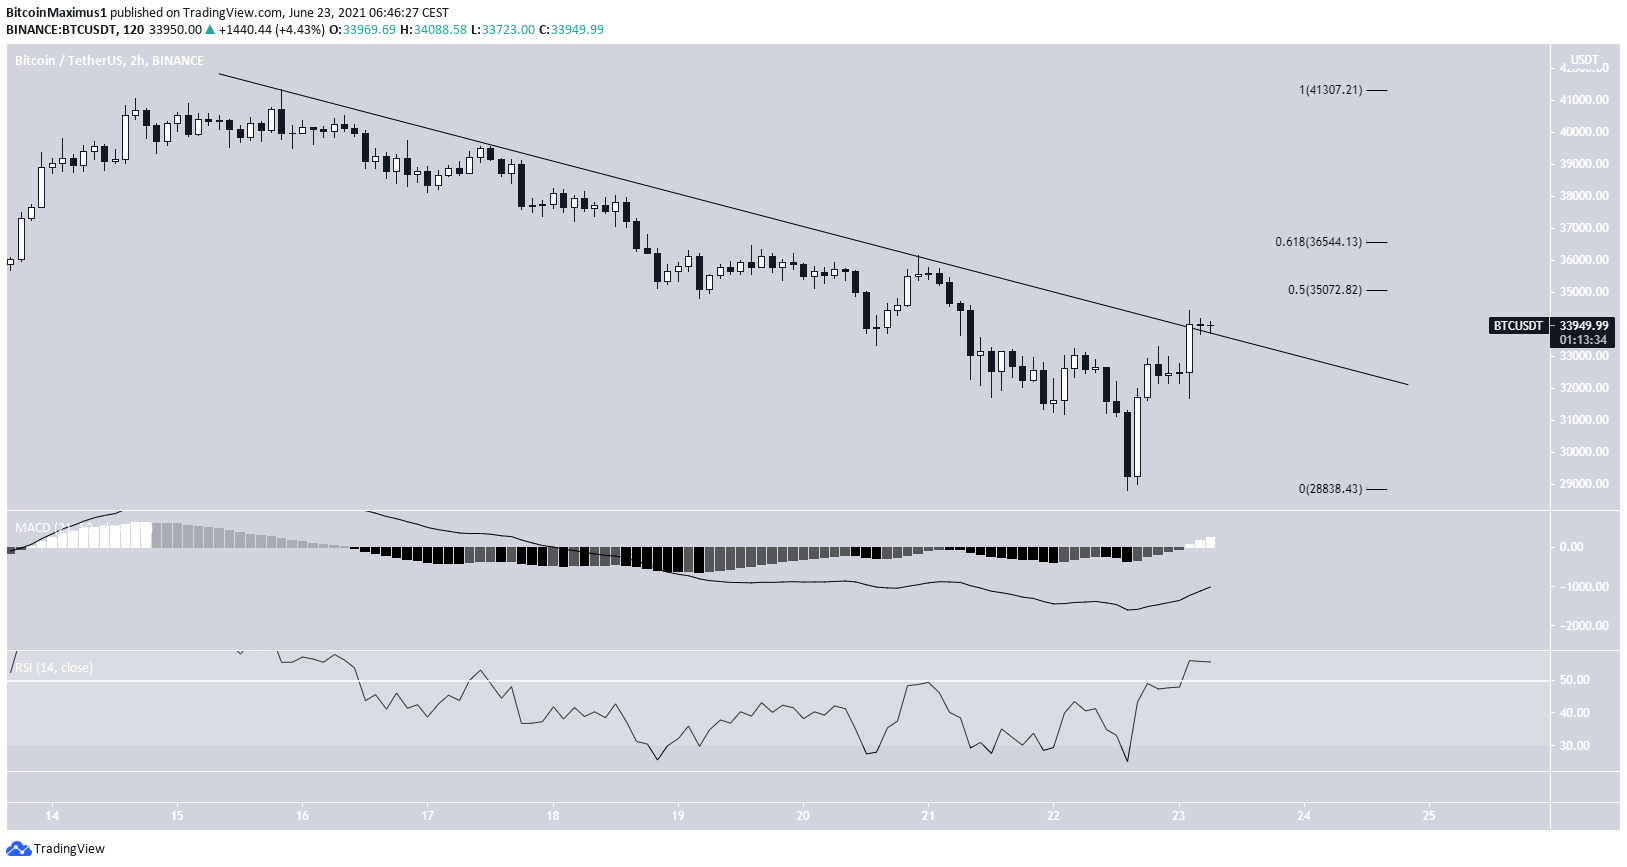
Potential breakout
The two-hour chart shows that BTC is in the process of breaking out from a descending resistance line that has been in place since the June 15 high of $41,330.
The next closest resistance levels are at $35,070 and $36,540. These are the 0.5 and 0.618 Fib retracement resistance levels.
Both the MACD and RSI are bullish, supporting the possibility that the upward movement continues.
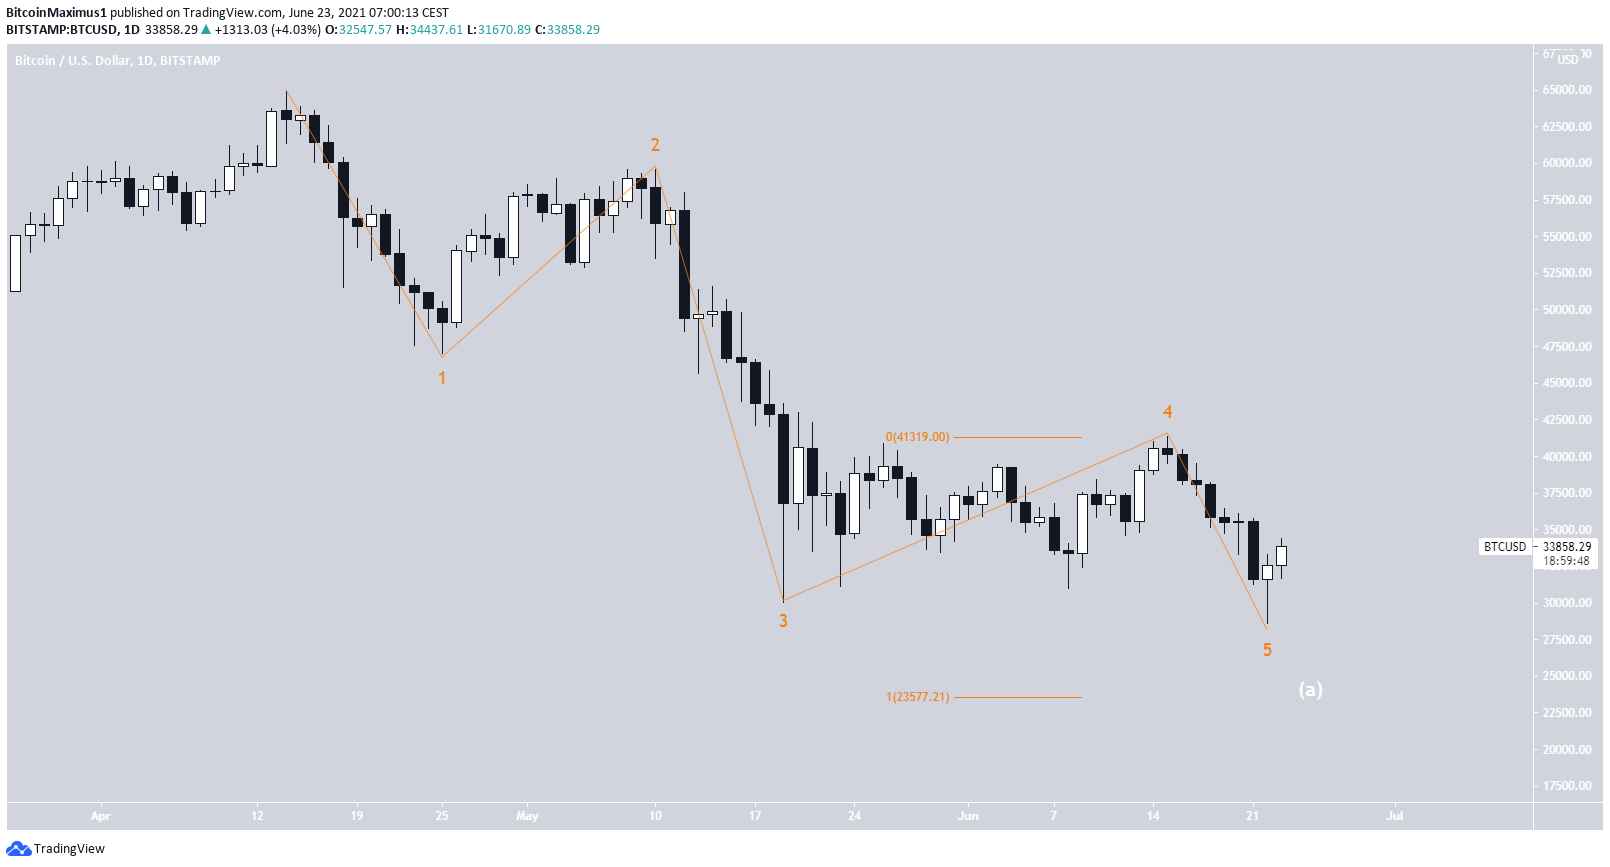
Wave count
In the long-term, BTC is in or has just completed wave five of a bearish impulse. This would complete a longer-term wave A.
While it’s valid, the fifth wave is very short, failing to even reach the length of wave one at $23,577.
The other possibility is that the entire decrease is part of sub-wave one (red).
Nevertheless, both possibilities predict BTC increasing towards at least $35,000 and potentially $36,500. Whether the increase is a three-wave or a five-wave structure will determine the direction of the future trend.
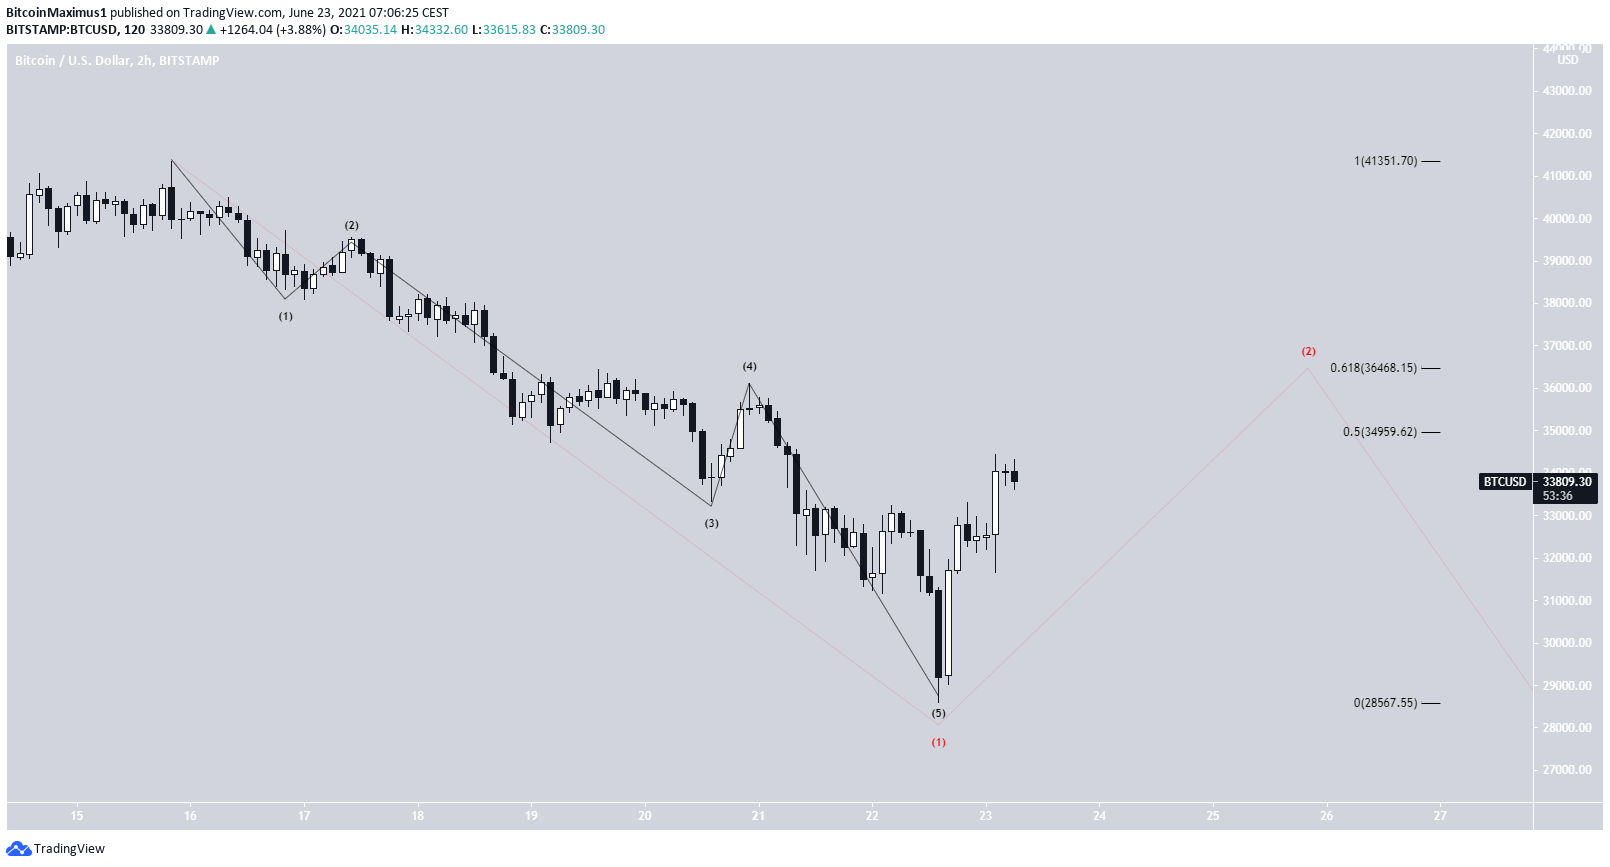
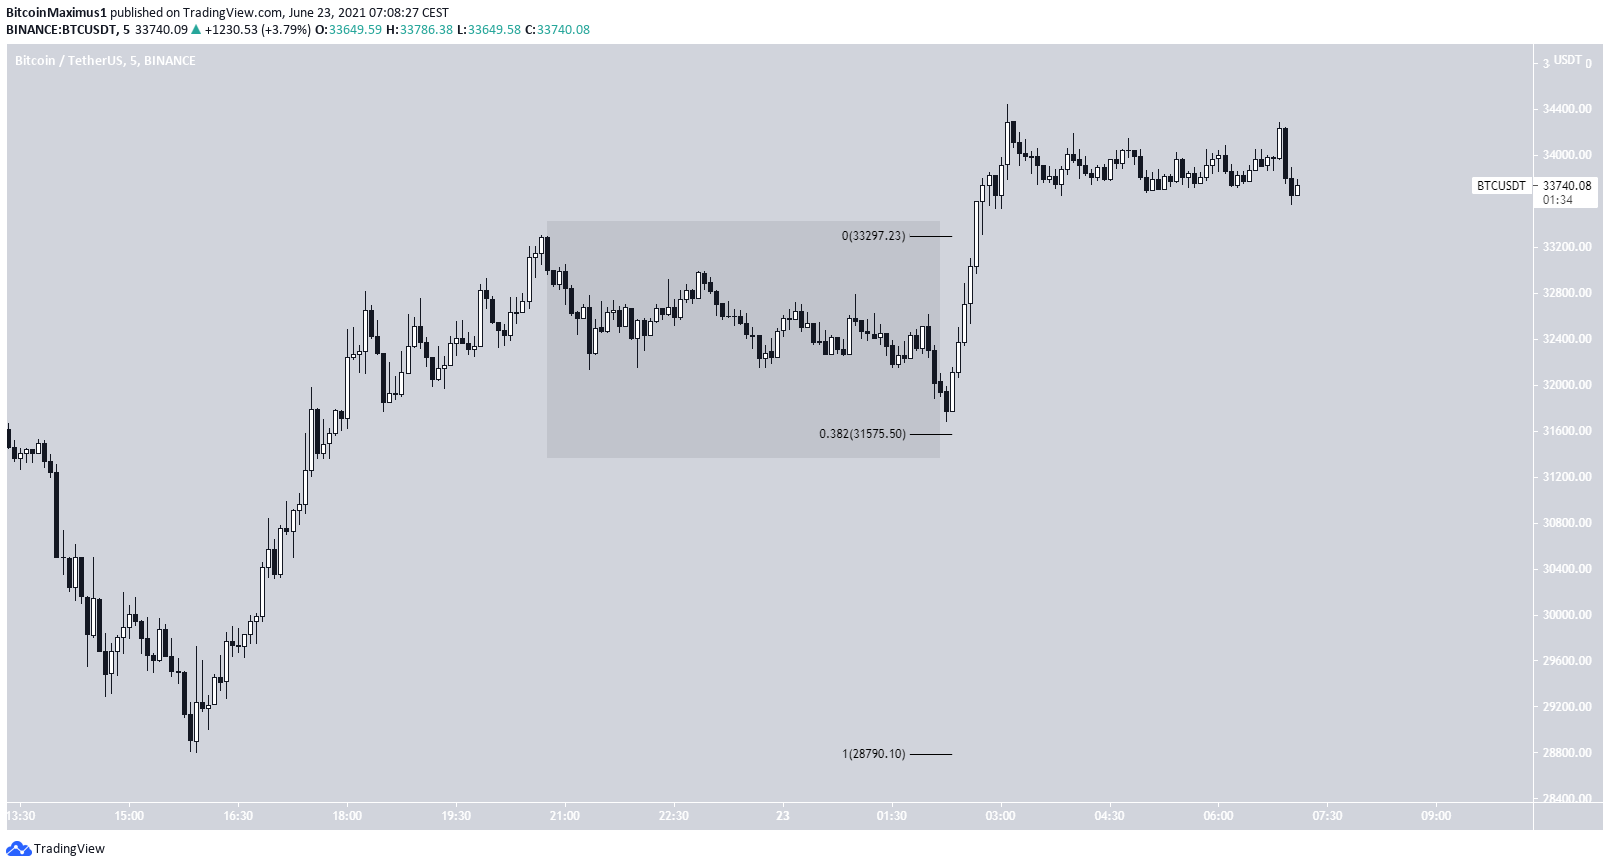
The correction after the original upward movement (highlighted in black) was very shallow, failing to even reach the 0.382 Fib retracement resistance level.
Therefore, it’s more likely that this is a wave 2 rather than a B wave, supporting the possibility that wave five is done and the bottom is in.
For BeInCrypto’s latest bitcoin (BTC) analysis, click here.
