


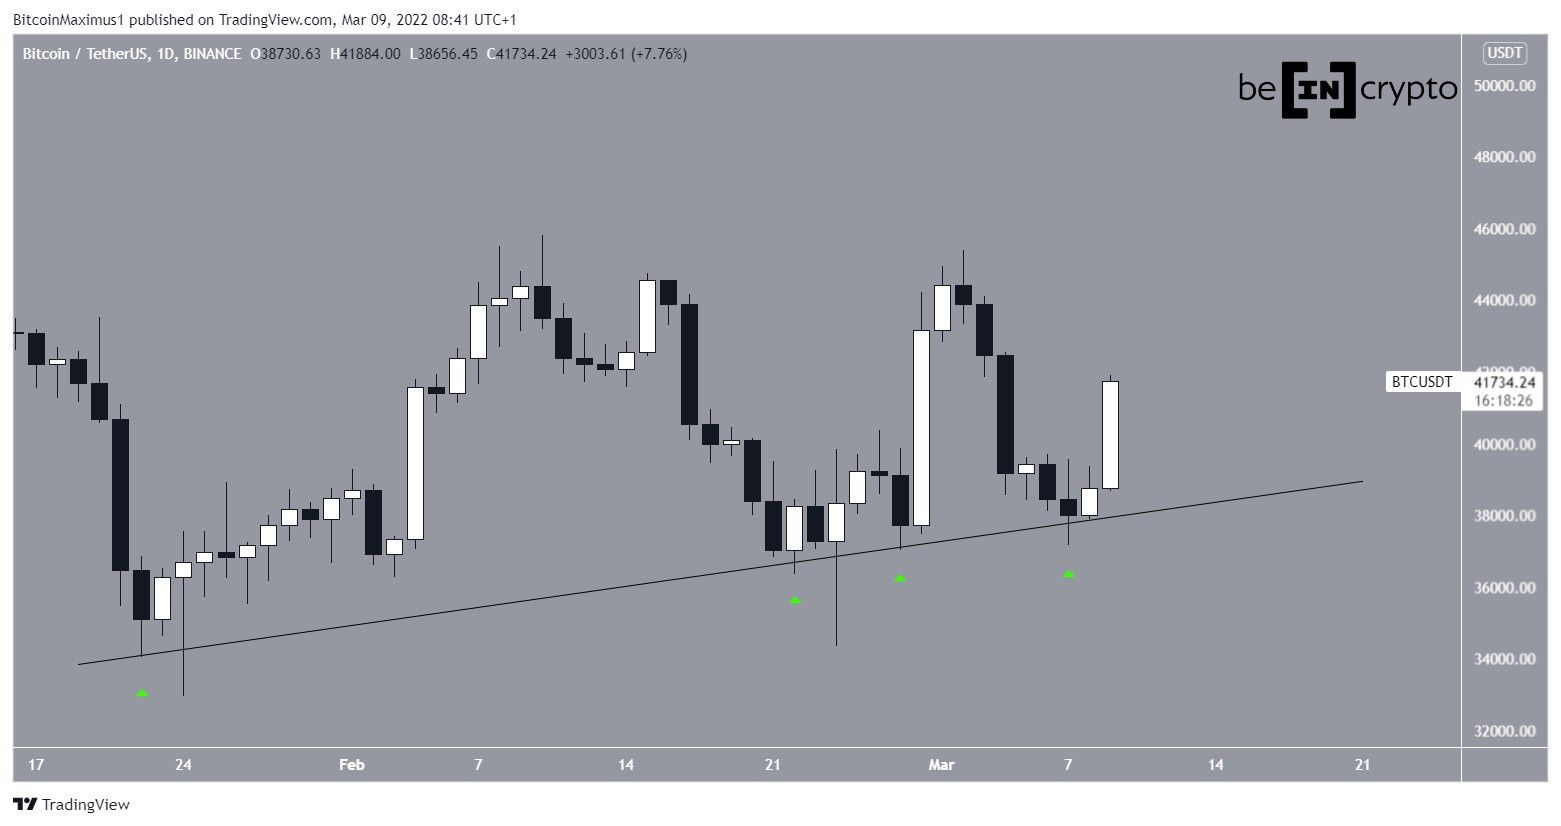
Bitcoin (BTC) has been increasing since March 7 and managed to break out from a short-term resistance level on March 9.
Bitcoin has been increasing above an ascending support line since Jan. 22. The line has been validated four times (green icons), most recently on March 7. In addition to this, BTC seemingly broke down below this level twice, but created long lower wicks and reclaimed the support line shortly after.
After rebounding from the support on March 7, the price increased slightly the next day but initiated a more significant rally on March 9, which is still ongoing. So far, it has reached a high of $42,400.
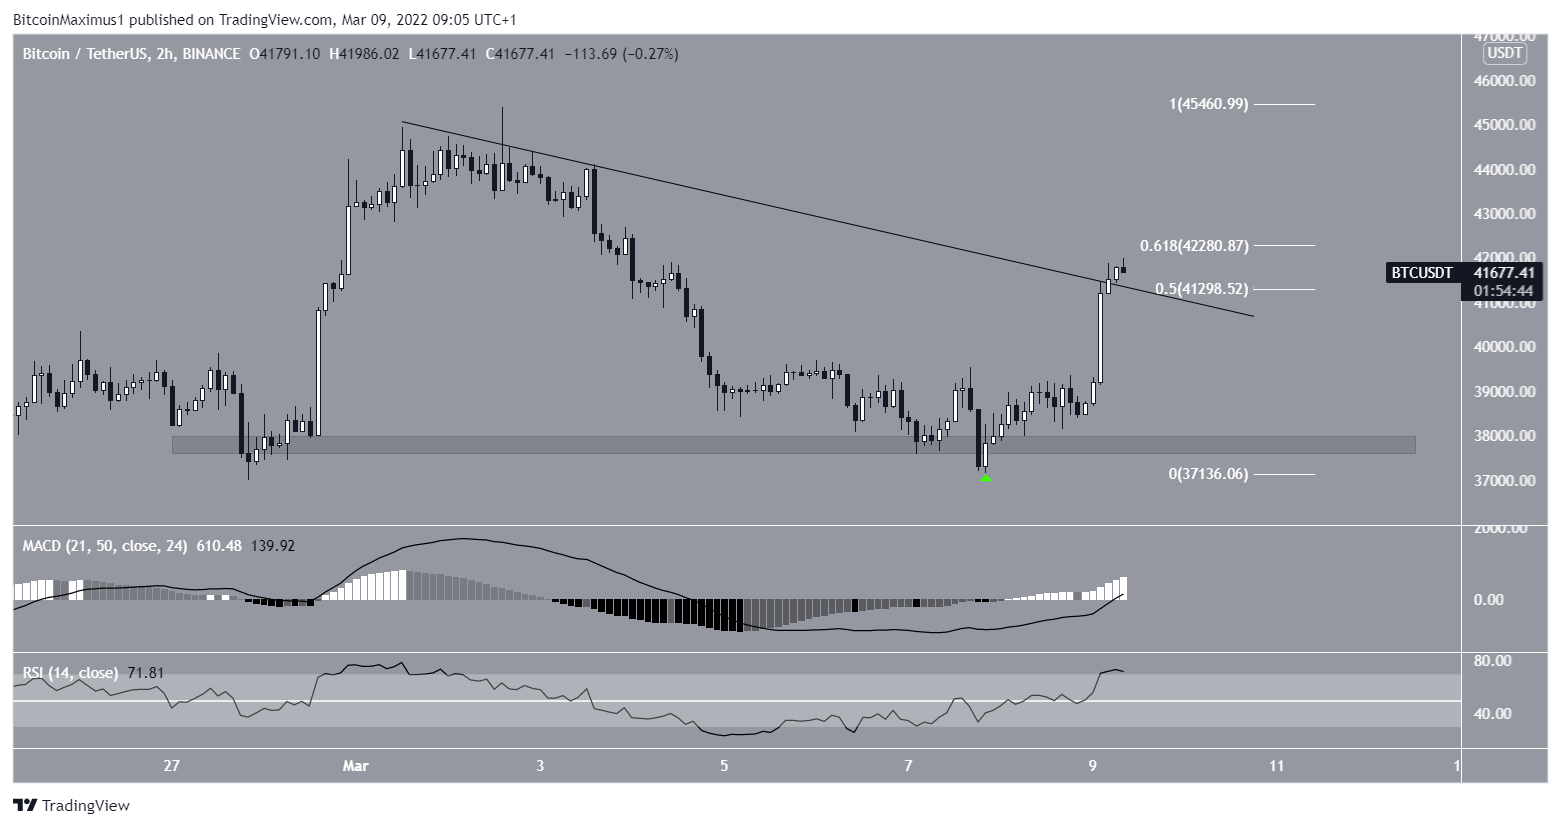
Bitcoin moves above descending resistance
The two-hour chart shows that the turning point occurred on March 7, after BTC bounced at the $37,800 horizontal support area (green icon).
This has caused BTC to break above a descending resistance line that had previously been in place since the beginning of March.
Currently, it’s trading between the 0.5-0.618 Fib retracement resistance levels at $41,300-$42,250. Reclaiming this level would go a long way in suggesting that the short-term trend is bullish.
Currently, neither the MACD nor RSI are showing any signs of weakness, since both are moving upwards. In addition to this, the MACD is positive and the RSI is above 70 — both common signs of a bullish trend.
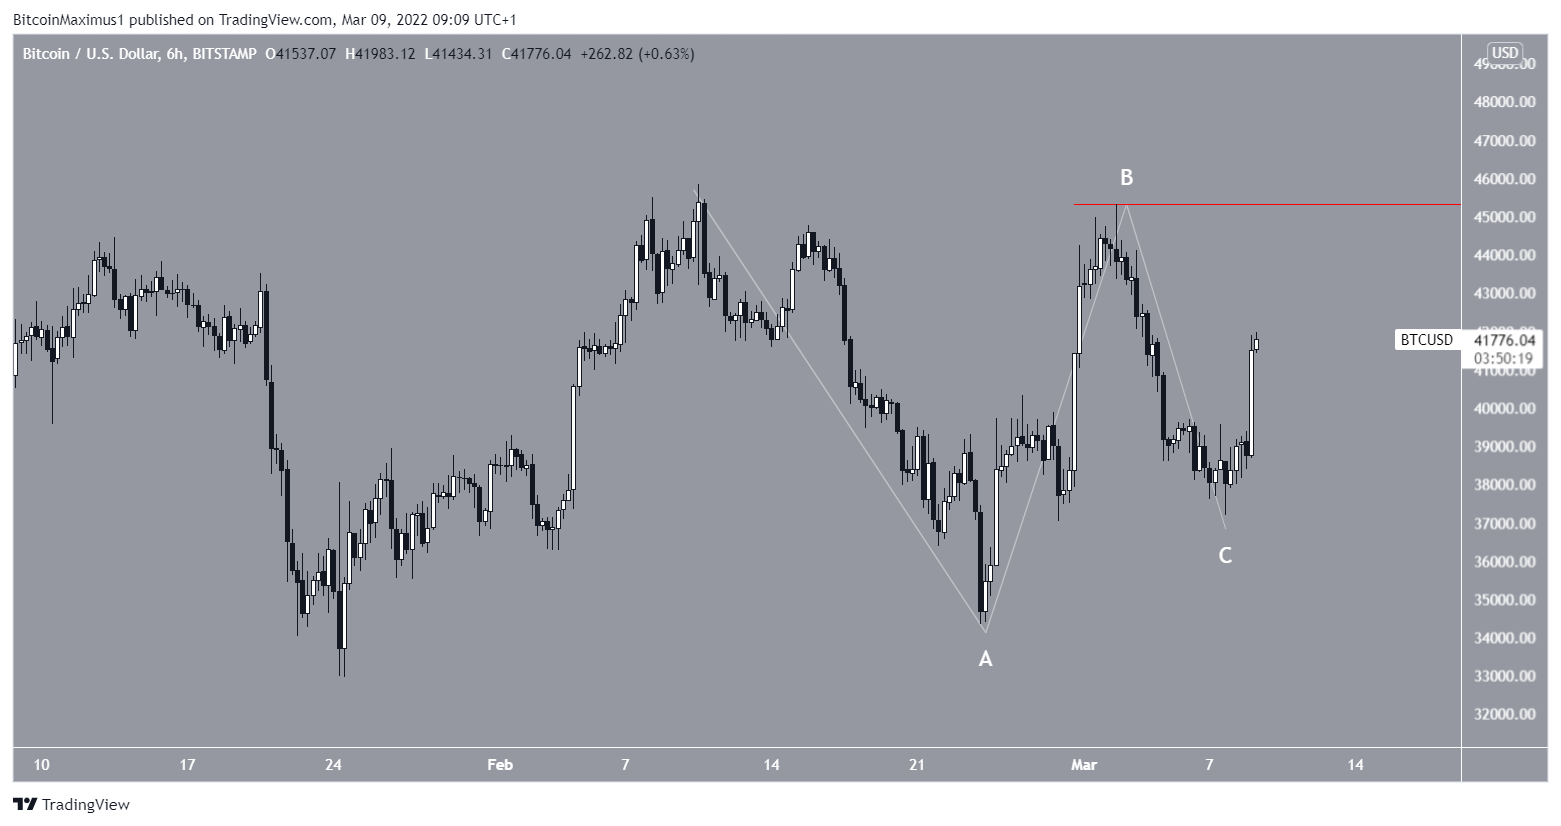
Wave count analysis
The long-term wave count remains unclear and there are several potential short-term BTC wave counts at play.
The first count suggests that a five-wave downward move ended on March 7. In this scenario, the ongoing increase is part of an A-B-C corrective structure. If BTC gets rejected at the current level, it would indicate that this is likely the correct count and new lows will follow.

The bullish count suggests that the decrease since Feb. 10 was part of a running flat correction. In it, the C wave was truncated and failed to drop below the lows of wave A.
If correct, this could lead BTC to new local highs. An increase above $45,332 would confirm that this is the correct wave count.
For BeInCrypto’s previous Bitcoin (BTC) analysis, click here


