
The bitcoin (BTC) price rebounded impressively last week, providing strong signs of long-term bullish continuation.
BTC is expected to continue moving upwards, resuming its bullish trend.
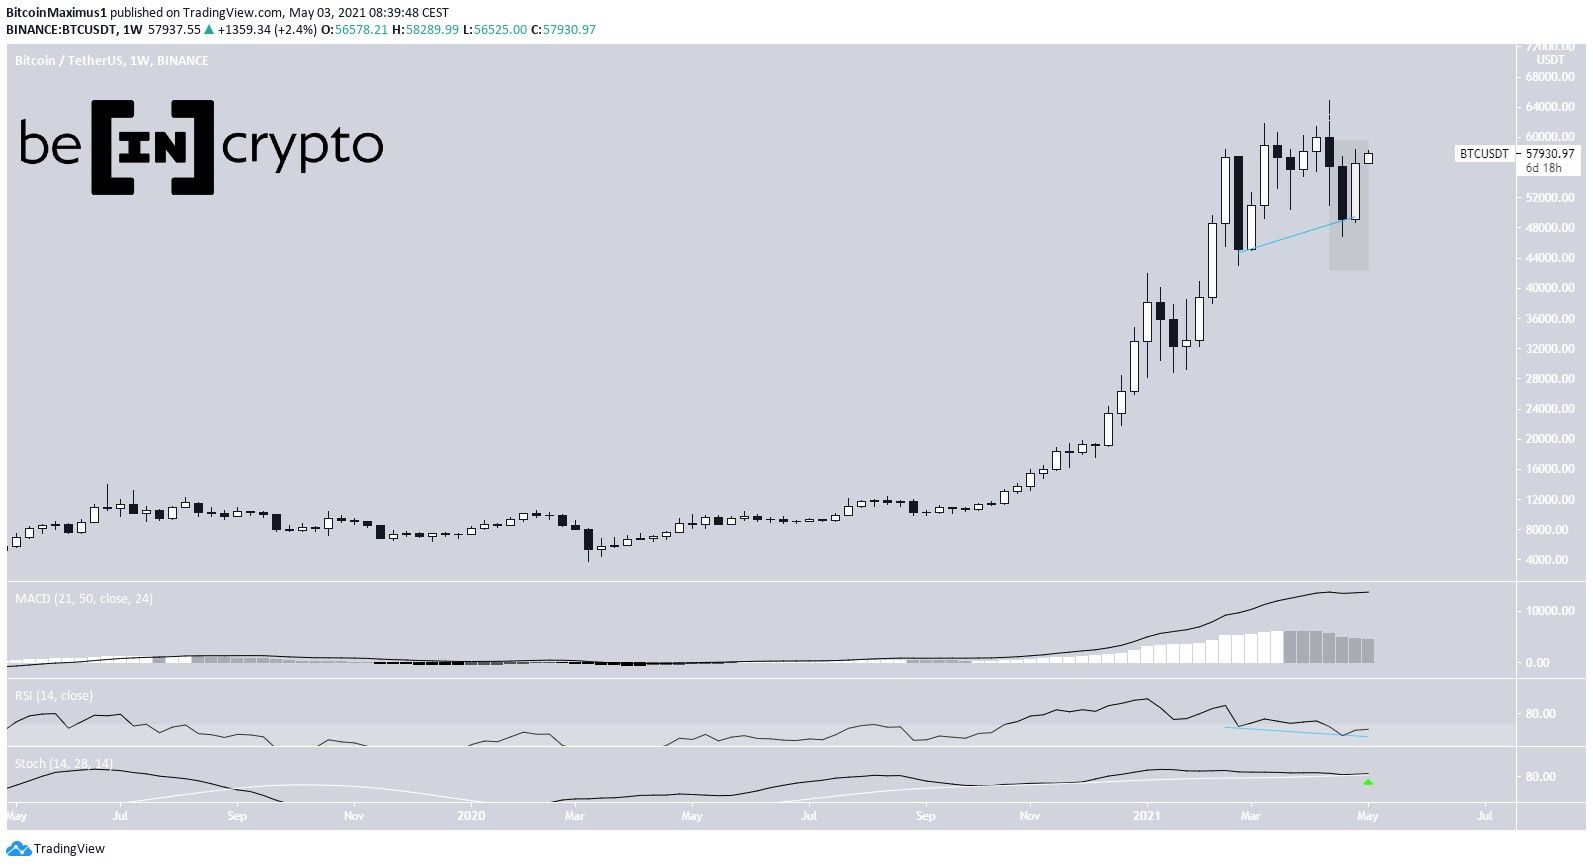
Weekly BTC movement
BTC rebounded impressively last week, creating a bullish engulfing candlestick in the process. This suggests that the buyers are back in control after the selling that briefly took the price below $50,000 two weeks ago.
Technical indicators are also bullish. The RSI has generated a hidden bullish divergence, a strong sign of trend continuation. In addition, the Stochastic oscillator has bounced, invalidating a potential bearish cross.
The MACD is losing momentum but is still increasing. Therefore, it’s likely that the long-term BTC trend is still bullish.
Higher low leads to continuation
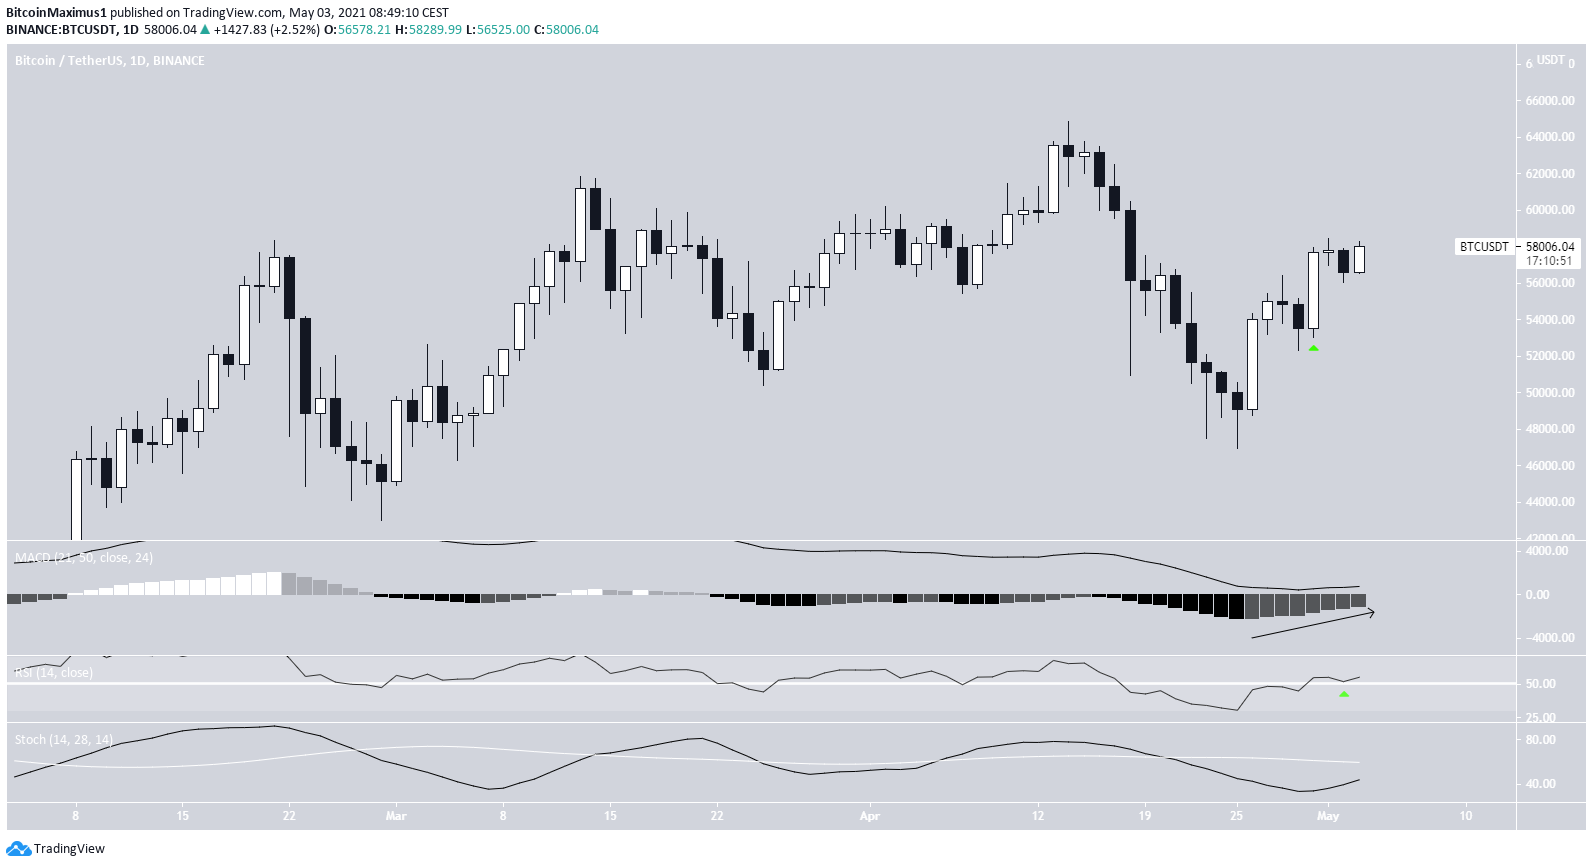
The daily chart is similarly bullish. The price has already created a higher low and is moving upwards.
Technical indicators in the daily time frame are also bullish.
The MACD is increasing and is nearly positive, the RSI has crossed above 50, and the Stochastic oscillator is moving upwards and is close to making a bullish cross.
Therefore, BTC is expected to continue moving upwards.
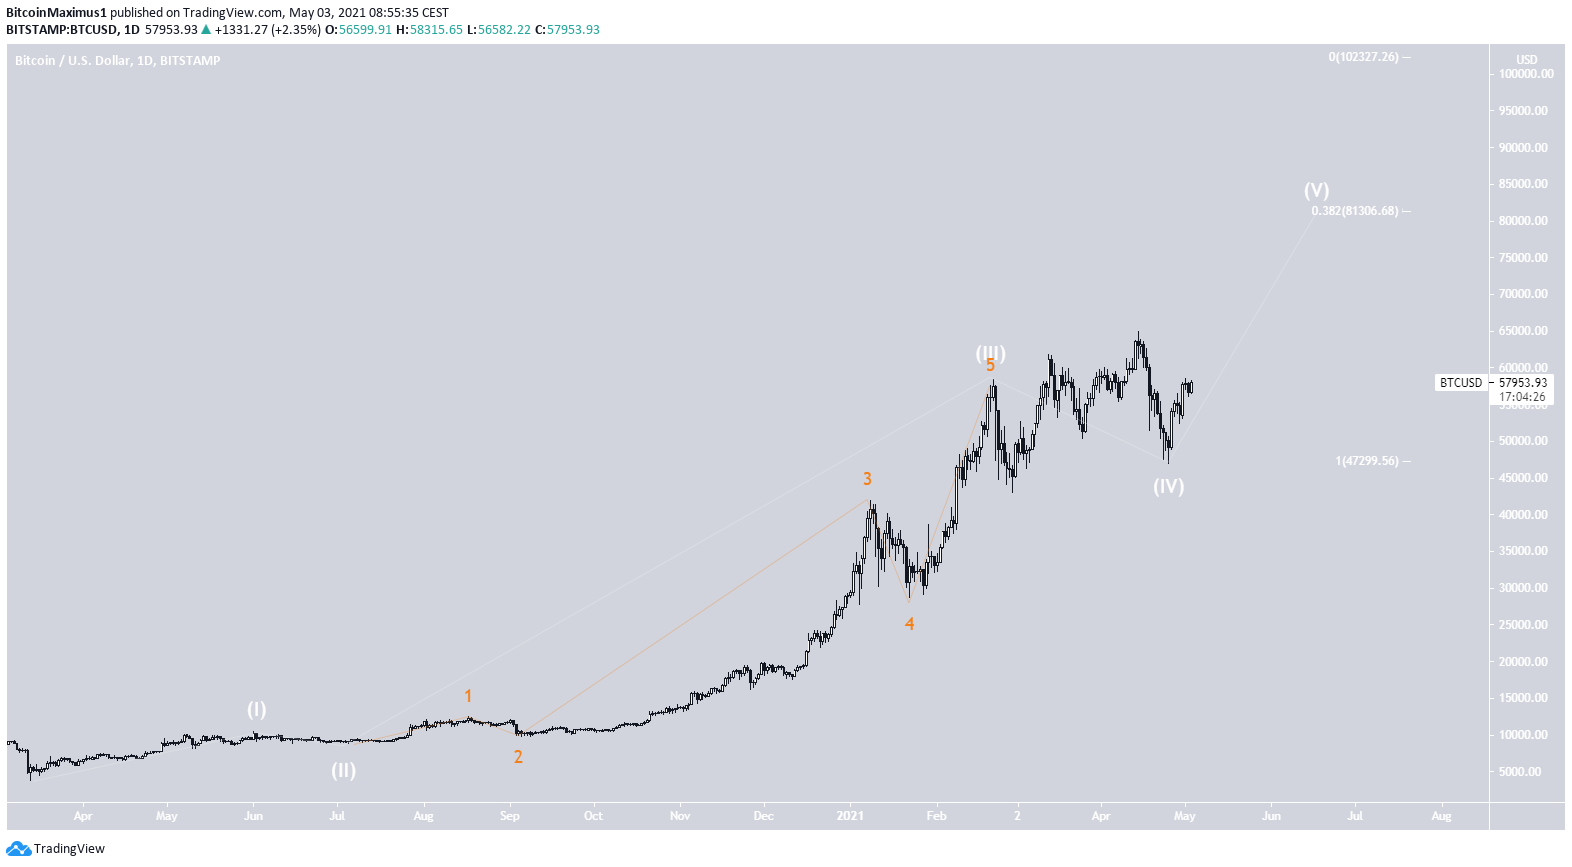
Wave count
The wave count indicates that BTC is still in a long-term bullish impulse (white) that began with the March 2020 low.
If so, the two most likely targets for the top of the entire impulse are located at $81,300 and $102,300. These targets were found by using a Fib projection on waves 1-3.
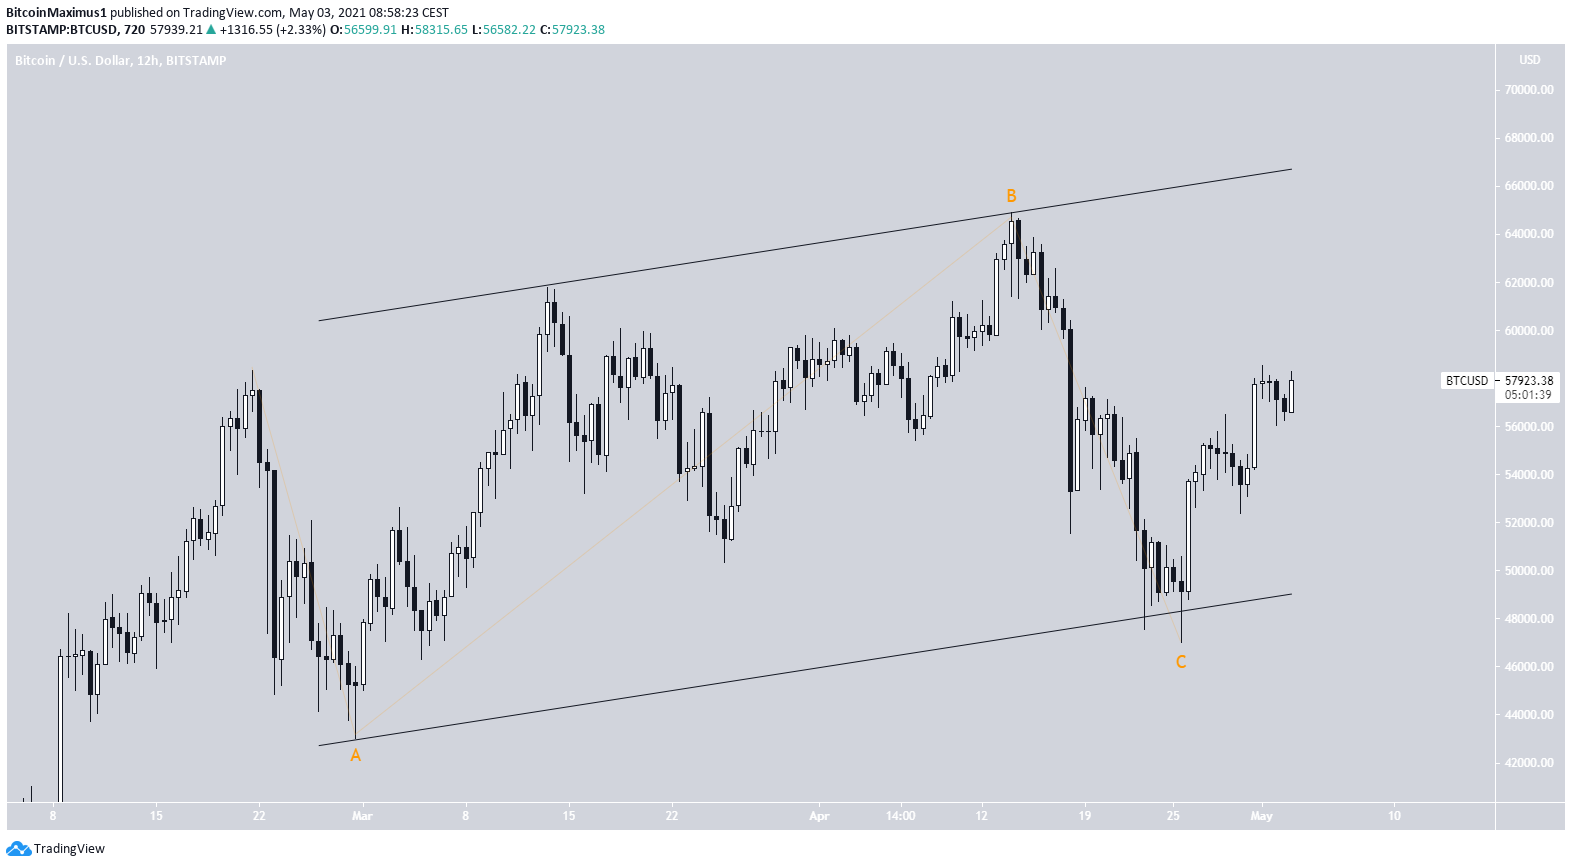
The count suggests that the entire movement since February has been a very large running flat correction. Usually, running flats are followed by a strong breakout.
This fits both with the count and readings from daily indicators.
Conclusion
It’s likely that BTC has just begun wave five of its long-term bullish impulse. This is supported both by the price movement and readings from technical indicators.
For BeInCrypto’s previous bitcoin (BTC) analysis, click here.
