
Bitcoin (BTC) bounced from support on June 8 after reaching a local low of $31,000. It proceeded to create a bullish engulfing candlestick the next day and has so far reached a high of $37,682.
Technical indicators are providing mixed signals. Thus, the trend remains undetermined until a breakdown or reclamation of the short-term resistance area occurs.
BTC bounces at support
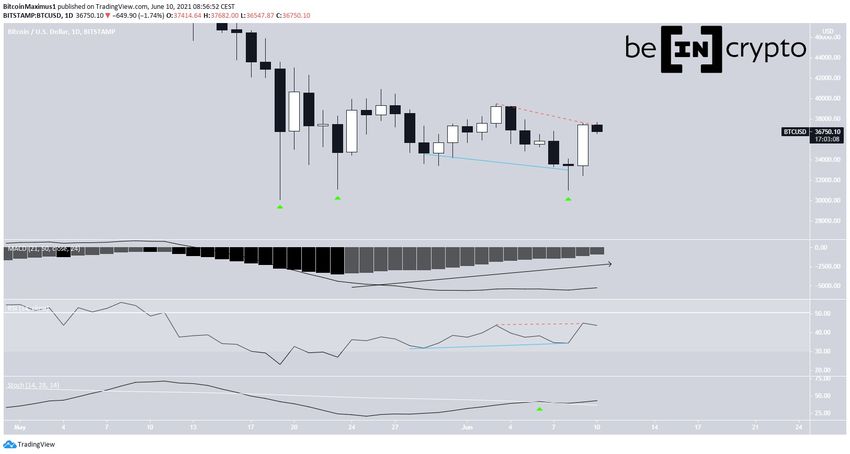
On June 8, BTC reached a low of $31,025 and bounced, creating a long lower wick (green icon). The wick was similar to those created on May 19 and 23, validating the $31,000 level as strong support.
The next day, it created a bullish engulfing candlestick and briefly moved above $37,000. This is a very strong bullish sign.
Technical indicators are leaning on bullish but provide some mixed signs. The MACD histogram has been consistently moving upwards since May 19. However, it’s not yet positive. Furthermore, the signal line is below 0.
The RSI has generated bullish divergence (blue line), preceding the upward movement. However, it has now generated a hidden bearish divergence (red, dashed).
Finally, the Stochastic oscillator has made a bullish cross.
Therefore, technical indicators in the daily time frame do not provide sufficient data to confirm the direction of the trend.
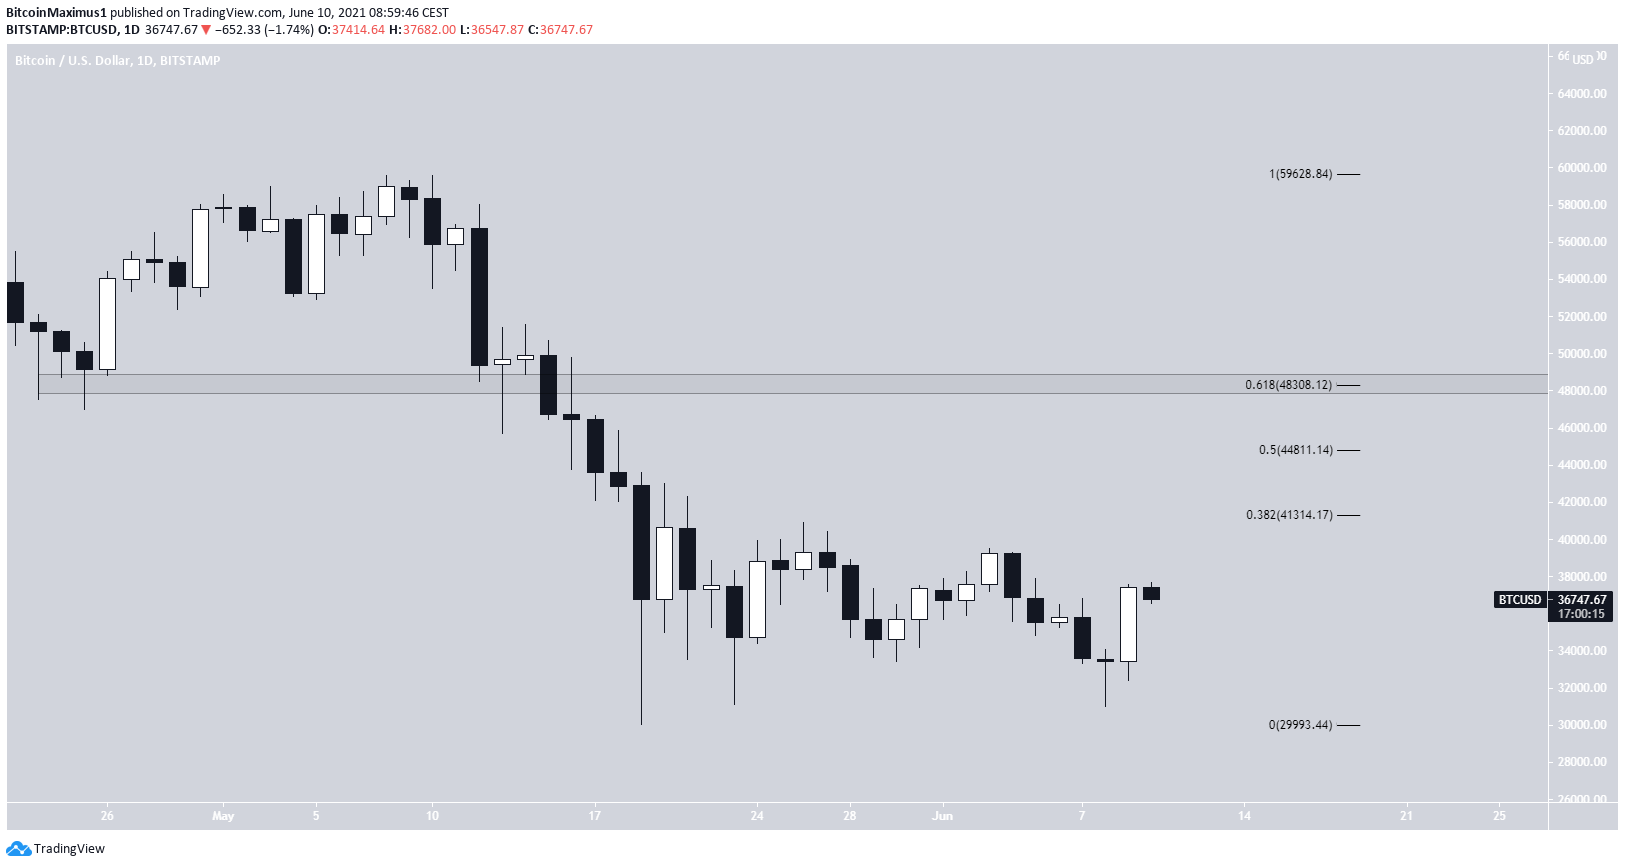
If BTC were to continue moving upwards, the closest resistance areas. would be at $41,400, $44,900 and $48,400. These are the 0.382, 0.5, and 0.618 Fib retracement levels. The latter is also a horizontal resistance area, so reclaiming it would likely confirm that the trend is bullish.
Future movement
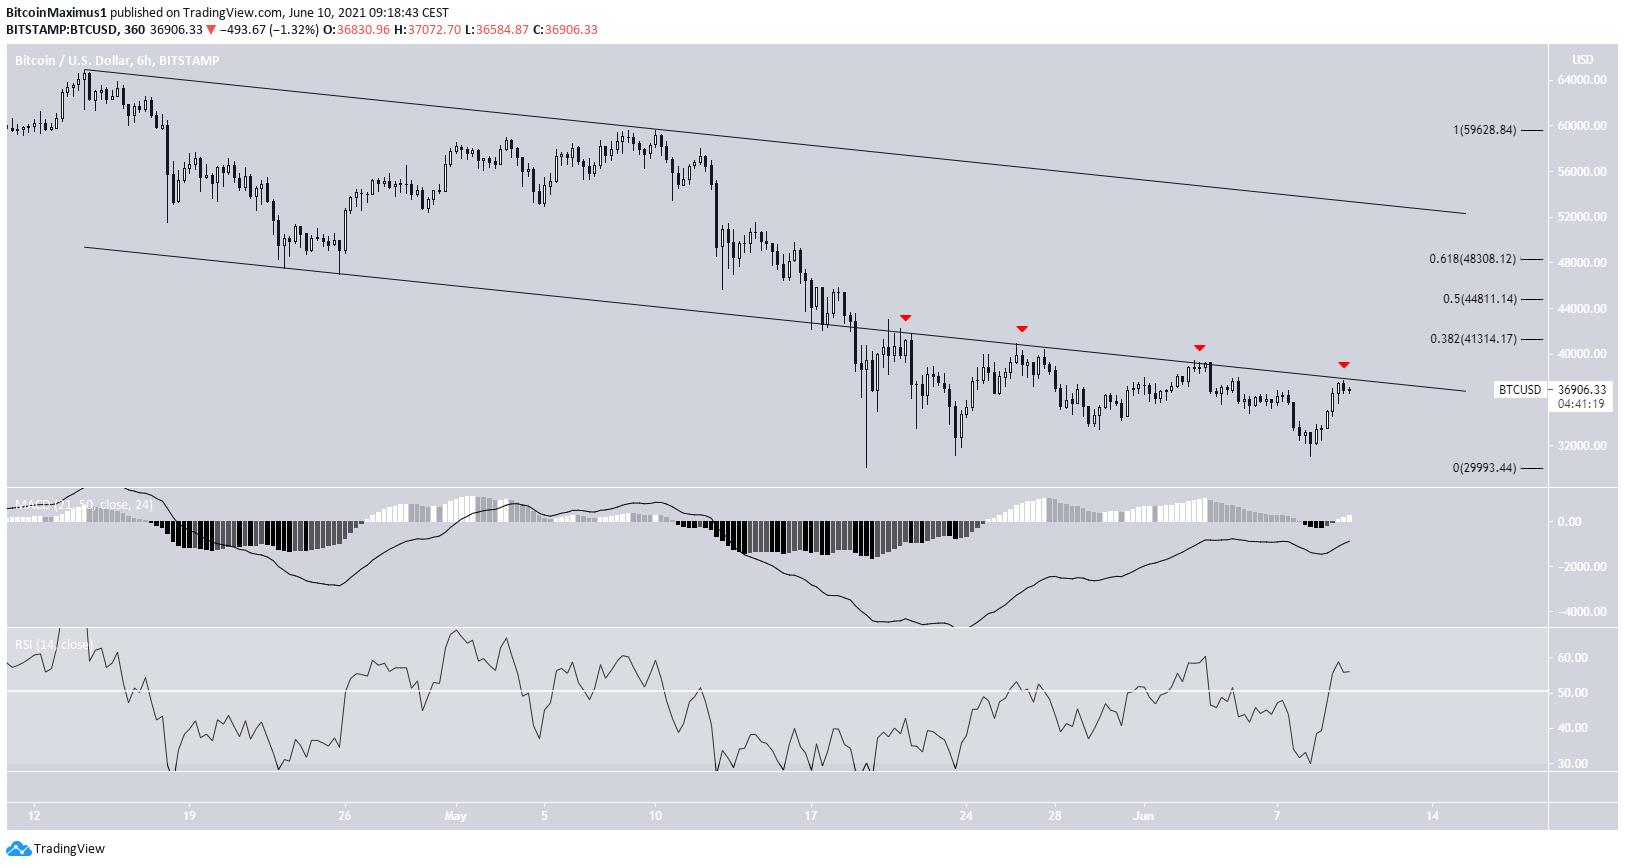
Technical indicators in the six-hour time frame are more bullish. The MACD is positive and the RSI has crossed above 50.
However, yesterday marked the fourth time that BTC was rejected from the support line of the previous descending parallel channel, which has now turned to resistance (red icons).
Until it reclaims the channel, we cannot consider the trend bullish.
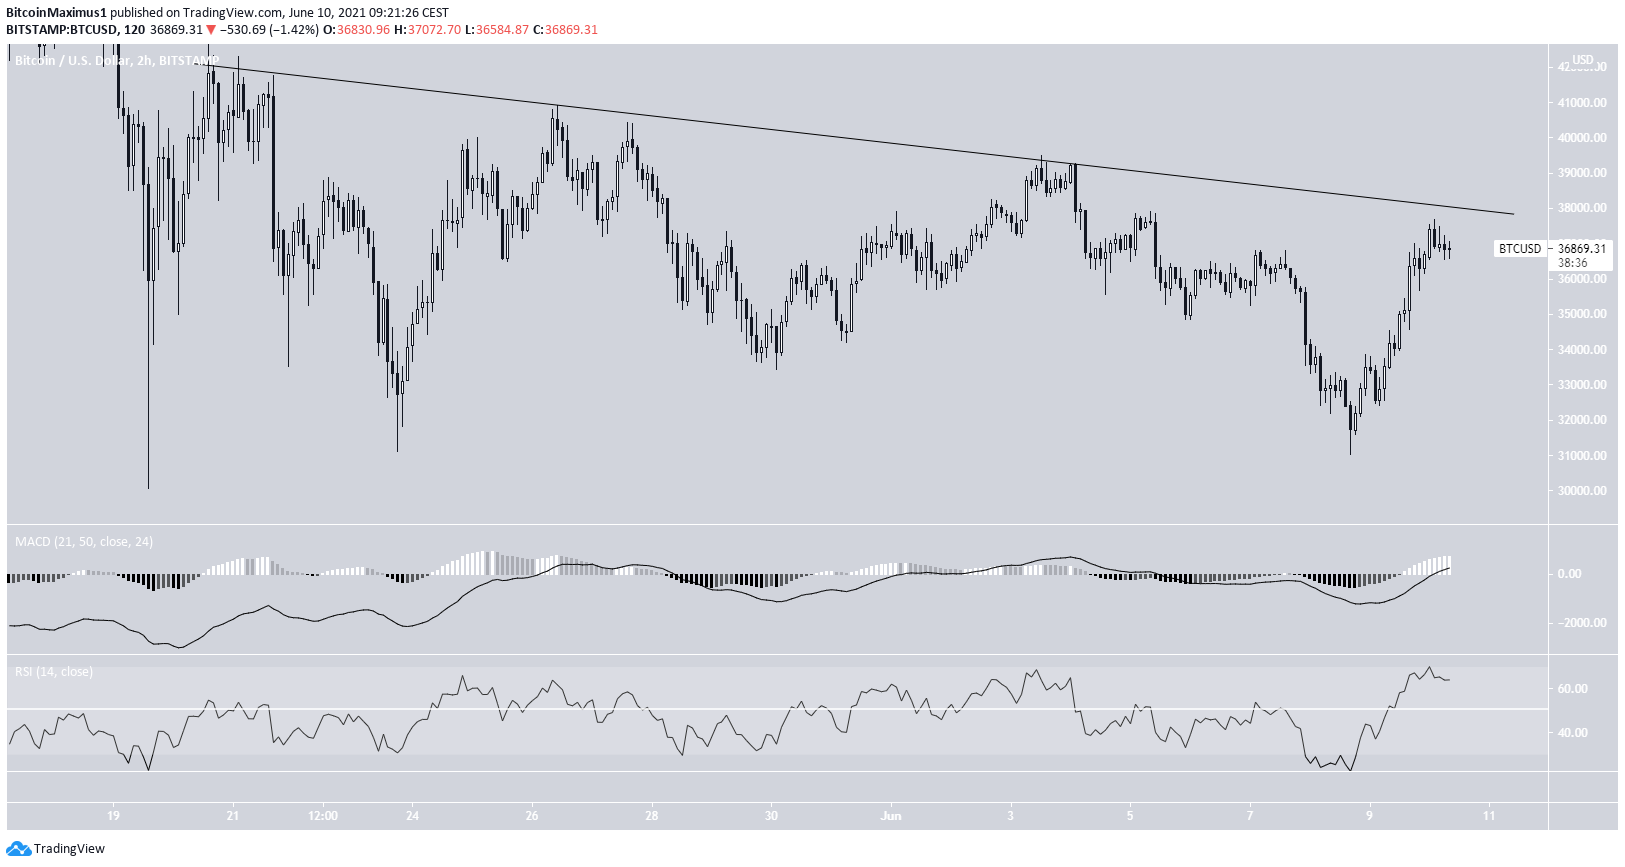
Similarly, the two-hour chart shows a descending resistance line in place since May 20.
Despite technical indicators being bullish, a breakout is required for the short-term trend to be considered bullish.
For BeInCrypto’s previous bitcoin (BTC) analysis, click here.
