


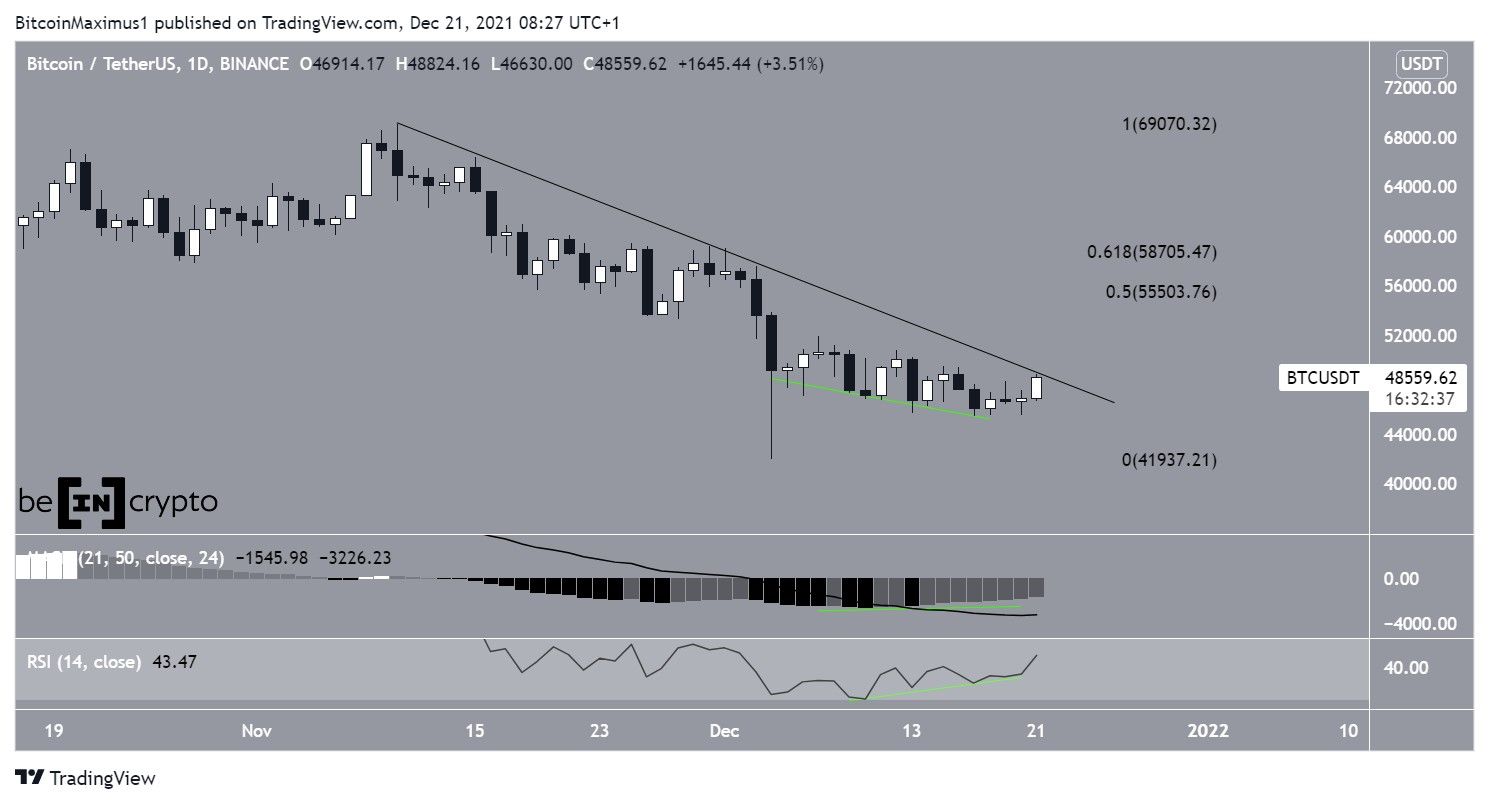
Bitcoin (BTC) is very close to breaking out from its short-term bearish pattern, potentially indicating that the corrective phase is complete.
The daily chart shows that BTC has rebounded and has nearly broken out from a descending resistance line that has been in place since Nov 10.
The bounce was preceded by a very significant bullish divergence in both the RSI and MACD. The bullish divergence is an occurrence that often precedes bullish trend reversals and indicates that the drop in price was not accompanied by a decrease in buying momentum.
In addition to this, the RSI is in the process of moving above 50 while the MACD has created seven successive higher momentum bars. These are both normally considered signs of bullish trends.
If a breakout transpires, the next resistance area would likely be found between $55,500-$58,750, a range created by the 0.5-0.618 Fib retracement resistance levels.
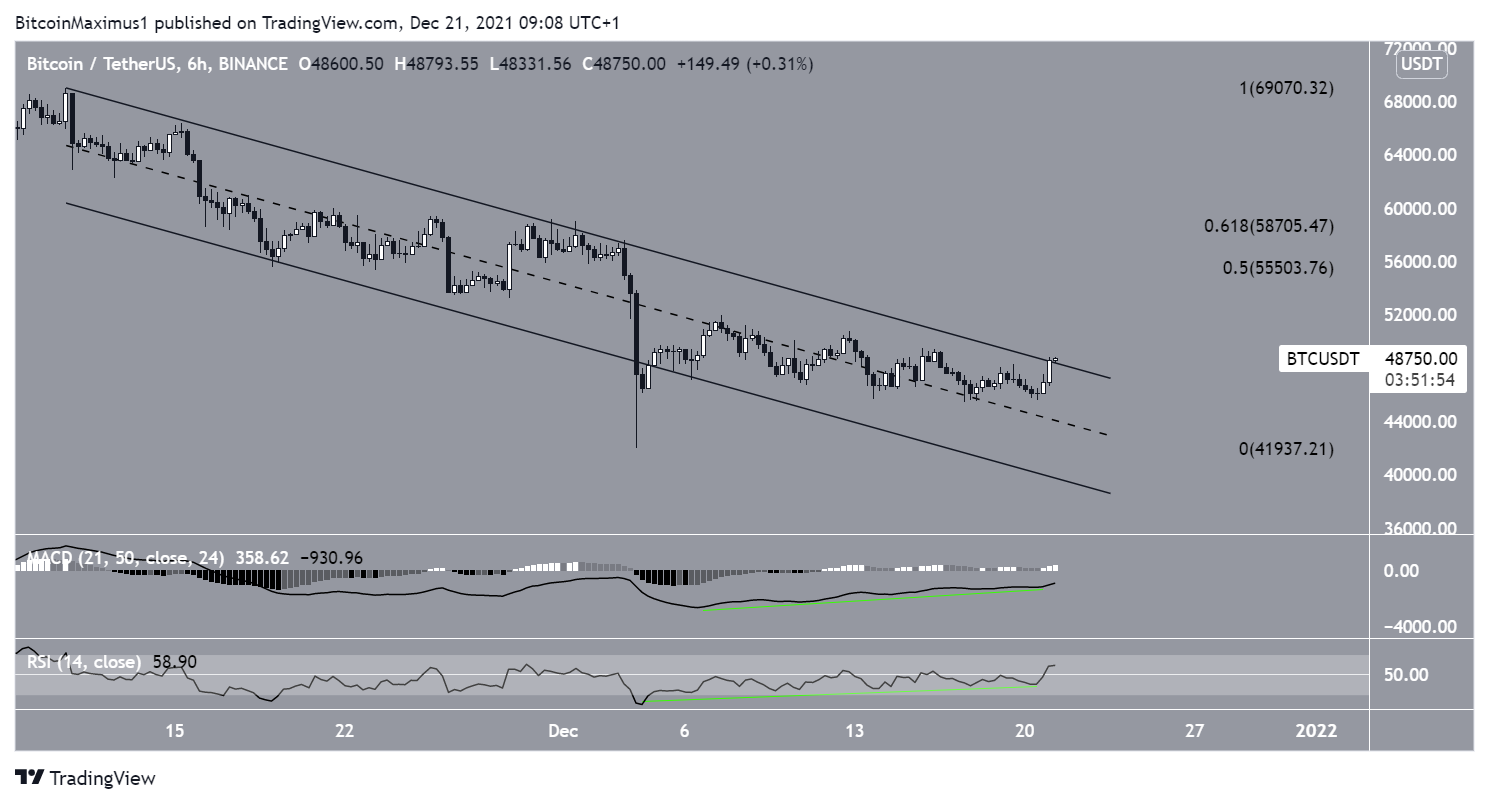
Ongoing breakout
The six-hour chart supports the ongoing upward move.
BTC has nearly broken out from a descending parallel channel that’s been in place since Nov 10.
Such channels usually contain corrective movements, meaning that a breakout from it would be expected.
The upward move was preceded by significant bullish divergence in both the RSI and MACD. The divergence was even more pronounced than in the daily time frame.
Therefore, it’s likely that BTC continues to increase towards the $55,000-$58,700 resistance area.
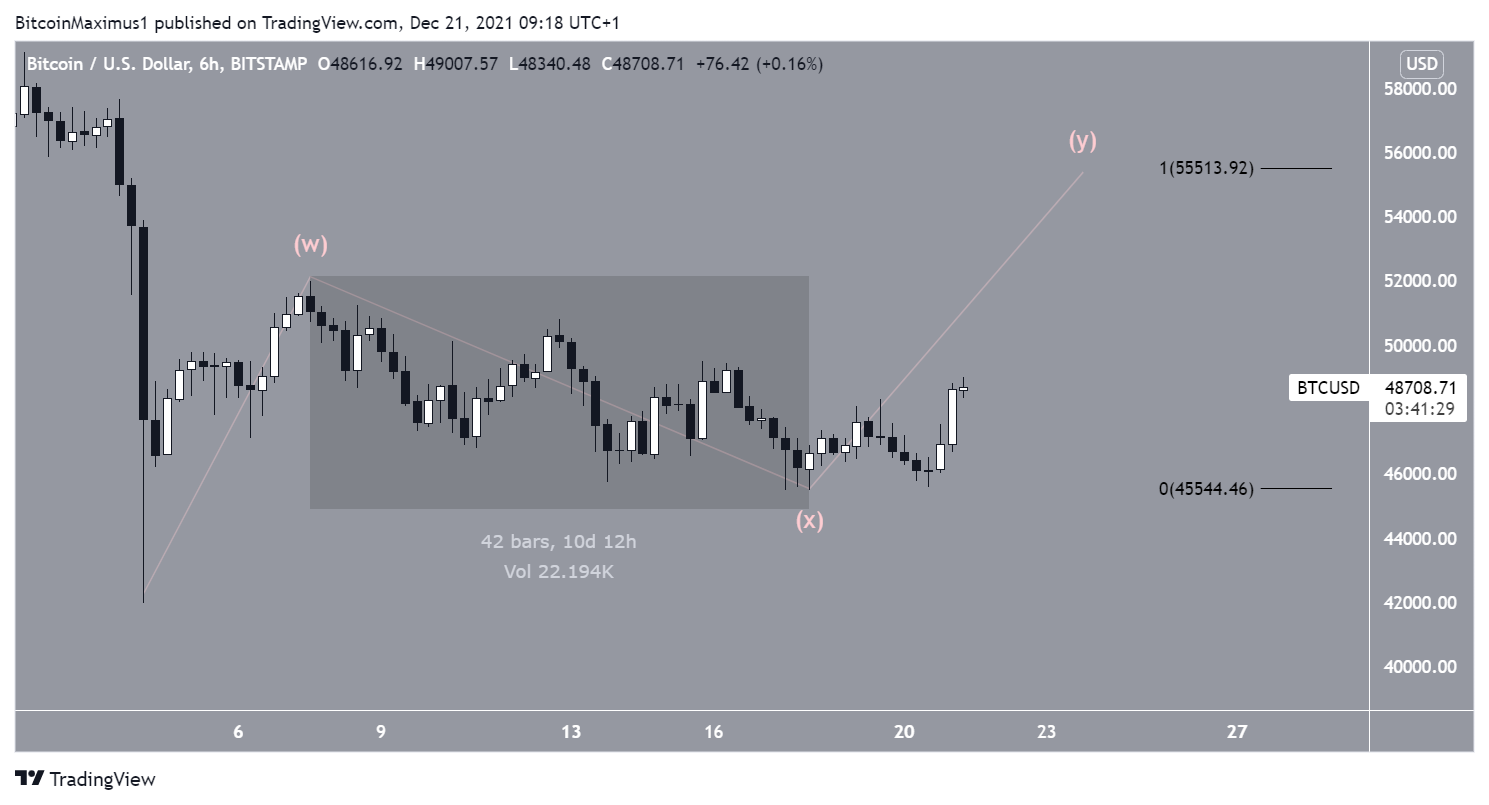
BTC wave count
The wave count suggests that BTC has completed a complex corrective structure (highlighted in the chart below) in a period of 10 days.
If correct, it’s now in the Y wave, which is expected to take it towards the previously outlined resistance area.
If waves W:Y have a 1:1 ratio, which is common in such structures, BTC could reach a high of $55,513.
For BeInCrypto’s previous Bitcoin (BTC) analysis, click here


