

Bitcoin (BTC) has been increasing since April 1, when it bounced at the $44,800 support area. This zone had previously acted as resistance and has now turned to support.
After increasing considerably during the previous week, Bitcoin barely moved in either direction during the week of March 28-April 4. The movement throughout the week had a high of $48,189 and a low of $44,200. The difference between low and high was only 9%.
Despite the absence of bullish price action, technical indicators in the weekly time frame are bullish.
First, the MACD is moving upwards, is positive, and has created three successive higher momentum bars (green icon). All these are considered signs of bullish trends.
The RSI is also increasing and is currently above 50.
Therefore, indicator readings from the weekly time frame suggest that the long-term trend is bullish.

BTC breakout and bounce
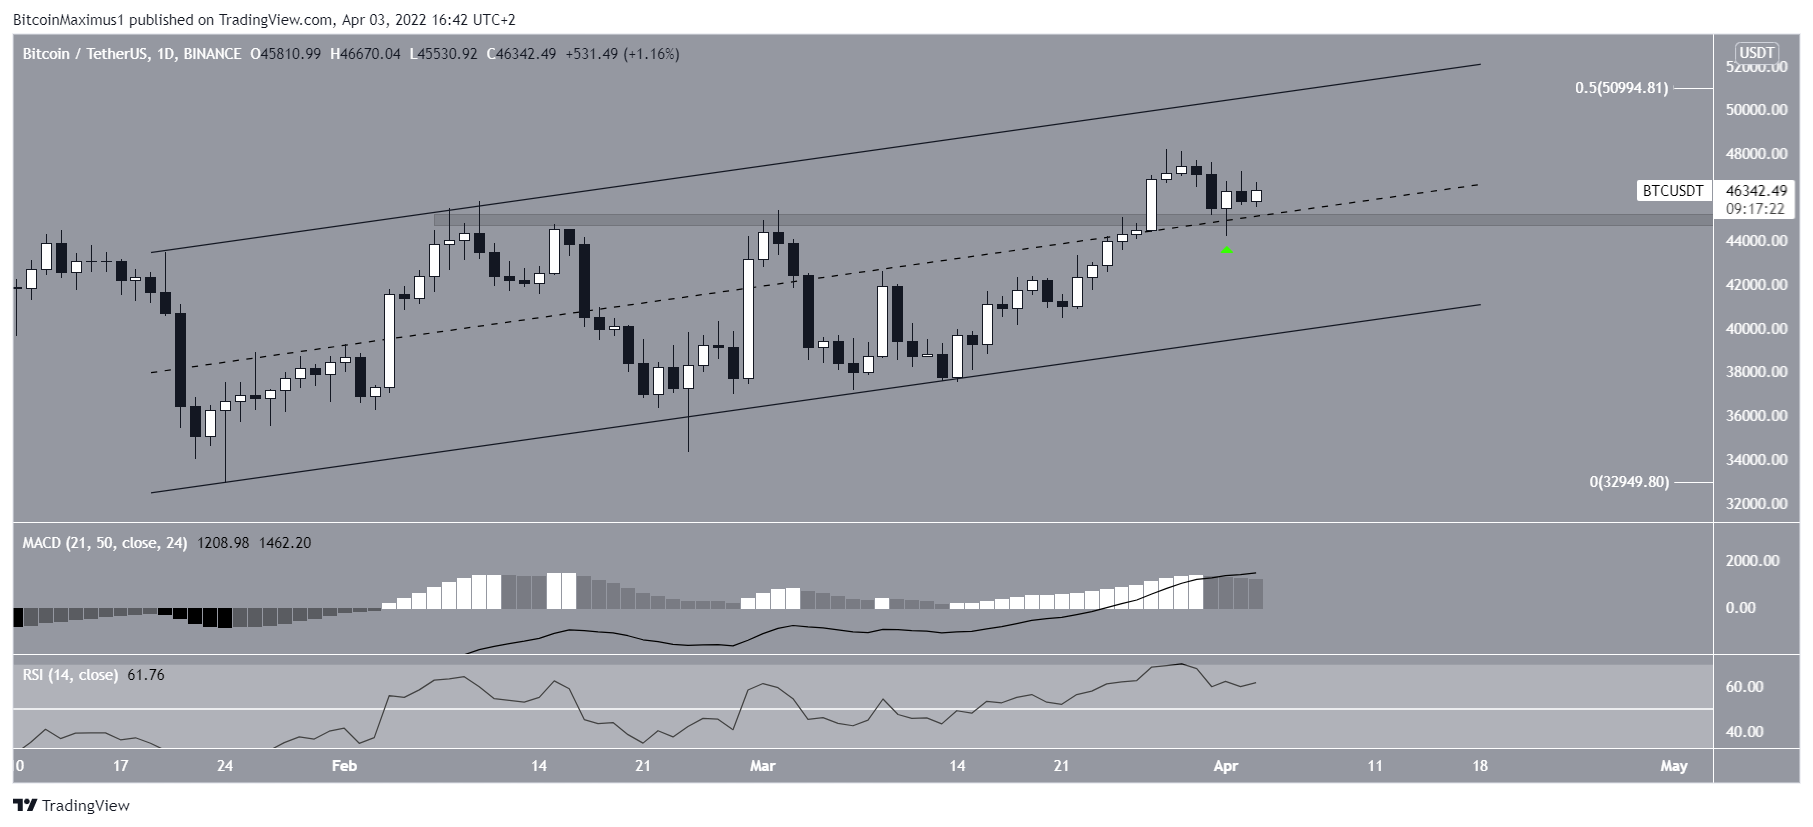
The daily chart shows that BTC bounced considerably on April 1 (green icon), creating a bullish candlestick in the process.
This occurred after the price retested the previous breakout level at $44,800. Therefore, the level is now expected to provide support.
Similar to the weekly time frame, the daily MACD and RSI are increasing. The former is positive while the latter is trending above 50.
The next closest resistance is found at $51,000, which is the 0.5 Fib retracement resistance level. In addition to this, it coincides with the resistance line of an ascending parallel channel that has been in place since Jan. 22.
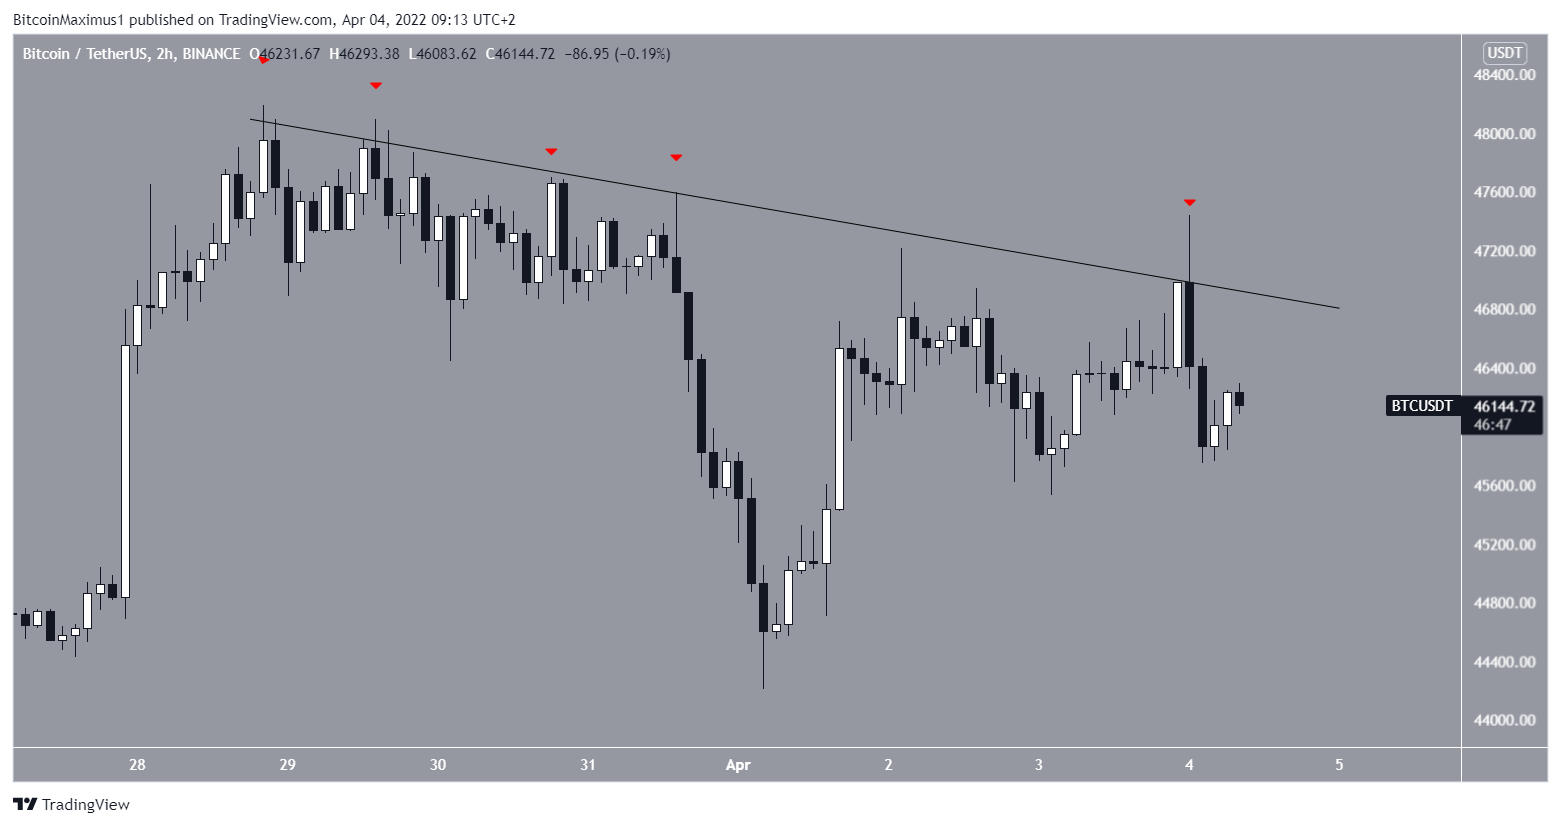
The two-hour chart shows that BTC has been stuck under a descending resistance line since March 28. So far, the line has rejected the price several times (red icons). A breakout above this resistance would be expected to cause the price to accelerate quickly.
Wave count analysis
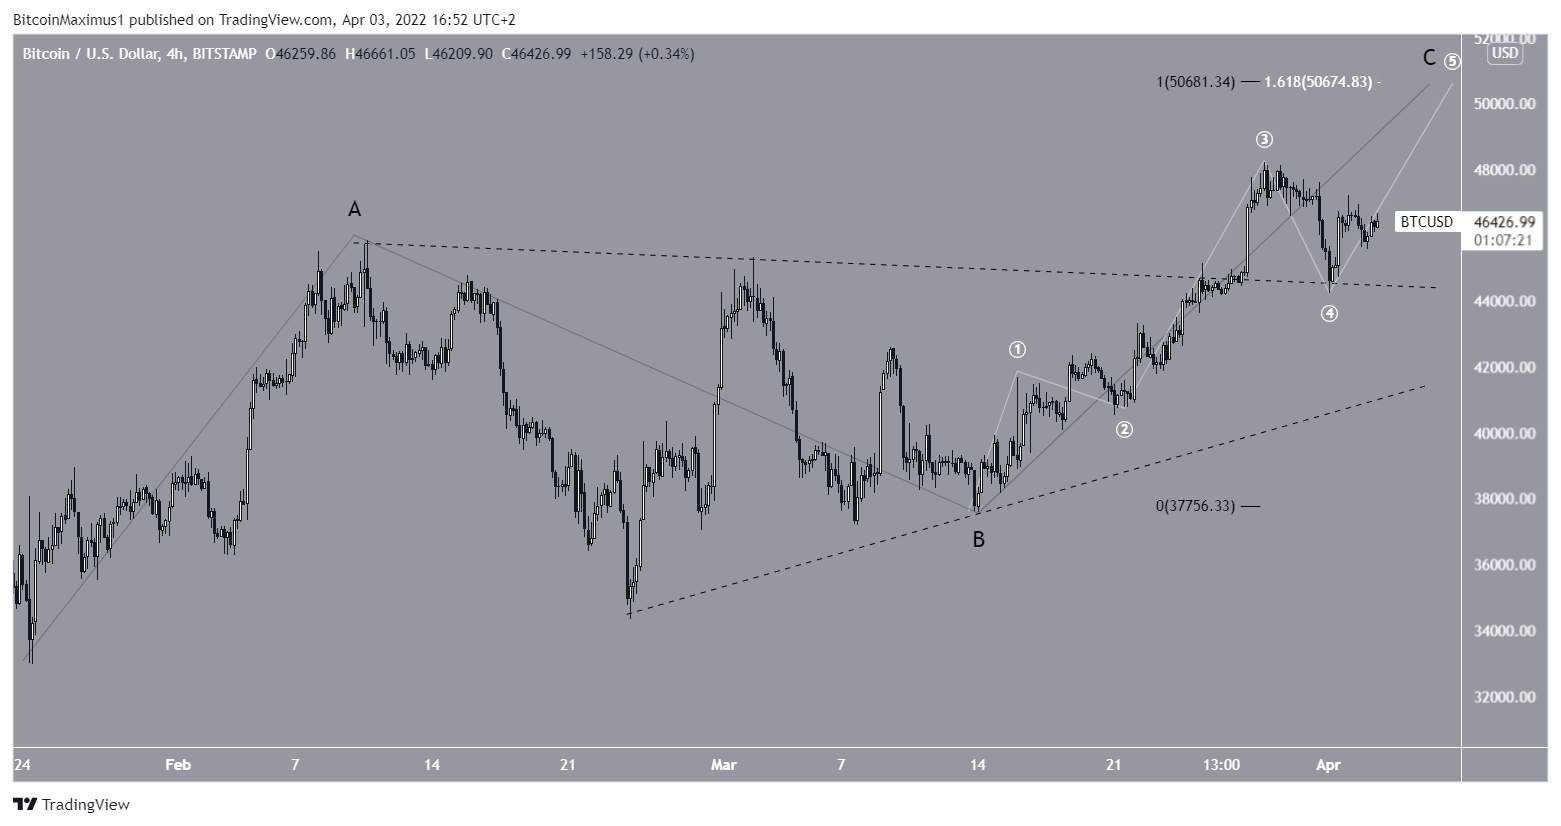
The wave count indicates that BTC is approaching the top of wave C in an A-B-C structure (black). The sub-wave count is shown in white, suggesting that BTC has begun the fifth and final sub-wave.
A target of $50,700 is provided by giving waves A and C a 1:1 ratio, which is common in such structures. Furthermore, a similar target is given by the 1.61 external retracement of sub-wave four (white). Finally, a high near $50,700 would also coincide with the resistance area outlined in the daily chart.
Due to the confluence of these factors, it would make sense for BTC to reach a high near these levels.
For BeInCrypto’s previous Bitcoin (BTC) analysis, click here
Disclaimer
In line with the Trust Project guidelines, this price analysis article is for informational purposes only and should not be considered financial or investment advice. BeInCrypto is committed to accurate, unbiased reporting, but market conditions are subject to change without notice. Always conduct your own research and consult with a professional before making any financial decisions. Please note that our Terms and Conditions, Privacy Policy, and Disclaimers have been updated.
