


Bitcoin (BTC) is in the process of breaking out from a descending wedge pattern, which has been in place since April 18. This could be the catalyst for a significant upward movement.
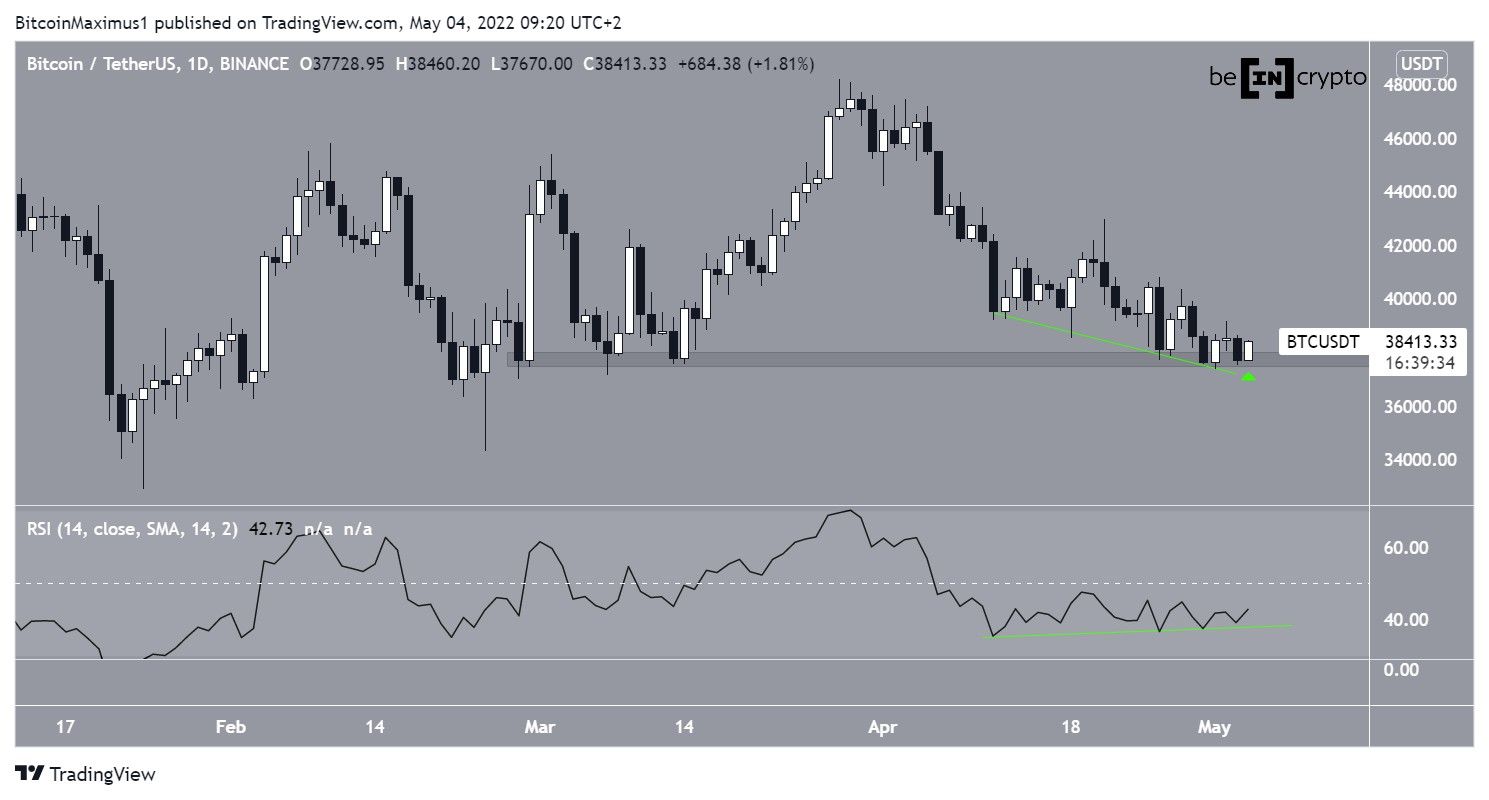
Bitcoin has been decreasing since reaching a local high of $48,189 on March 28. In the period since March 11, the downward movement became very gradual and choppy. Since then, BTC has fallen by less than 3%.
During this time, the RSI generated a considerable bullish divergence (green line). Such divergences often precede upward movements.
Additionally, BTC has bounced at the $38,000 horizontal support area. The area has been acting as a strong horizontal support level since the beginning of March.
Today, BTC is in the process of creating a bullish engulfing candlestick. This bullish candlestick pattern would be confirmed with a close above $38,525. The creation of this bullish pattern would align with the bullish divergence that has been developing in the RSI.
BTC attempts breakout
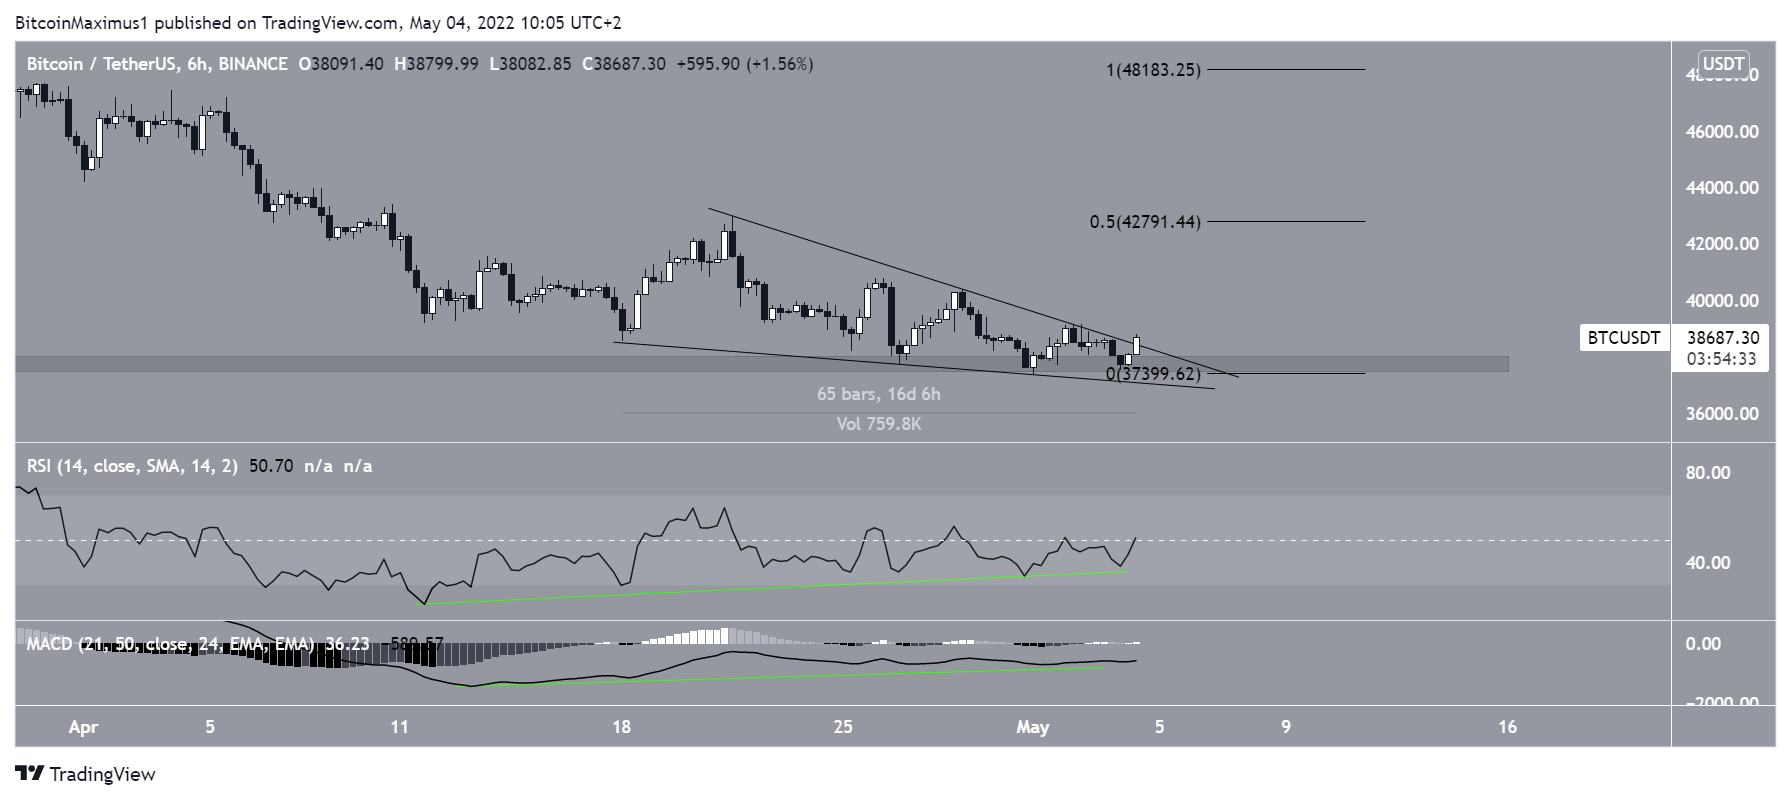
The six-hour time frame shows that BTC has been trading inside a descending wedge since April 18. The wedge is often considered to be a bullish pattern that leads to breakouts the majority of the time.
Furthermore, the pattern has been combined with a bullish divergence in the RSI and MACD, both of which support the possibility of a breakout.
If a breakout occurs, the closest resistance area would be found at $42,800. This target is the 0.5 Fib retracement resistance level and the top of the wedge.
Wave count analysis
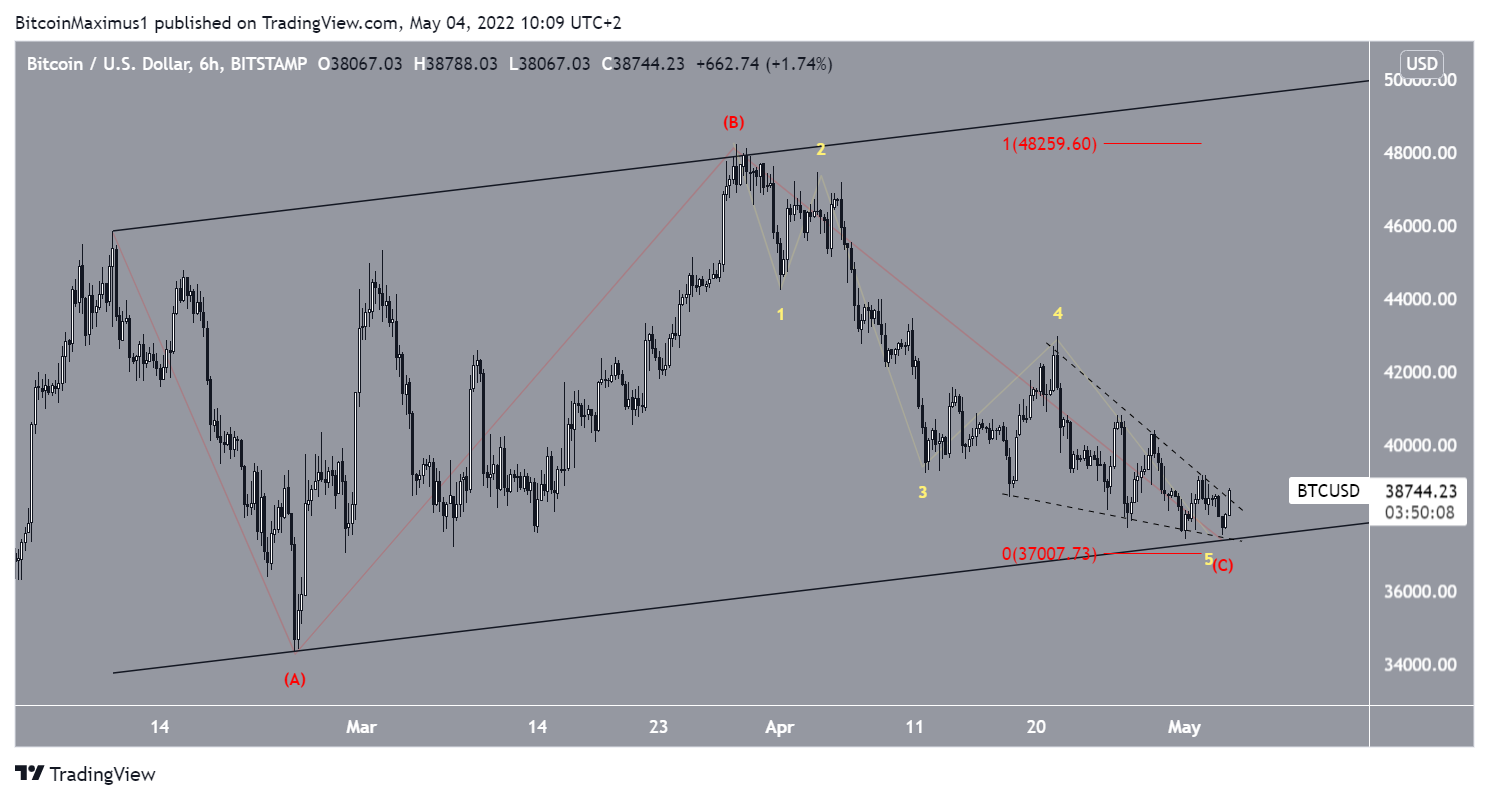
The most likely wave count indicates that BTC has been completing an A-B-C correction (red) since Feb. 10. The entire movement has been contained inside an ascending parallel channel. Since the bottom of wave C is higher than that of wave A, it is a running correction.
If BTC has reached a bottom, waves A and C would have an exact 1:1 ratio, which is common in such corrections.
The sub-wave count is shown in yellow in the chart below and suggests that BTC is in the fifth and final sub-wave, which has taken the shape of an ending diagonal, hence the shape of the wedge. A breakout from the wedge would confirm that the correction is complete.
If so, the long-term wave count suggests that a significant upward move would be likely to follow.
For BeInCrypto’s previous Bitcoin (BTC) analysis, click here


