


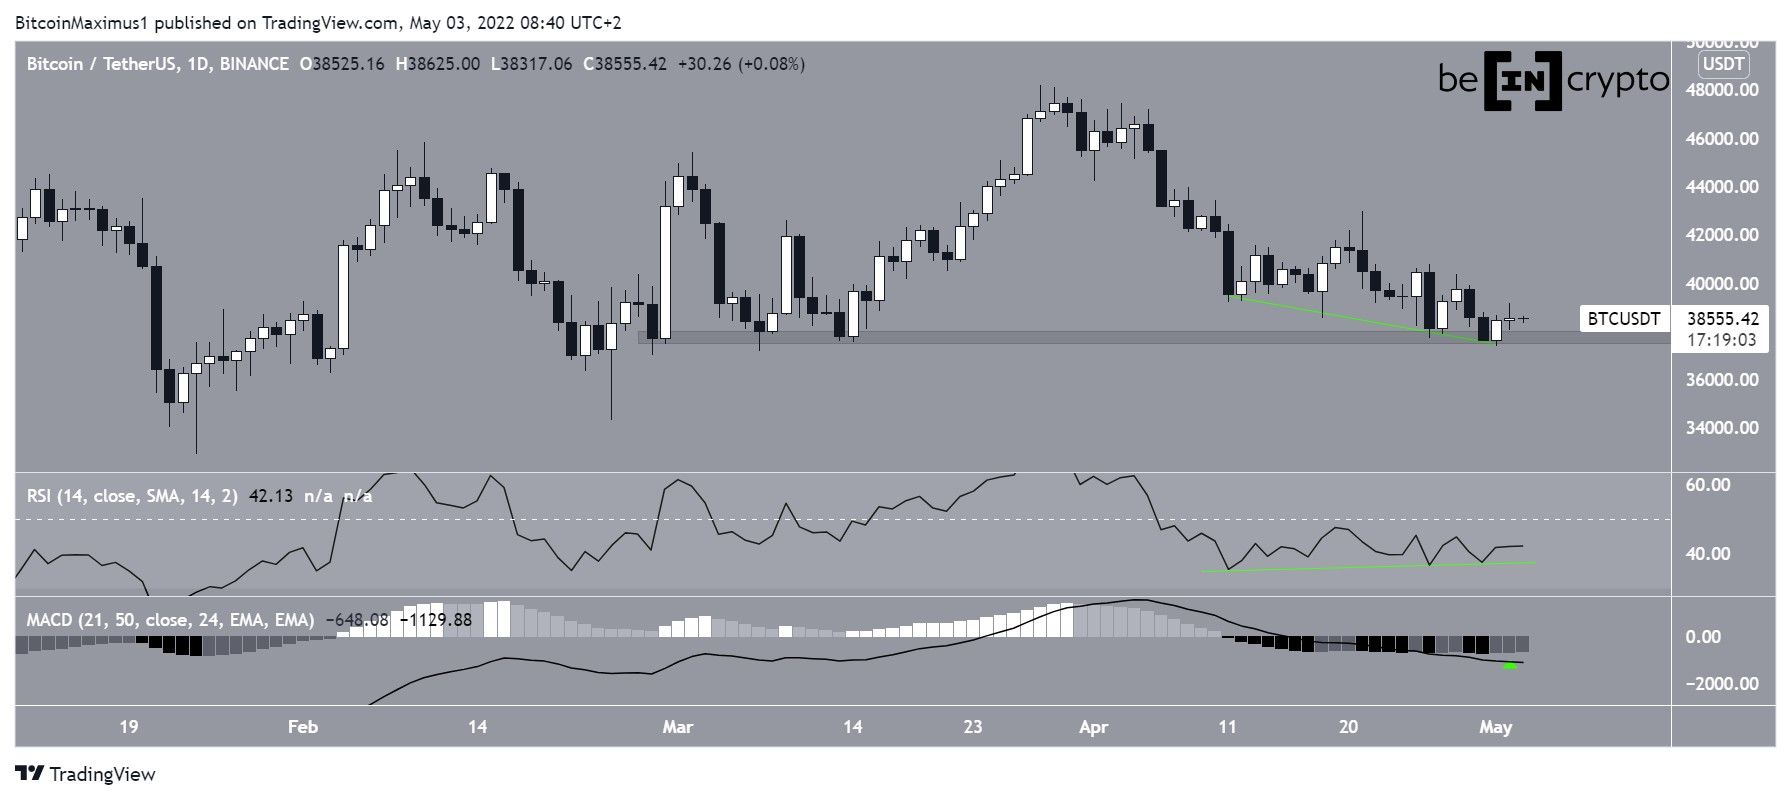
Bitcoin (BTC) has been showing bullish signs since March 11. It’s currently nearing the end of a descending wedge pattern that’s been in place since March 18.
Bitcoin has been falling since reaching a local high of $48,189 on March 28. The downward move was initially swift, but has slowed down a bit since March 11. During this time, the RSI generated a considerable bullish divergence (green line). Such divergences often precede upward movements.
Furthermore, despite not generating any bullish divergence, the MACD has generated successive higher bars.
As for the price action, BTC is trading just above the $38,000 horizontal support area, which has been in place since the beginning of March. A breakdown below this level would be an extremely bearish development that could lead to lower prices.
Short-term BTC movement
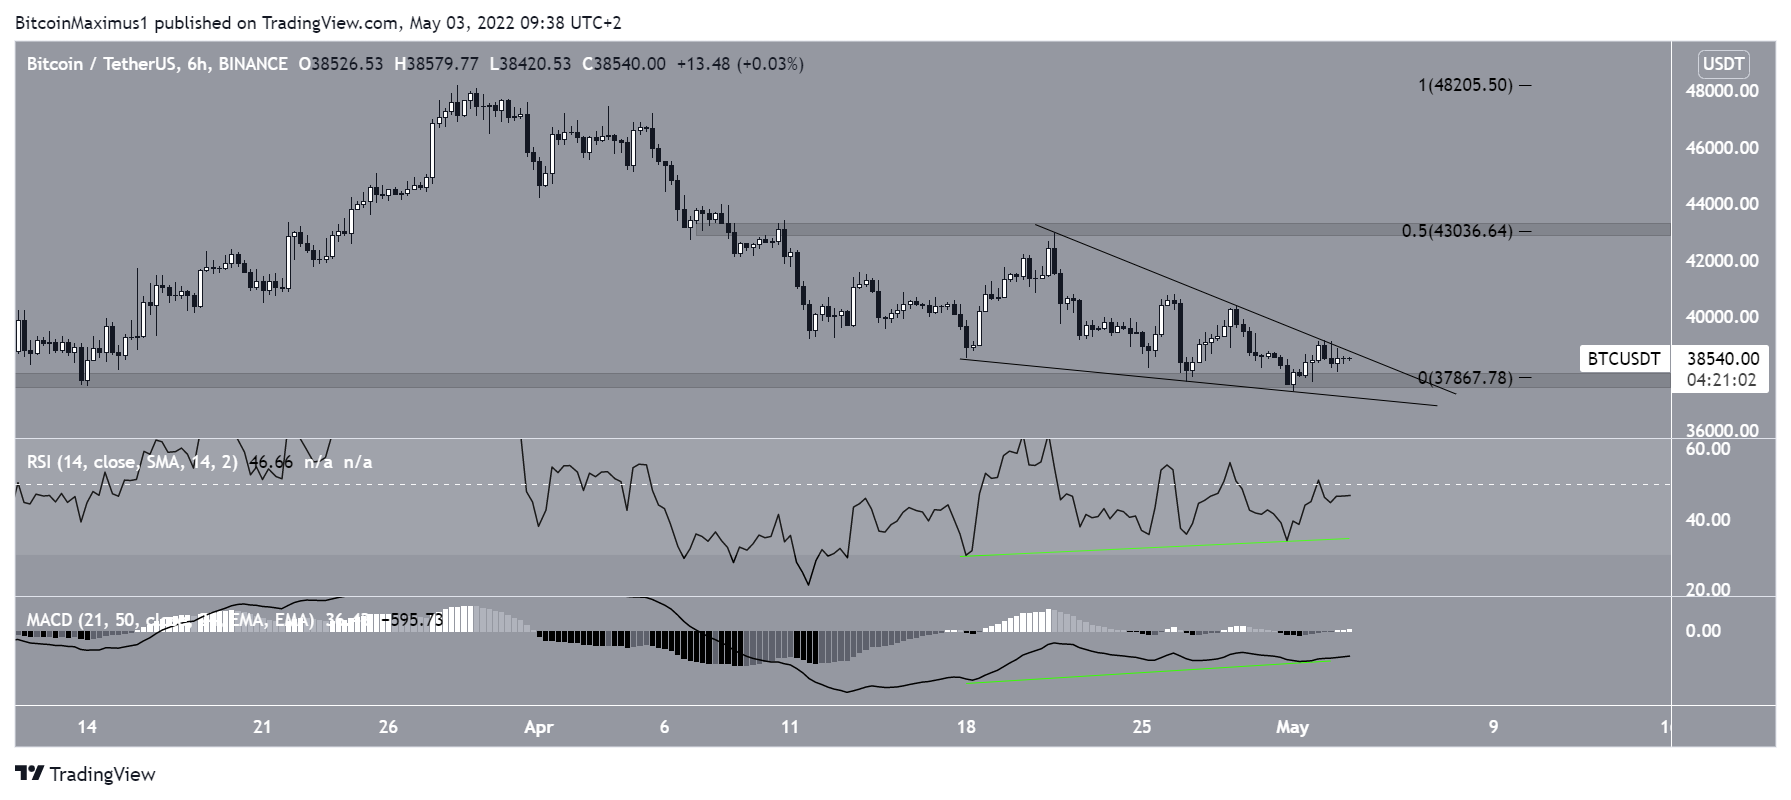
A look at the six-hour chart supports the possibility of a breakout for two main reasons.
BTC has been trading inside a descending wedge since April 18. The wedge is often considered to be a bullish pattern, meaning that it leads to breakouts the majority of the time.
Secondly, similar to the daily time frame, the RSI and MACD have both generated bullish divergences.
If a breakout occurs, the main resistance area would be found at $43,000. This target is the 0.5 Fib retracement resistance level and a horizontal resistance area.
Wave count analysis
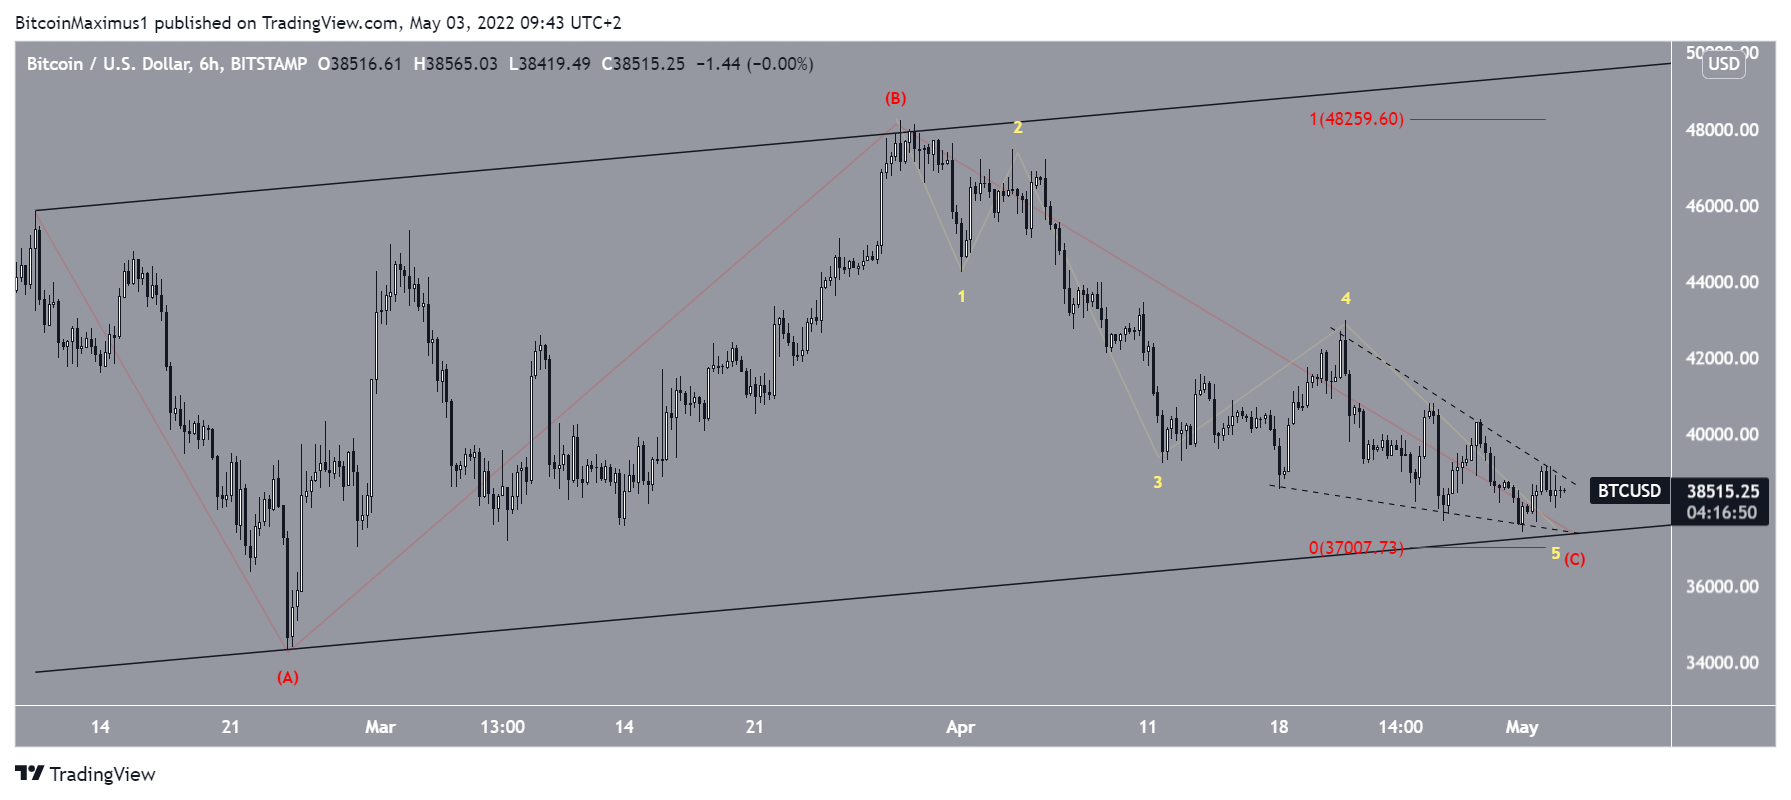
The most likely wave count indicates that BTC is nearing the end of an A-B-C corrective structure (red), which has been in place since Feb. 10.
If a bottom is reached near the current level, it would give waves A and C an exact 1:1 ratio, which is common in such structures.
The sub-wave count is shown in yellow in the chart below and suggests that BTC is in the fifth and final sub-wave, which has taken the shape of an ending diagonal.
Therefore, the wave count is in alignment with the daily and six hour time frame readings, and suggests that a breakout is likely.
For BeInCrypto’s previous Bitcoin (BTC) analysis, click here


