

After breaking out above a short-term descending resistance line, Bitcoin (BTC) is attempting to move above the $44,100 horizontal resistance area.
Bitcoin has been increasing above an ascending support line since Jan. 24 and has created two long lower wicks after rebounding from the line.
On Feb 28, BTC created a large bullish candlestick and followed it with a smaller bullish candlestick the next day.
Currently, it’s trading just under the $44,400 resistance area. If it manages to break out, the next closest resistance would be found near $51,100.
Technical indicators paint a bullish picture, since both the RSI and MACD are increasing, and the former is above 50.
However, the MACD has to also cross into positive territory in order to confirm a bullish trend reversal.

Short-term breakout
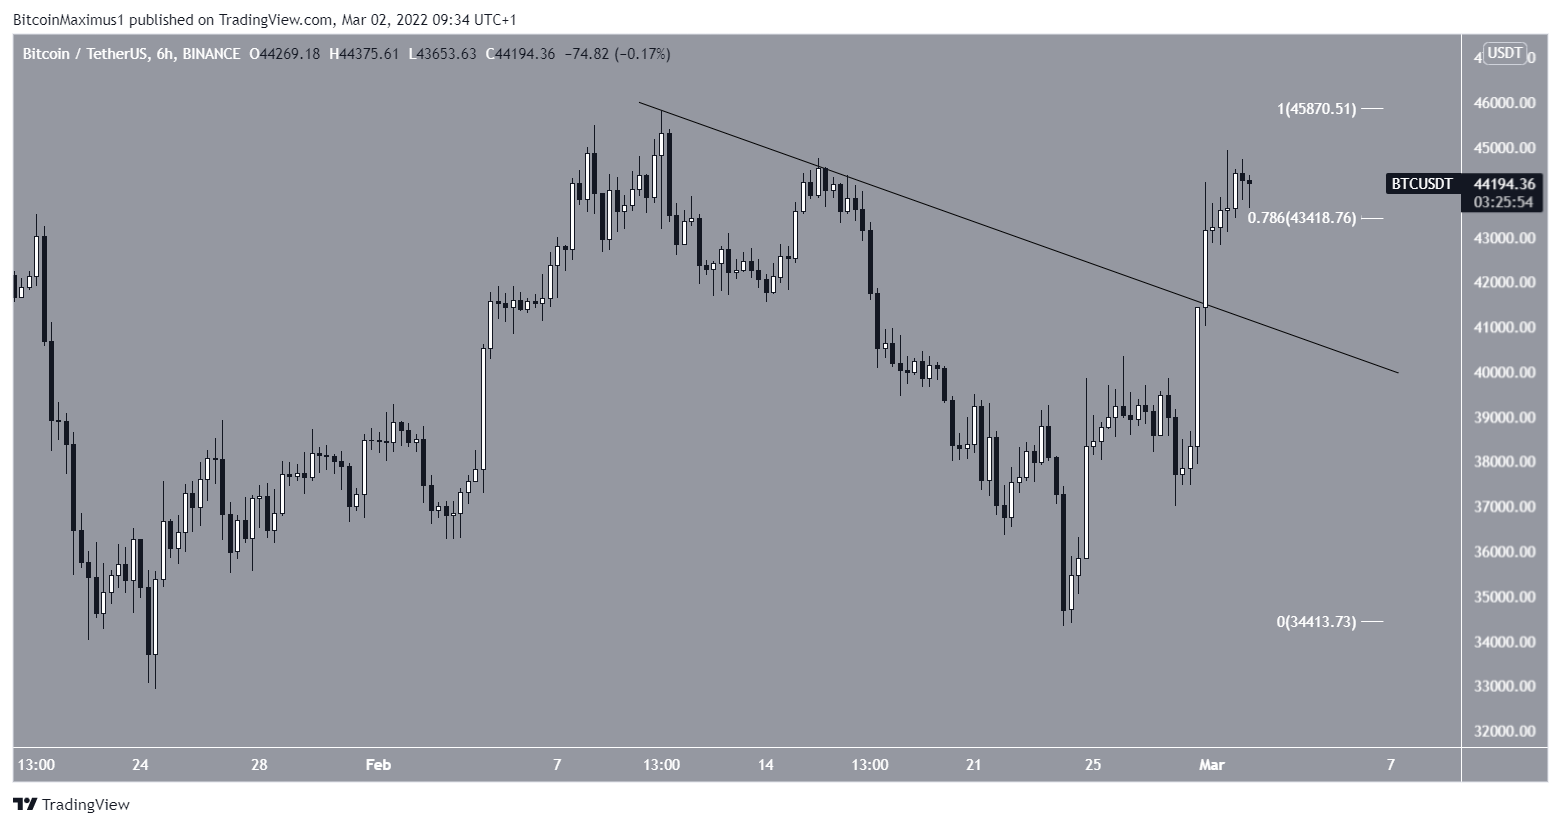
The six-hour chart shows that BTC has broken out from a descending resistance line. This is a strong sign that the short-term correction is over.
In addition to this, BTC has reclaimed the 0.786 Fib retracement resistance level. This is the final significant Fib level prior to making a full retracement.
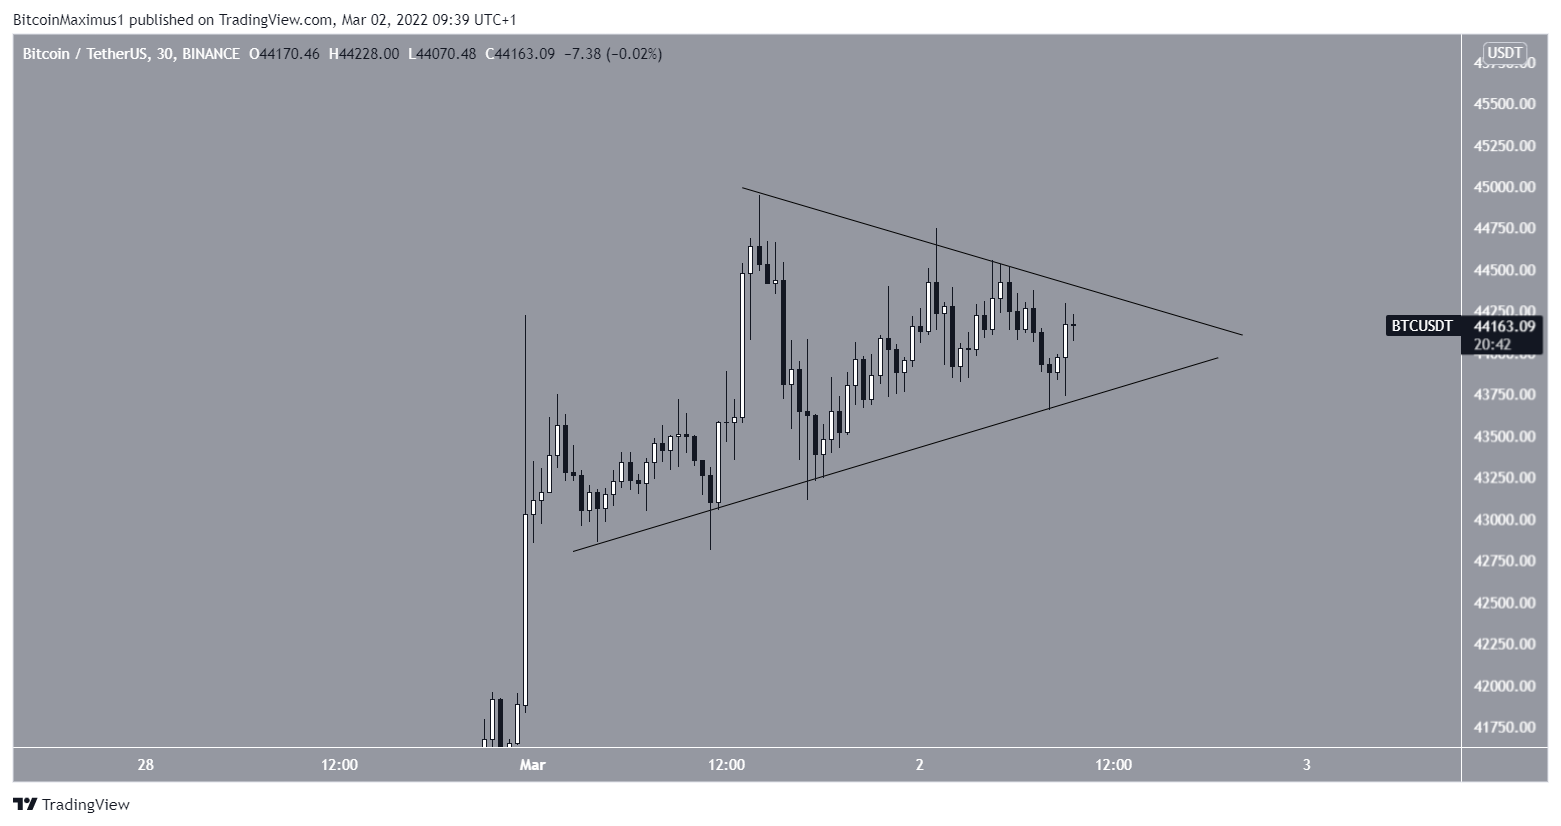
While there is no definitively clear short-term pattern, it’s possible that BTC has been trading inside a symmetrical triangle since March 1. The triangle is often considered a neutral pattern, indicating that both a breakout and a breakdown are equally likely.
BTC wave count analysis
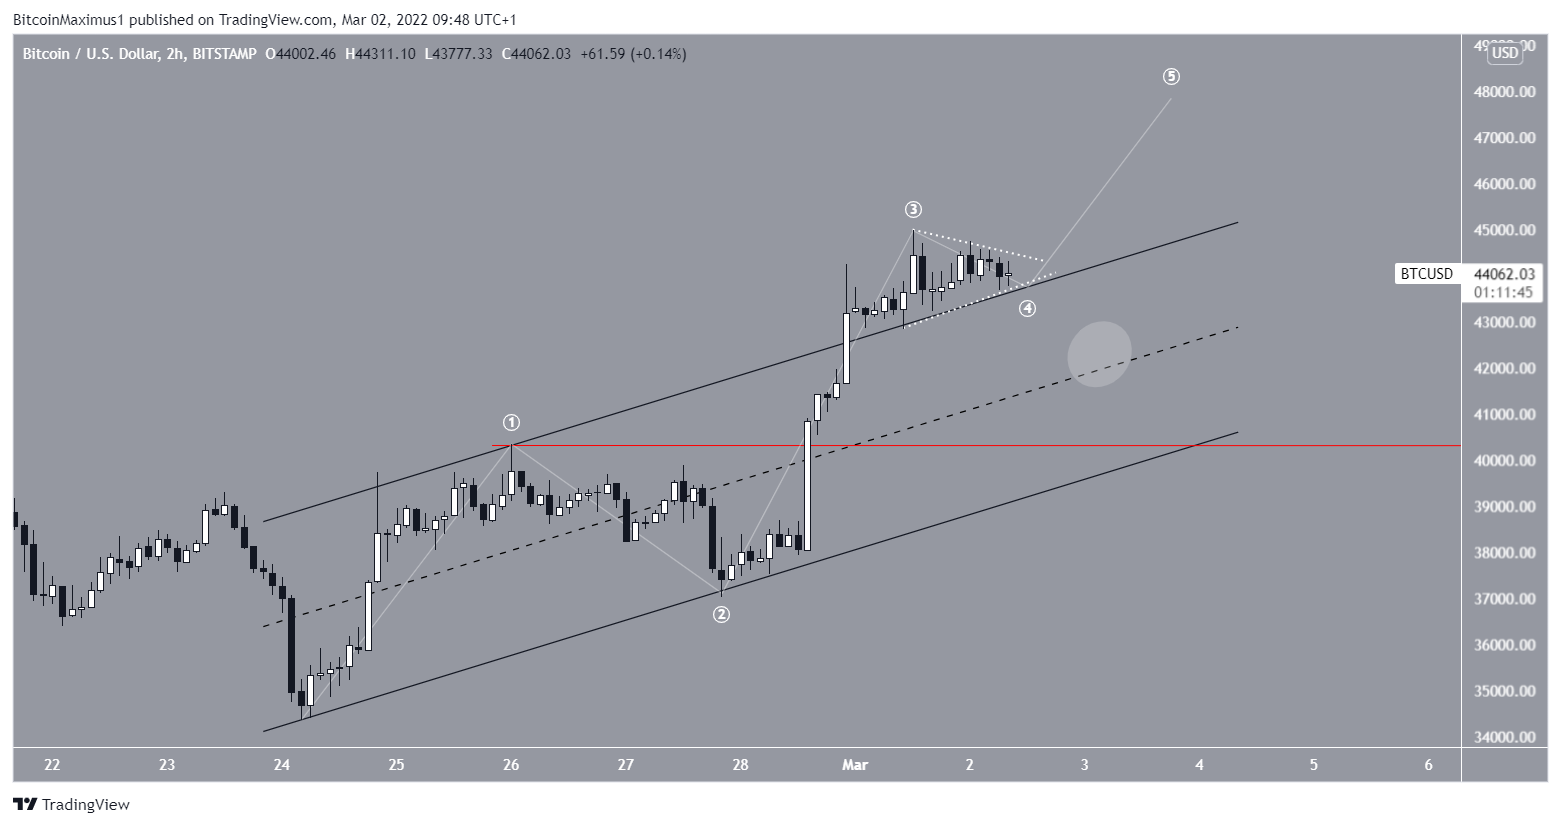
The short-term count suggests that BTC is in wave four of a five-wave upward move.
The main reason for this is the fact that the price is holding on above the previous resistance line of the channel, and is potentially validating it as support.
If BTC creates a symmetrical triangle, it would go a long way in suggesting that this is the correct count.
Alternatively, BTC could fall towards the midline of the channel at $43,000 and still be in a valid fourth wave formation. This would create a fourth wave pullback.
However, a decrease below the wave one high (red line) at $40,330 would invalidate this particular wave count.
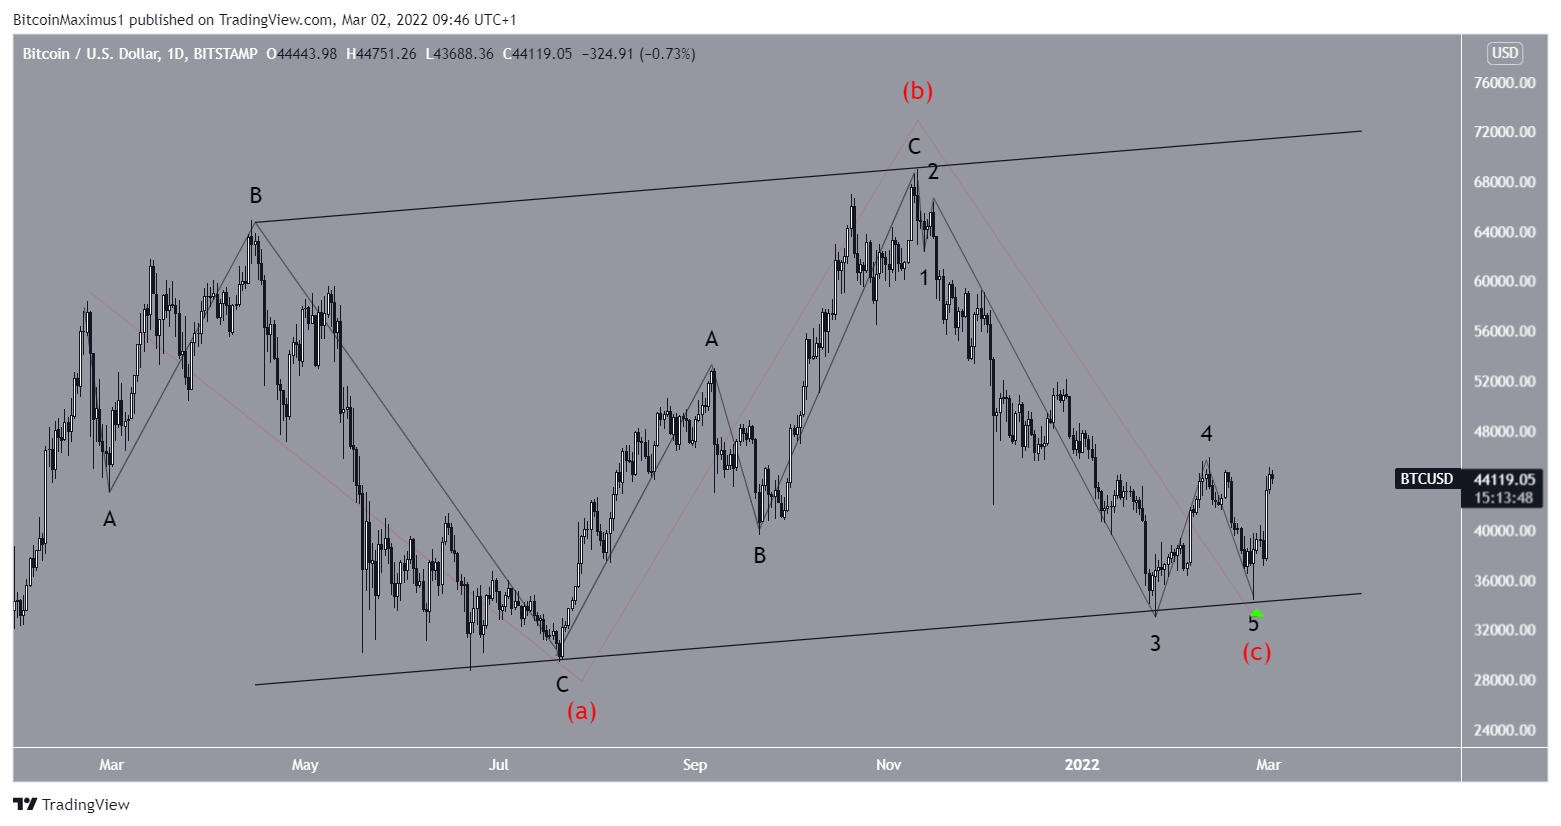
As for the long-term wave count, if the increase is confirmed as a five-wave pattern, the most likely count would indicate that the correction ended on Feb 24, with a truncated sub-wave five (green icon).
This indicates that the entire structure was a running flat correction, which was contained inside a large ascending parallel channel. If correct, it would mean that BTC could gradually increase towards a new all-time high price and the Feb 24 low will not be broken.
For BeInCrypto’s previous Bitcoin (BTC) analysis, click here
Disclaimer
In line with the Trust Project guidelines, this price analysis article is for informational purposes only and should not be considered financial or investment advice. BeInCrypto is committed to accurate, unbiased reporting, but market conditions are subject to change without notice. Always conduct your own research and consult with a professional before making any financial decisions. Please note that our Terms and Conditions, Privacy Policy, and Disclaimers have been updated.
