


Bitcoin (BTC) increased rapidly on March 27, breaking out from several short-term resistance levels in the process and briefly moved above $47,000 the next day.
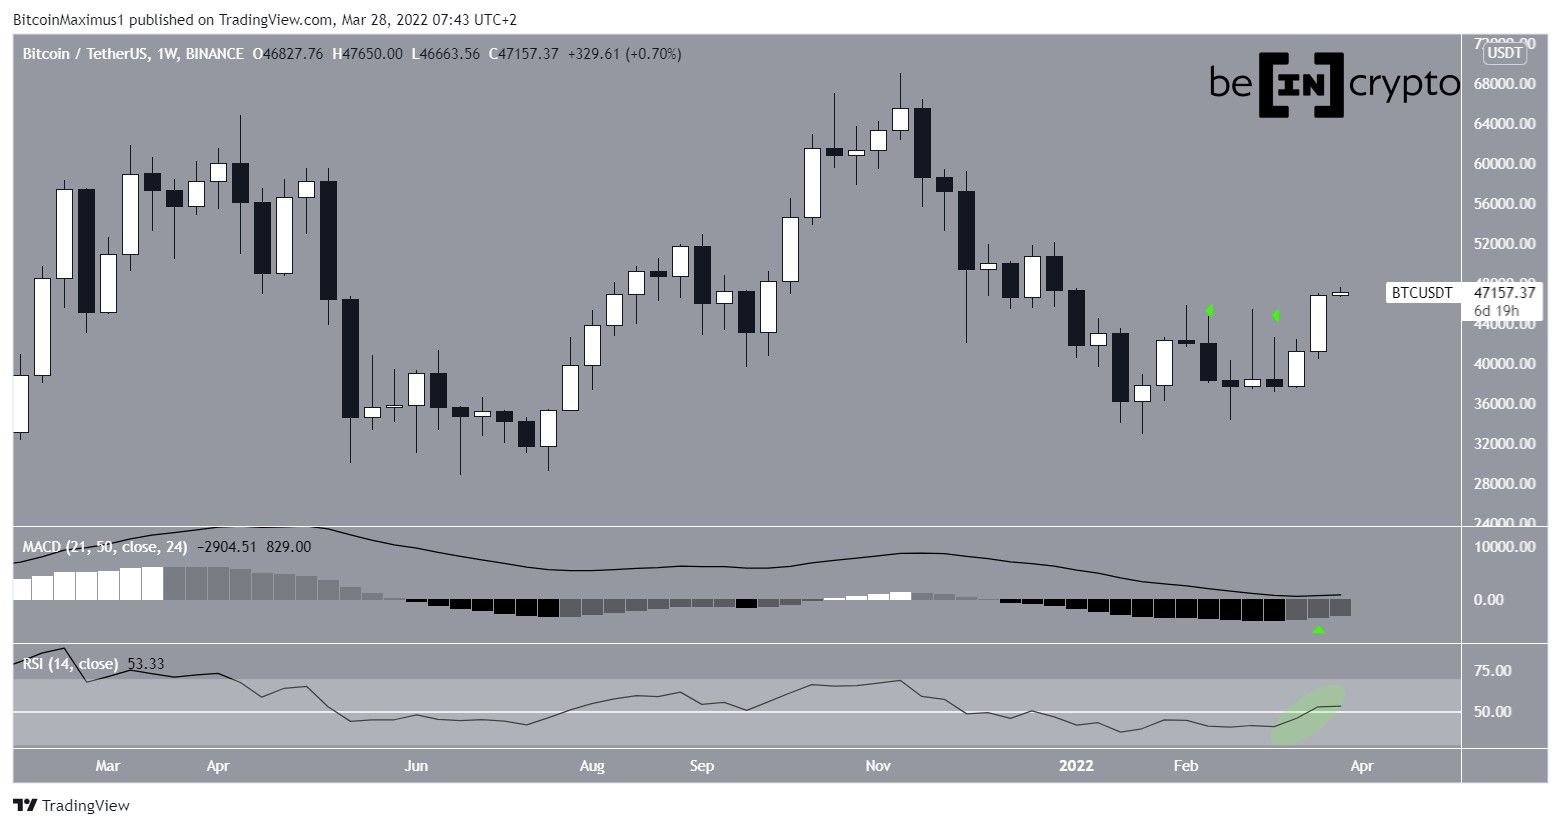
Bitcoin increased significantly during the week of March 21-28, creating a large bullish engulfing candlestick in the process. The weekly close was the highest so far in 2022.
Besides the bullish price action, technical indicators are also bullish.
The MACD, which is created by short and long-term moving averages (MA), is moving upwards and has generated successive higher momentum bars (green icon). This means that the short-term MA is accelerating quicker than the long-term average.
The RSI, which is a momentum indicator, is increasing and has moved above 50 (green circle). This is also a sign of a bullish trend.
Therefore, the weekly chart shows an overall bullish outlook.
Ongoing BTC breakout
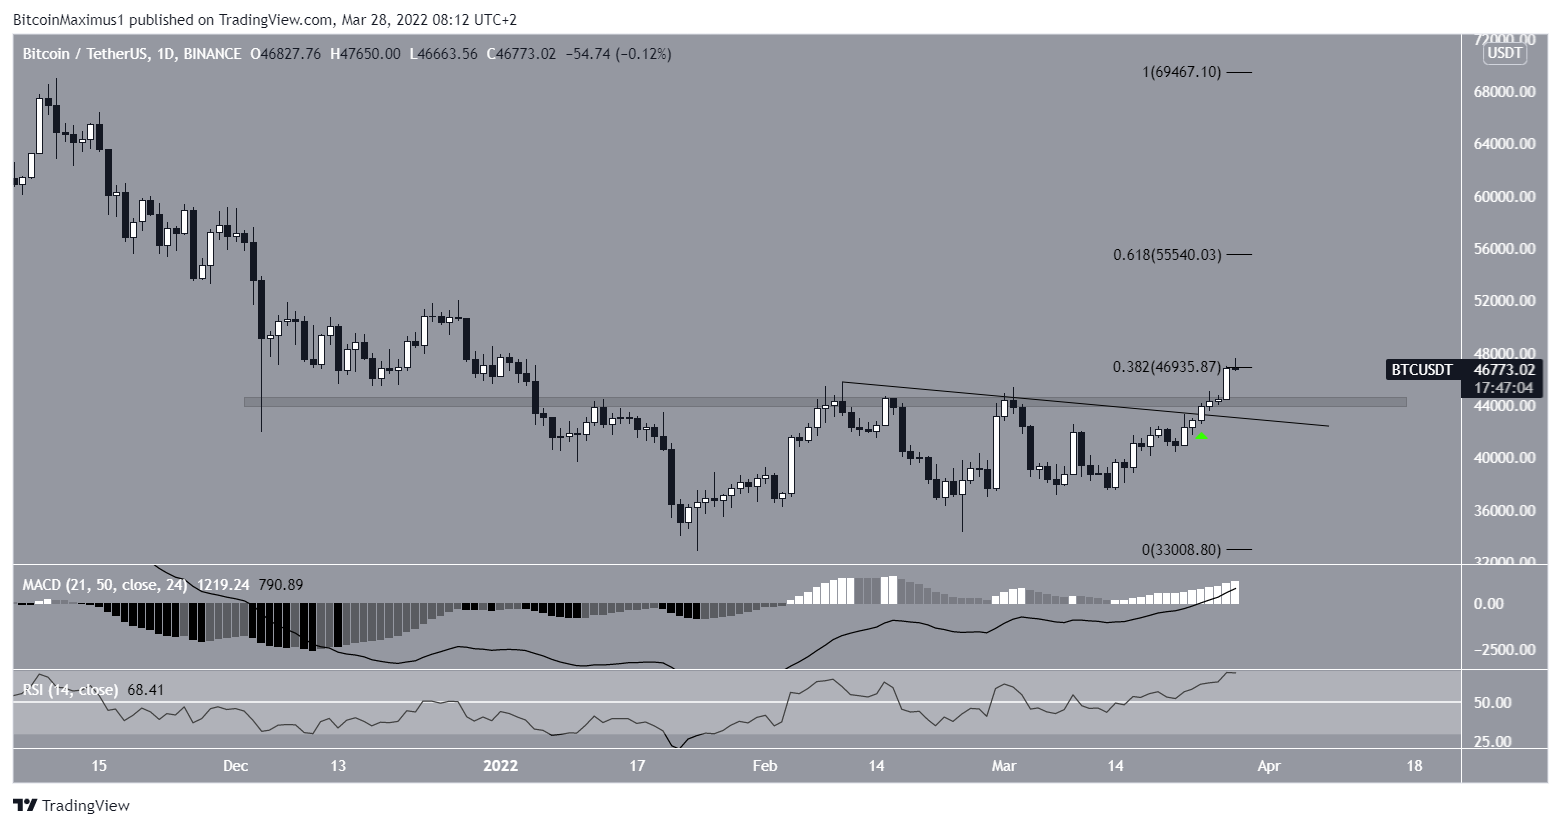
The daily chart also shows several bullish characteristics.
Firstly, there was a breakout (green icon) from a descending resistance line that had been in place since Feb. 10.
Secondly, BTC has reclaimed the $44,400 resistance area, which had been in place since Jan. 11.
Bitcoin is now attempting to move above the 0.382 Fib retracement resistance level at $46,950. If it’s successful in doing so, the next resistance would be found near $55,540. This is the 0.618 Fib retracement resistance level.
Similar to the weekly time frame, the MACD and RSI on the daily chart are bullish. The MACD is positive, the RSI is above 50, and both are still increasing.
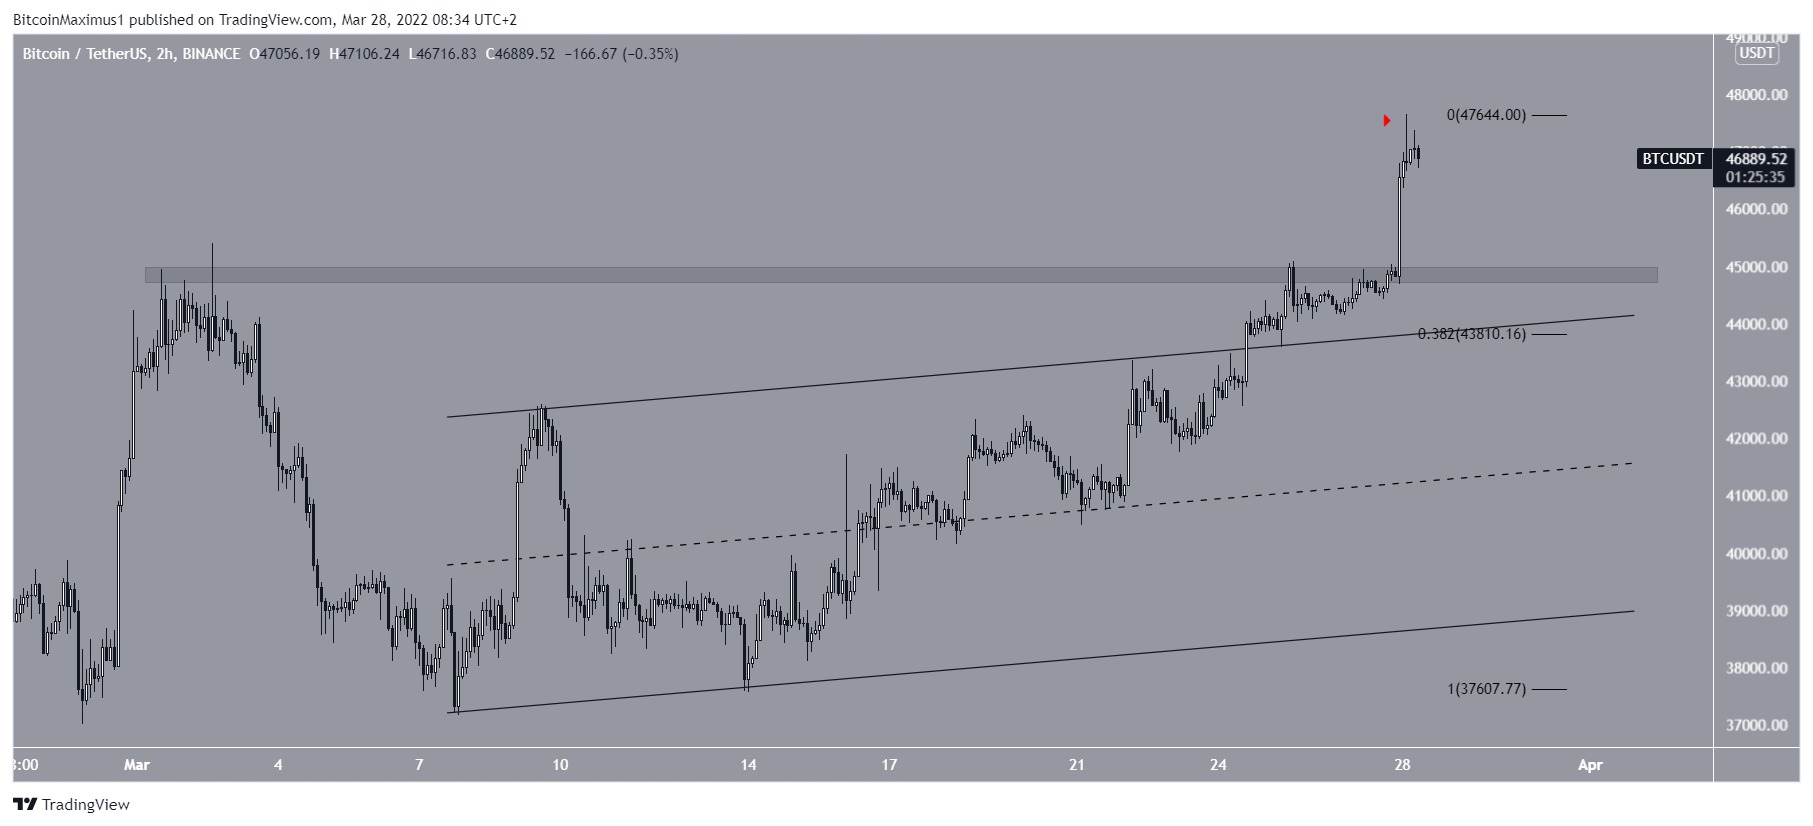
The two-hour chart also shows that BTC has broken out from an ascending parallel channel prior to accelerating.
The current high, however, was combined with a long upper wick (red icon).
If a short-term retracement occurs, the $45,000 and $43,800 levels would be expected to provide support.
There are currently no weaknesses present in short-term charts.
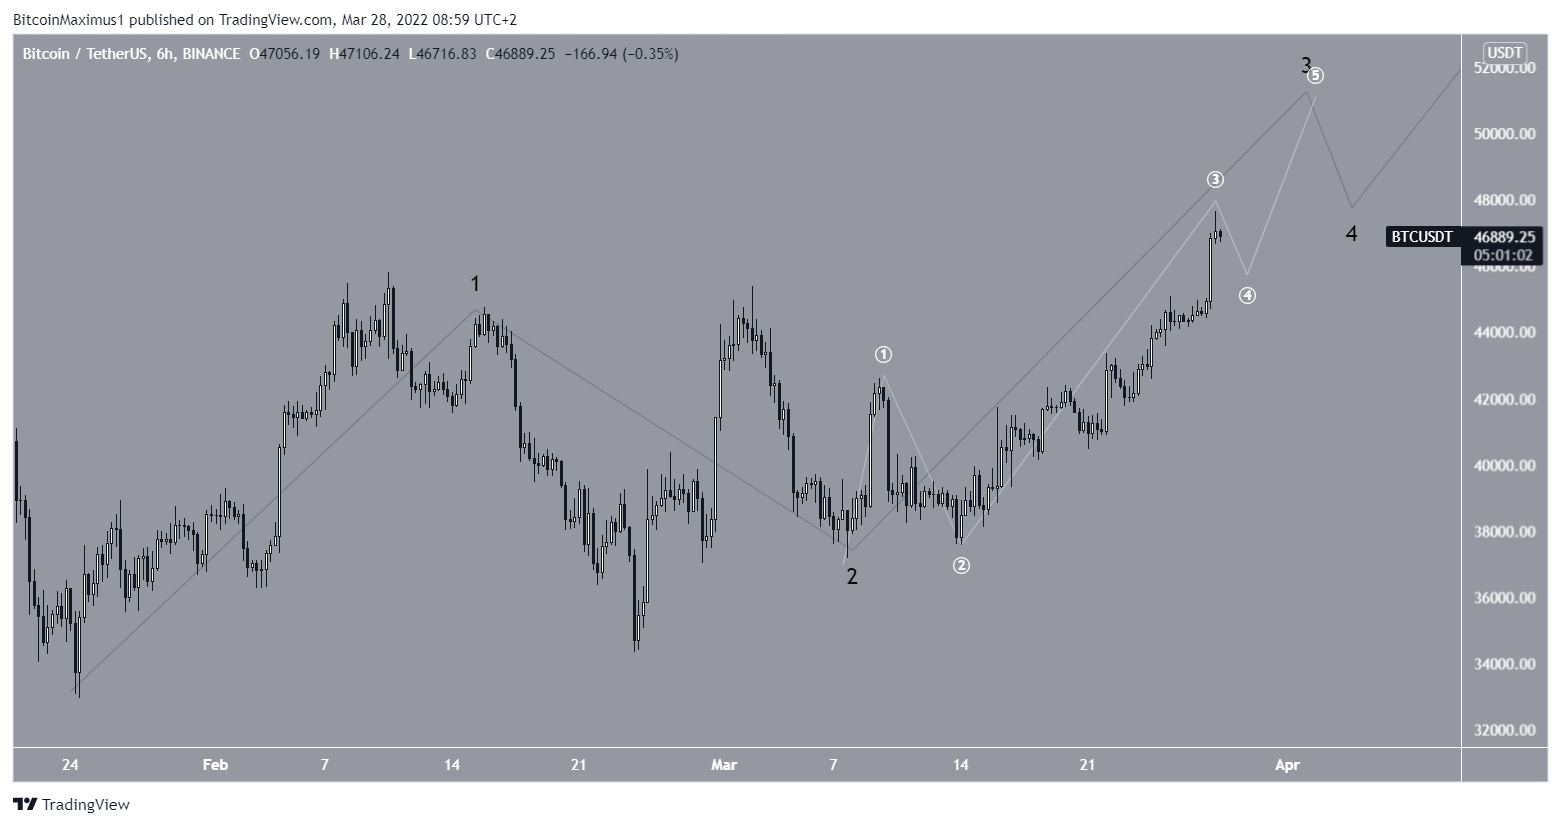
Wave count analysis
The most likely wave count indicates that BTC is in wave C of an A-B-C structure (black). The wave began on March 14, and was confirmed on March 23, once the price broke out from a symmetrical triangle.
The sub-wave count is shown in white.
A high of $50,700 would give waves A:C a 1:1 ratio, which is common in such structures.
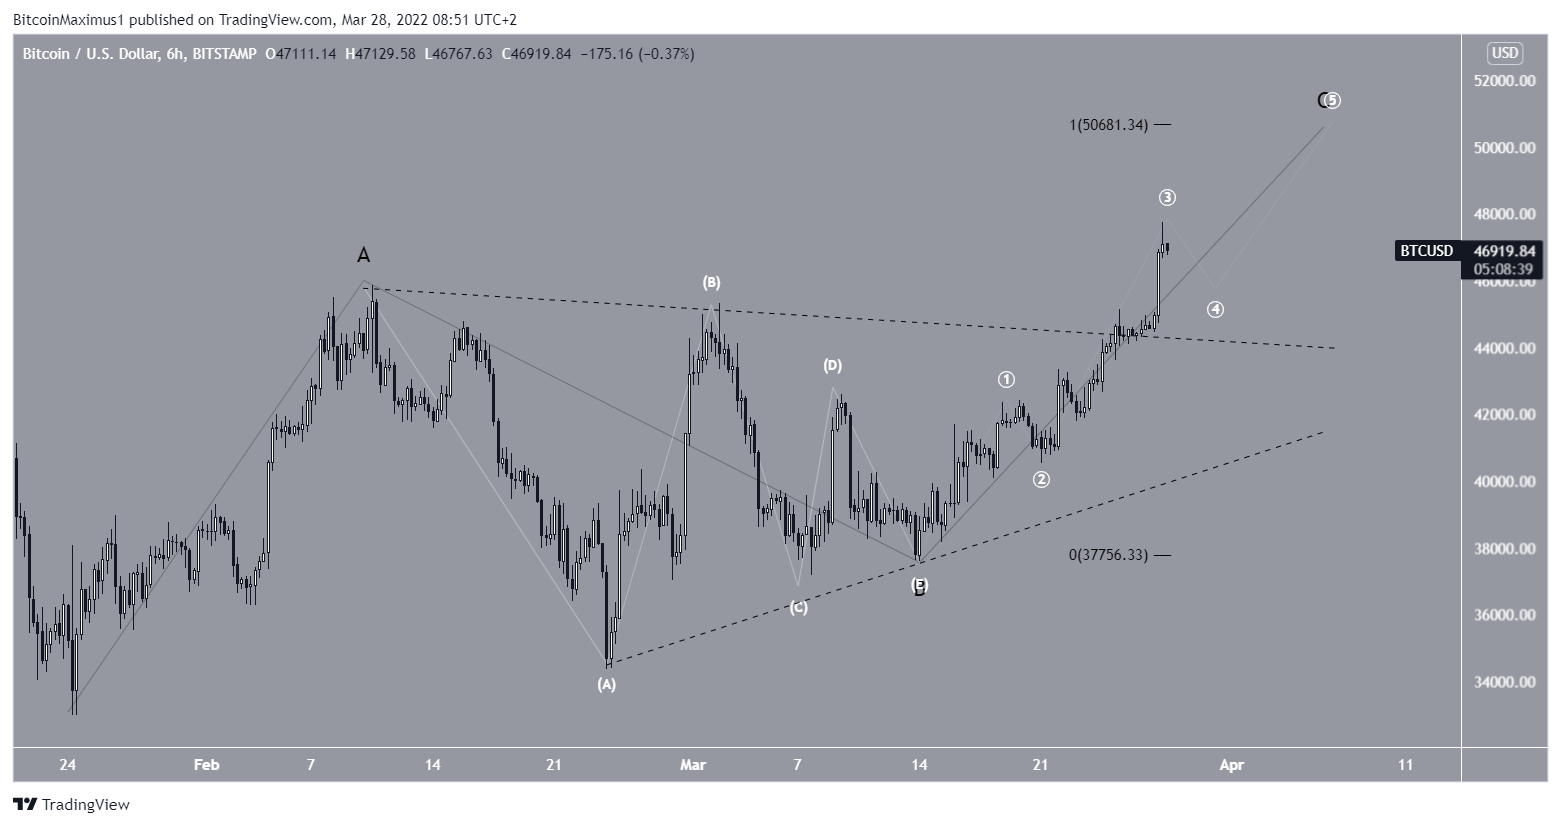
The alternate count suggests that BTC is in a series of bullish impulses and is currently in wave three (black).
Both counts support an upward move towards the neighborhood of $50,700.
For BeInCrypto’s previous Bitcoin (BTC) analysis, click here


