
Bitcoin (BTC) has been increasing since bouncing from support on June 8.
BTC is following a descending resistance line and is potentially making its fifth attempt at breaking out.
Ongoing BTC bounce
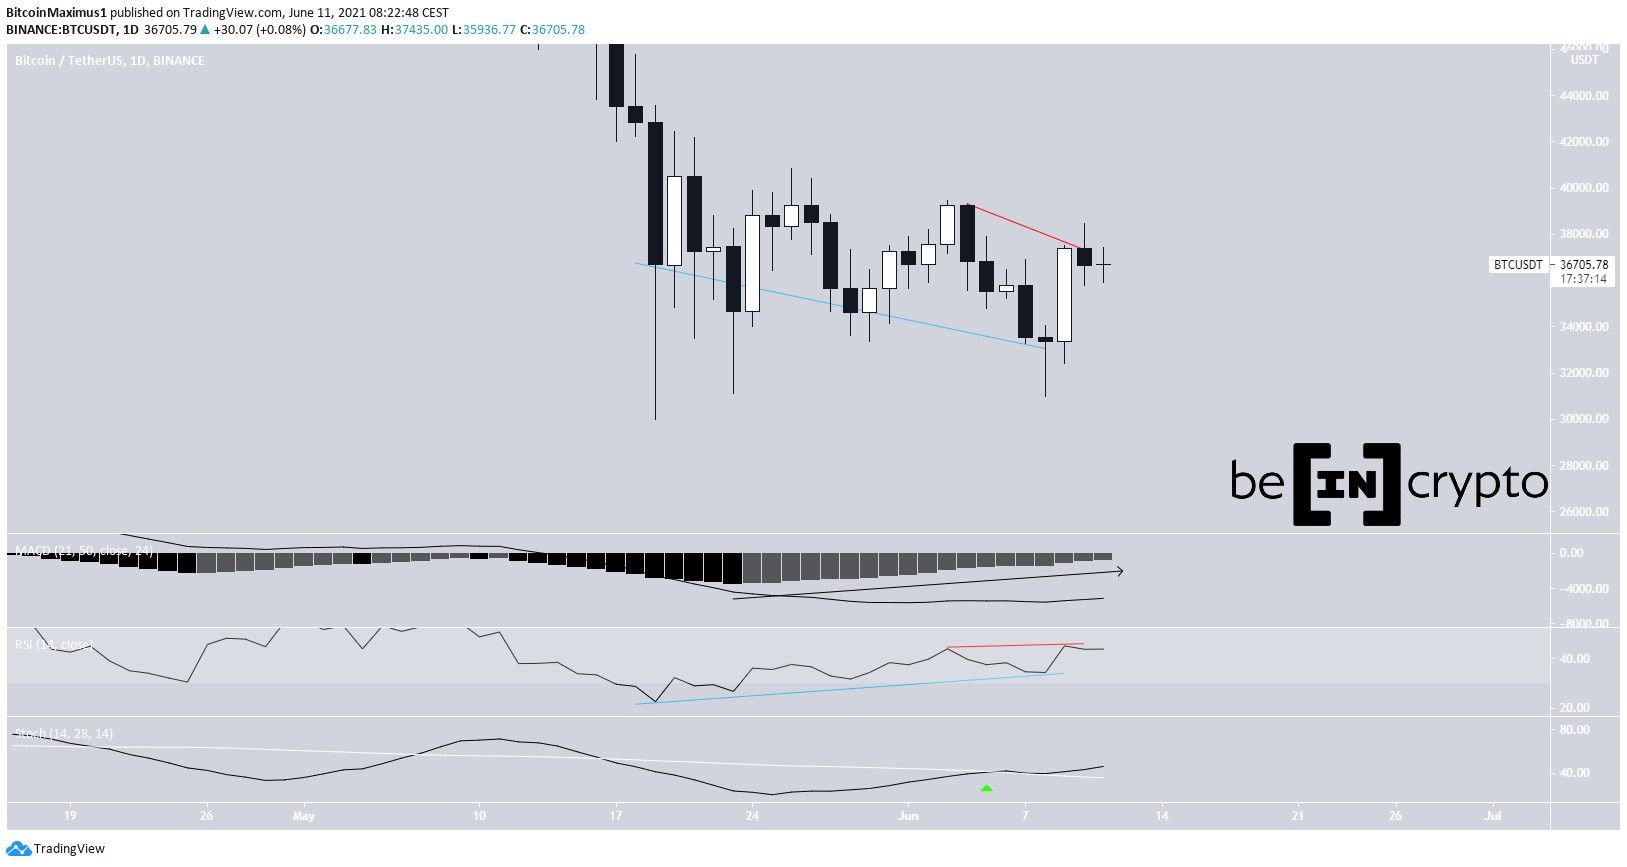
Bitcoin has been increasing since bouncing from support on June 8, after reaching a local low of $31,000. It created a bullish engulfing candlestick on June 9 and reached a high of $38,491 the next day.
However, technical indicators do not confirm the trend reversal. While they are leaning bullish, there are some mixed signals in place. The MACD is increasing, nearly crossing into positive territory, and the Stochastic oscillator has made a bullish cross.
There is a strong medium-term bullish divergence in place in the RSI (blue). Despite this, yesterday’s high also confirmed a hidden bearish divergence (red), which is a strong sign of bearish trend continuation.
BTC has to invalidate this hidden divergence with a higher high in order to confirm a bullish pattern.
Future movement
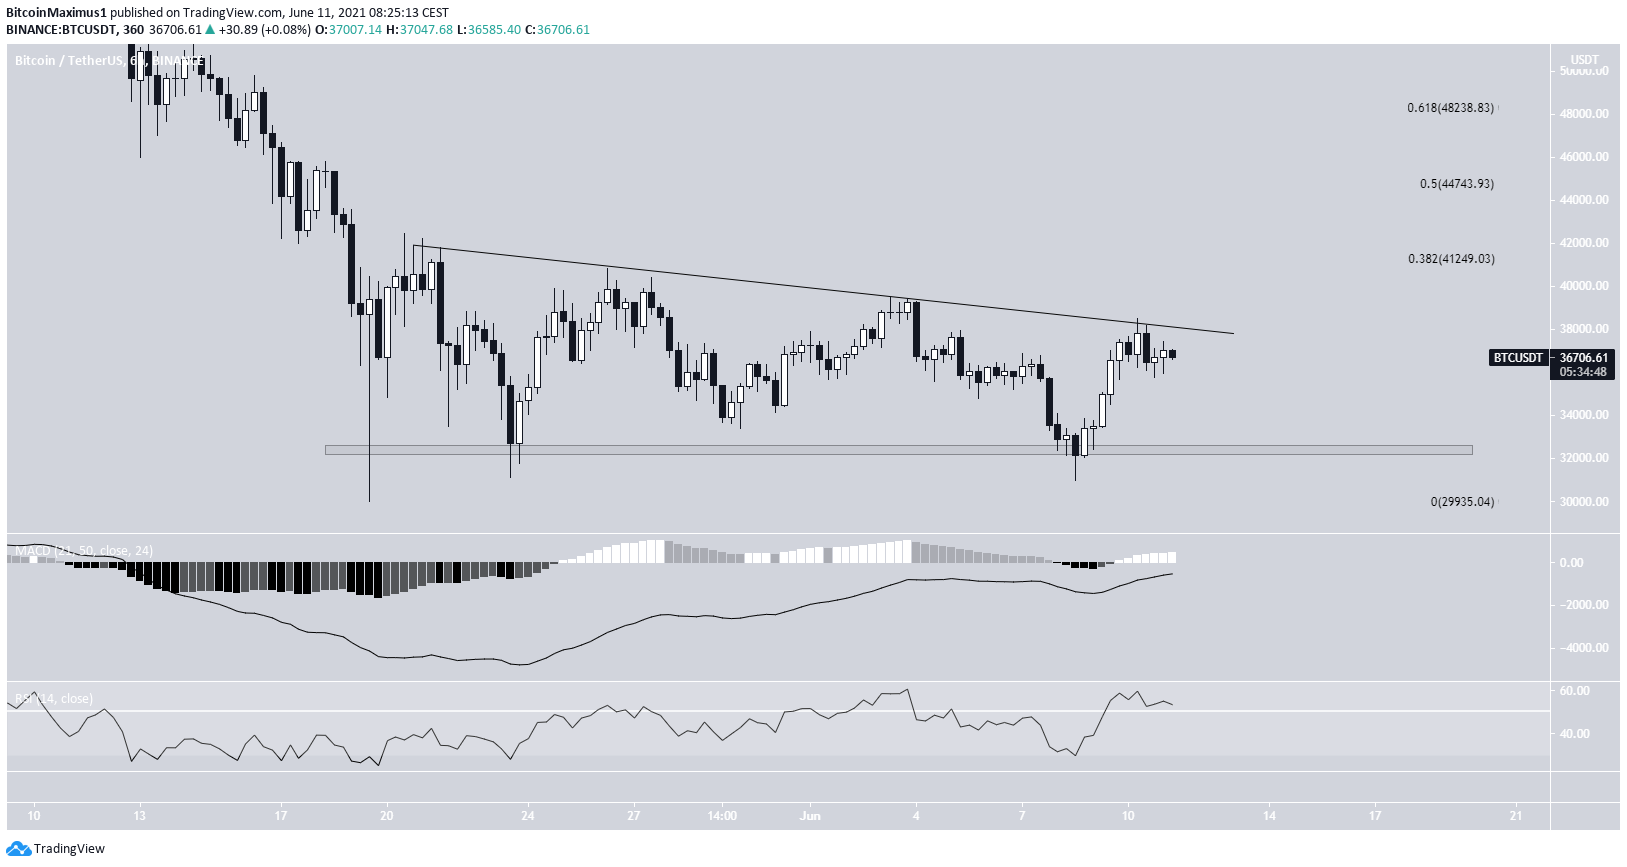
The six-hour chart shows that BTC is following a descending resistance line since May 20. Yesterday marked the fourth time it was rejected by it.
Technical indicators in the six-hour time frame are more bullish. The RSI has crossed above the 50-line and the MACD is close to turning positive.
A breakout from the line would take it towards the next resistance level at $41,300, $44,750, and potentially $48,200. Conversely, the closest support area is found at $32,400.
Wave count
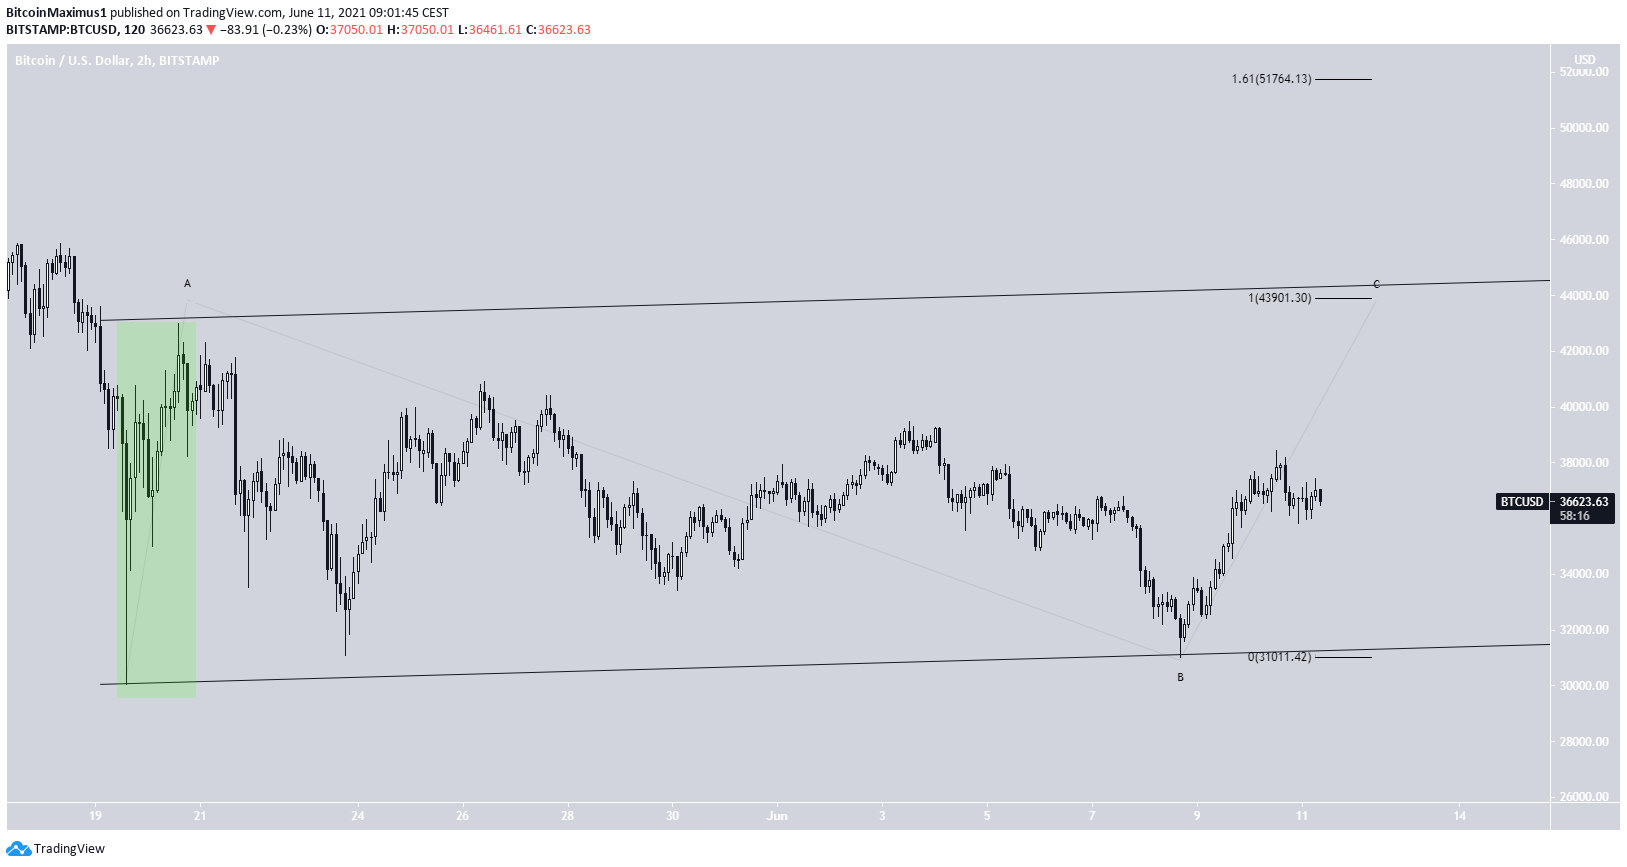
The movement since May 10 is a three-wave upward structure. Therefore, it’s unlikely to be the beginning of a bullish impulse. Rather, it’s potentially the A wave of an A-B-C flat correction, which would be contained inside a an ascending parallel channel.
Therefore, the most likely possibility is that wave C takes BTC towards $44,050. This would give waves A:C a 1:1 ratio and the price would reach the resistance line of the channel.
If wave C extends, it could take BTC all the way up to $51,764. At the current time, we cannot determine whether the upward movement will extend or not.
A breakout from the channel and movement above $47,000 would likely indicate that the low is in, while a rejection at the resistance line of the channel would favor the possibility of BTC eventually dropping towards another low.
For the long-term count, click here.
For BeInCrypto’s previous bitcoin (BTC) analysis, click here.
