
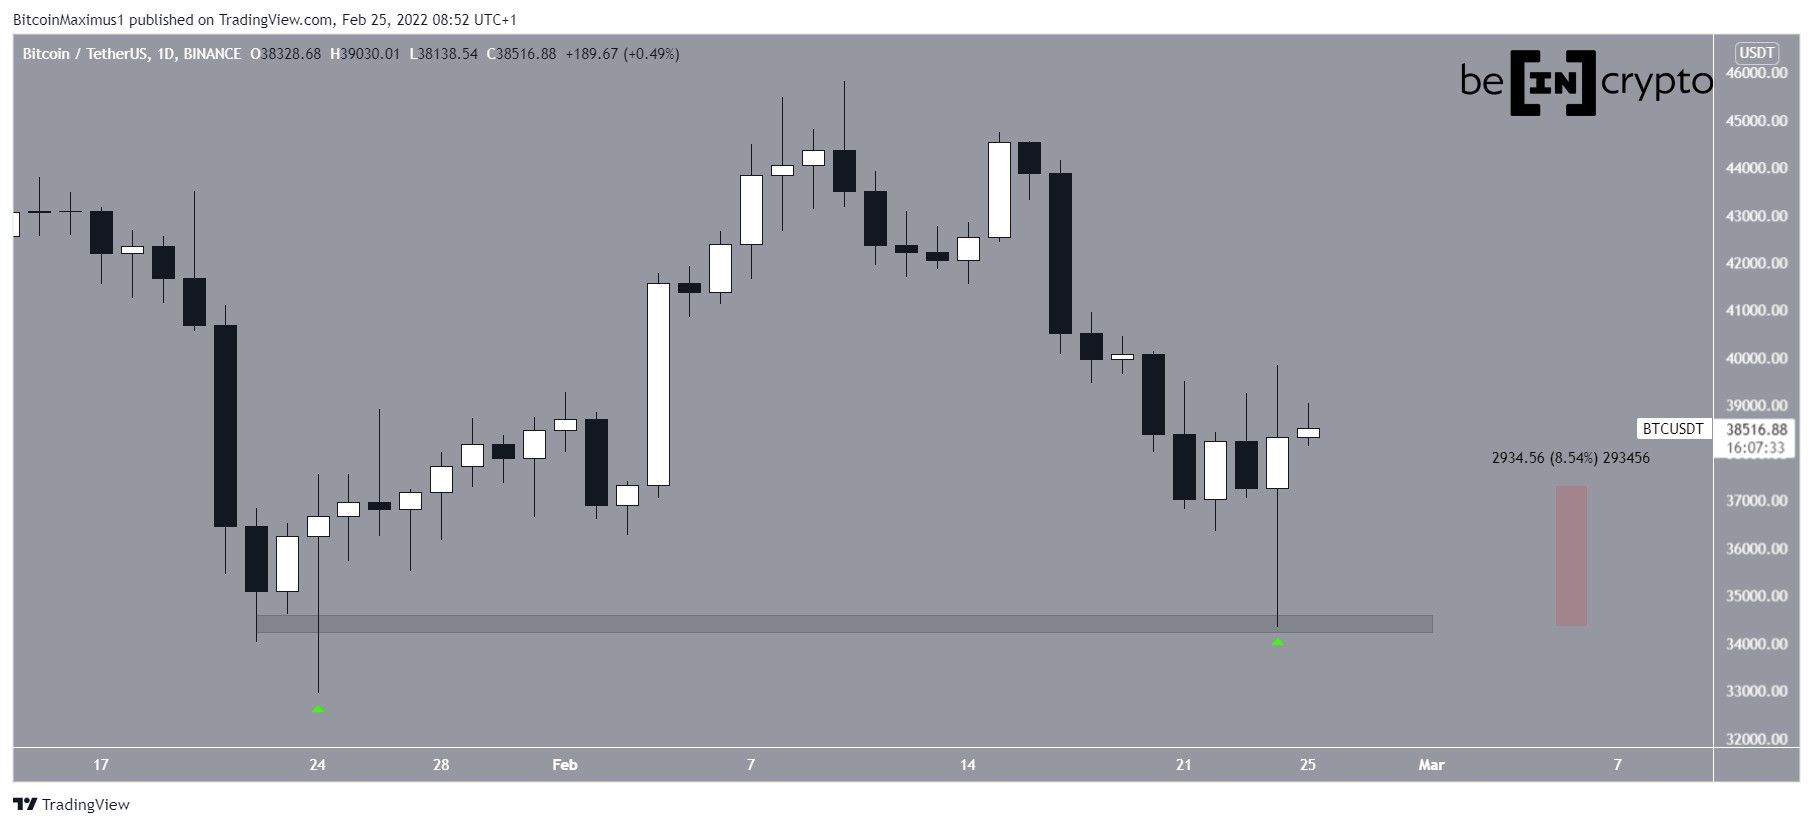
Bitcoin (BTC) increased considerably on Feb 24, reaching a high of $39,843 prior to being rejected. Reclaiming the $39,850 area is crucial for the continuation of the upward movement.
Bitcoin initially fell on Feb 24, reaching a low of $34,332. However, it bounced back immediately after and created a very long lower wick with a magnitude of 8.60%. In addition to this, the bounce served to validate the $34,400 horizontal area as support.
The bullish candlestick with a long lower wick has is very similar to that of Jan. 24 (green icons), after which BTC initiated a significant upward move. As a result, it’s possible that a similar pattern will emerge this time around.
Divergence precedes bounce
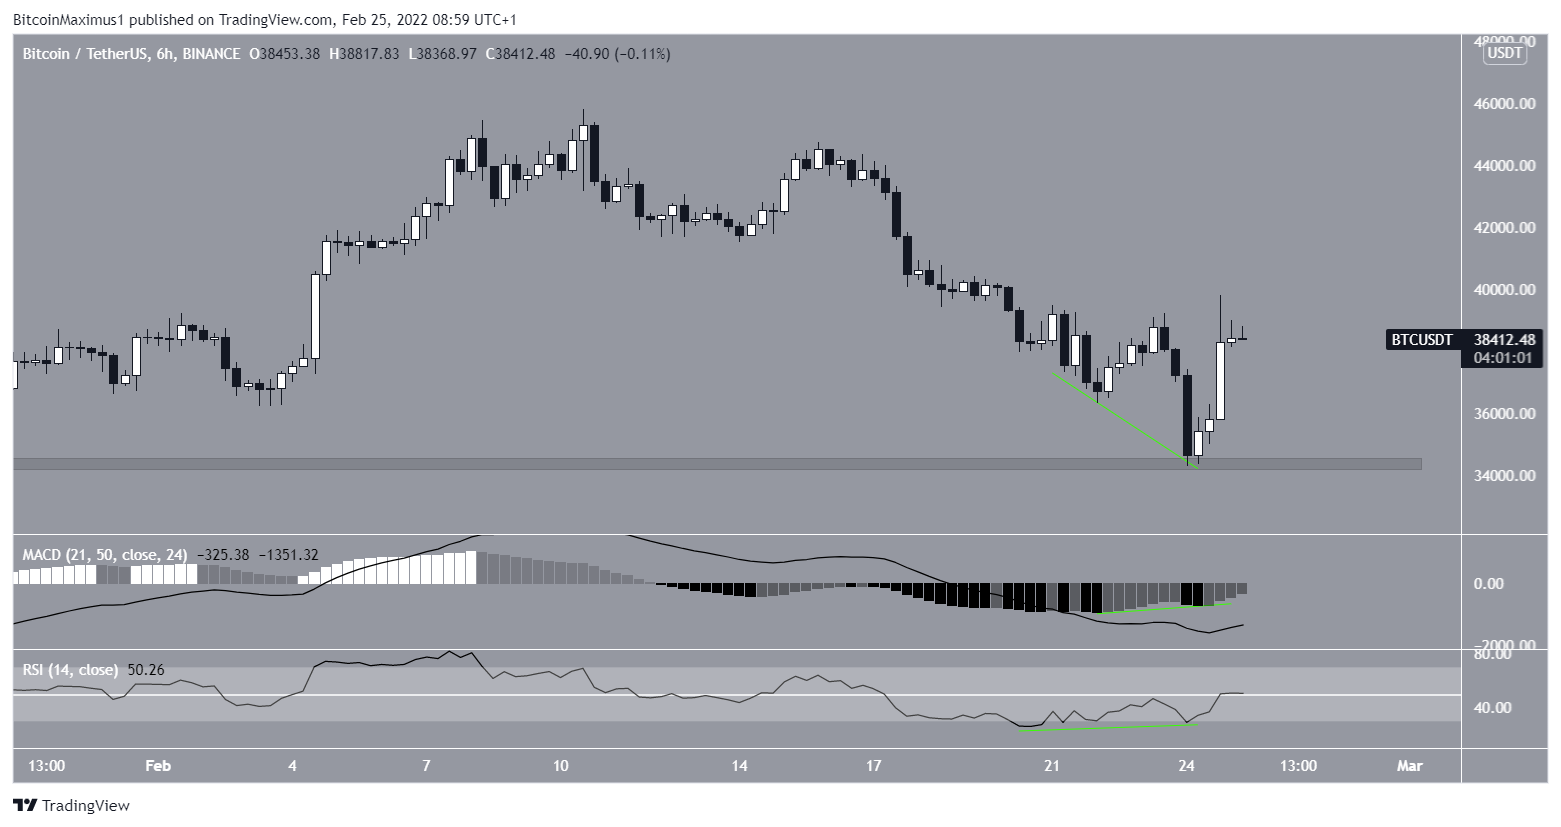
The six-hour chart shows that the bounce was preceded by very considerable bullish divergences (green line) in both the RSI and MACD.
Such divergences often precede upward movements, as was the case in yesterday’s BTC movement. This occurrence strengthens the validity of a potential trend reversal.
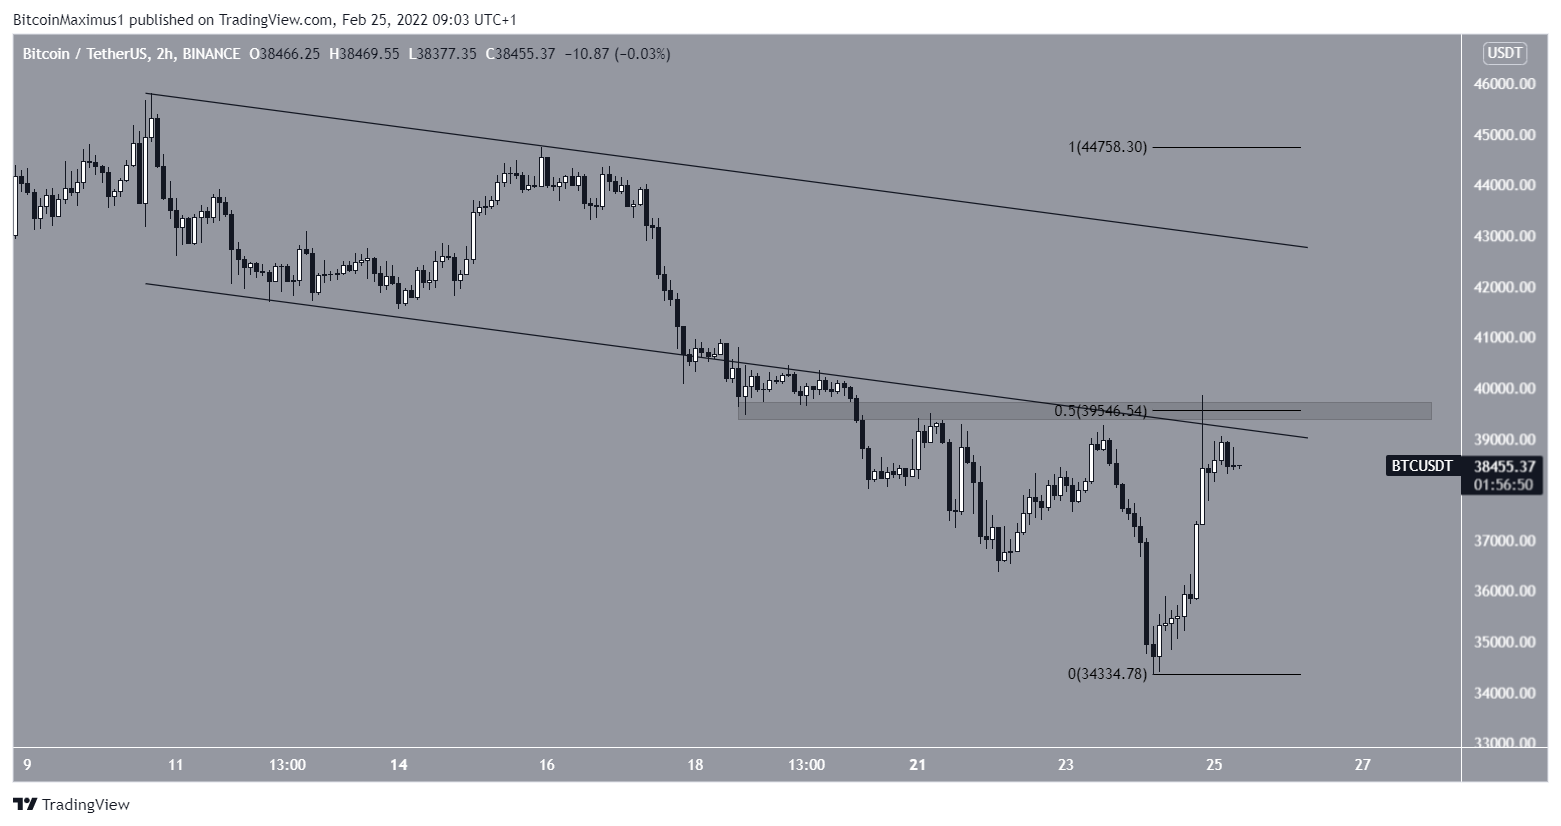
The two-hour chart shows that BTC is facing strong resistance at $39,550. This is the 0.5 Fib retracement resistance level, a horizontal resistance area, and also a range that coincides with the support line of a previous descending parallel channel.
The area rejected the price on Feb. 24, creating a long upper wick.
Therefore, reclaiming it is crucial in order for the trend to be considered bullish.
BTC wave count analysis
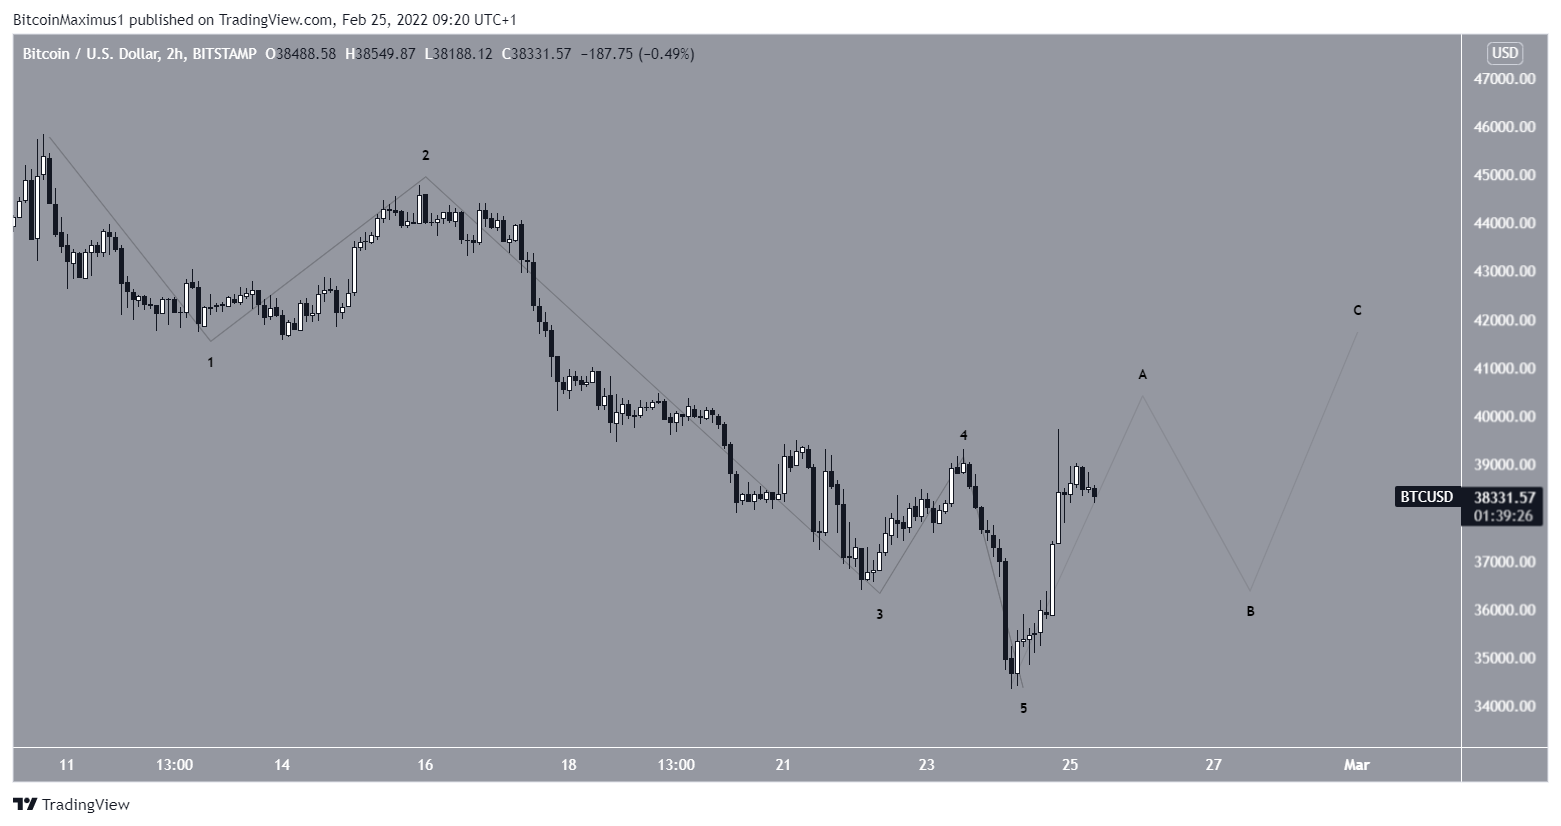
The wave count shows that BTC has completed a short-term five-wave downward move that ended with yesterday’s low. In many cases, what follows is an upwards corrective structure.
As it stands, the most likely scenario suggests that the price is in the process of completing the A wave of an A-B-C corrective structure.
After this, another brief downward move could transpire.
For BeInCrypto’s previous Bitcoin (BTC) analysis, click here
