


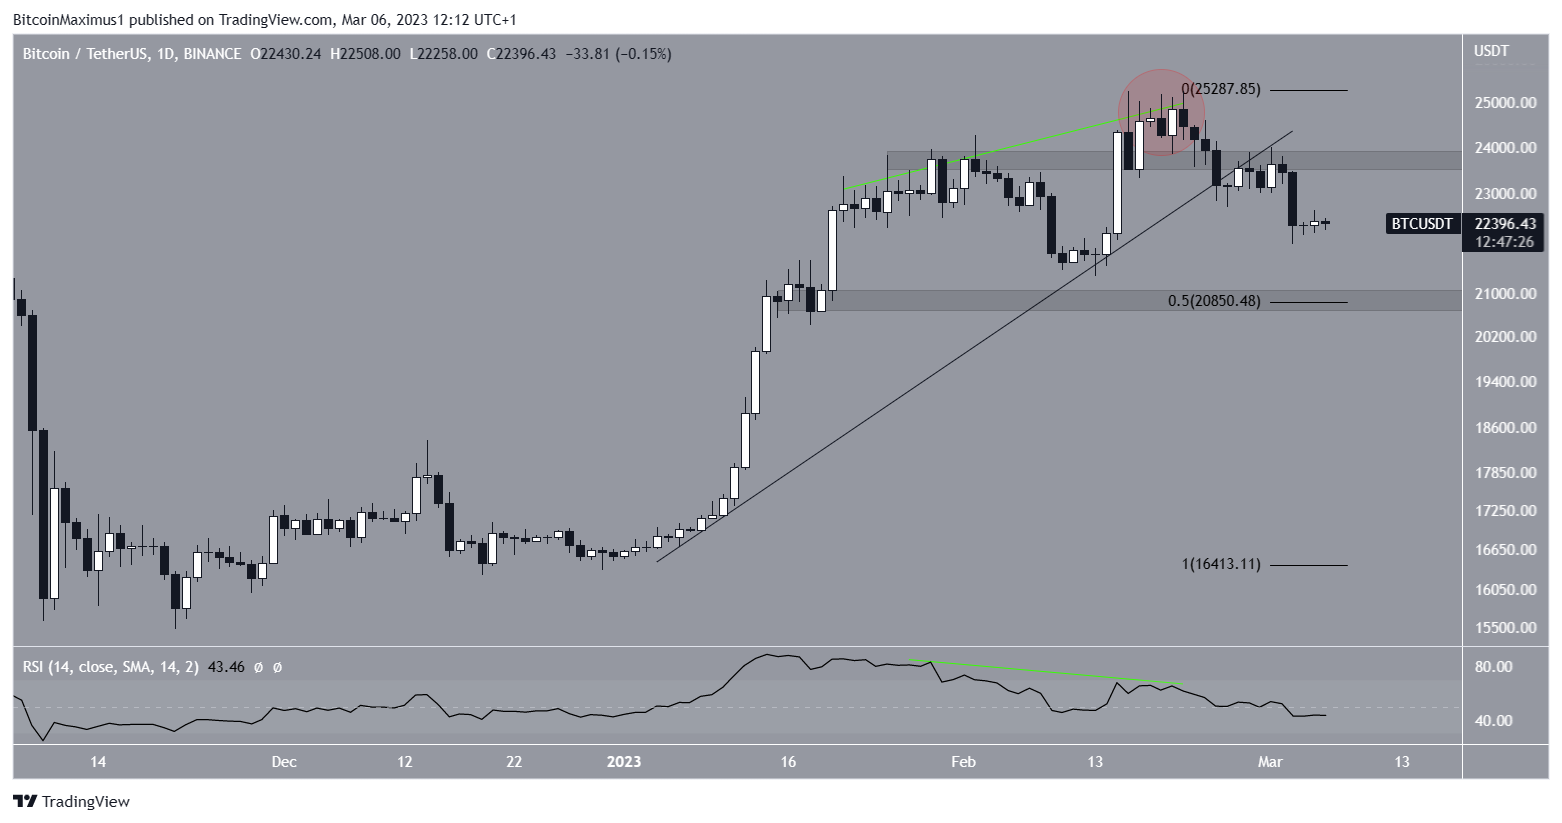
The Bitcoin (BTC) price broke down from an ascending support line that had been in place since the beginning of the year. This bearish development could be the beginning of a significant decrease for Bitcoin.
The Bitcoin price history since the $25,250 yearly high on Feb. 25 is bearish. There are three main reasons for this:
Firstly, the BTC price deviated above the $23,800 resistance area (red circle). Such deviations are considered bearish developments, and lead to bearish trend reversals most of the time.
Bitcoin (BTC) Price Sends Bearish Signals
Secondly, the deviation was preceded by a significant bearish divergence in the daily RSI (green line). The RSI is now below 50, another bearish sign.
Finally, BTC broke down from an ascending support line, indicating that the upward movement is done.
If the decrease continues, the closest support is at $20,850, created by the 0.5 Fib retracement support level and a horizontal support area. This is the most likely scenario.
However, reclaiming the $23,800 resistance would invalidate this bearish BTC outlook. That could lead to highs near $27,000.
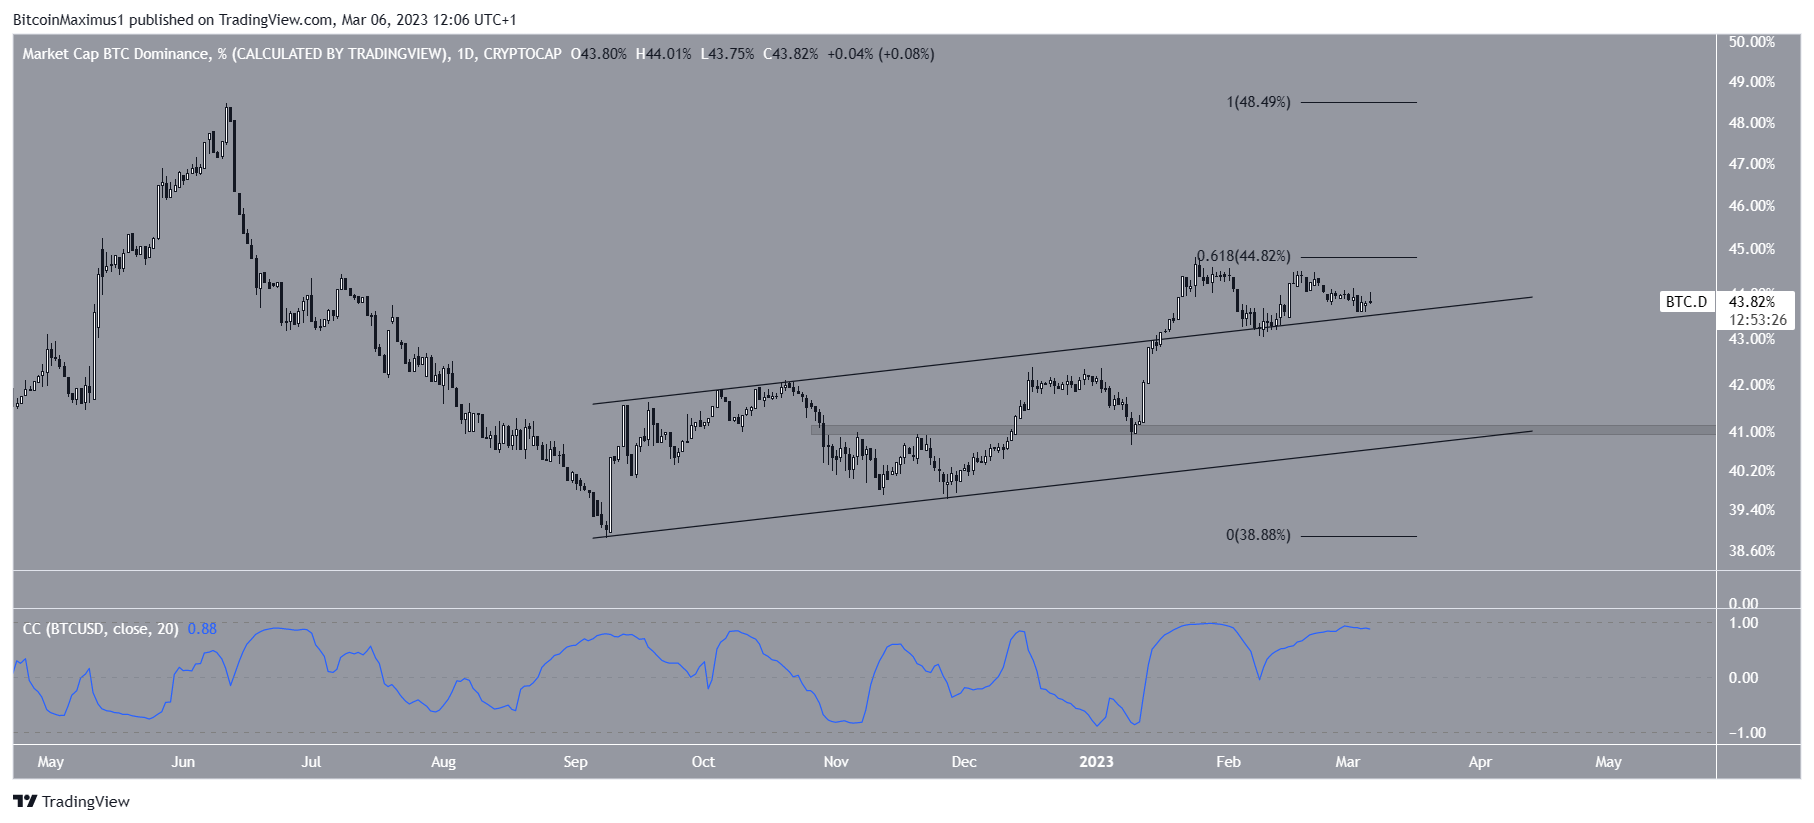
Bitcoin Dominance Rate (BTCD) Stumbles at Resistance
The BTCD broke out from an ascending parallel channel on Jan. 17. It made a high of 44.79% eight days later. However, it was rejected by the 0.618 Fib retracement resistance level and has fallen since. Currently, BTCD is barely hanging on to the channel’s resistance line.
If BTCD bounces and breaks out above the 0.618 Fib resistance, it could increase to 48.50%. However, if it falls back inside the confines of the channel, a drop to the channel’s support line at 41% would be the most likely scenario.
BTCD and the Bitcoin price have a nearly perfect correlation (blue). This means that an increase in one causes an increase in the other and vice-versa.
Since the most likely BTC price forecast is a drop, this would also fit with a BTCD decrease.
To conclude, the most likely BTC price outlook is a fall toward the $20,850 confluence of support levels. A close above $23,800 would invalidate this bearish scenario and could lead to an increase toward $27,000.
For BeInCrypto’s latest crypto market analysis, click here.


