
Last week, the Bitcoin (BTC) price surged 11.5%, forming a bullish engulfing candle. If the resistance at the $25,000 level is successfully surpassed, the long-term increases could continue. The next target is the $29,500 area.
With the creation of the engulfing candle, the BTC weekly chart formed its first higher low since September 2021. In addition, this low served to validate the descending logarithmic resistance line as support (green circle). Similar events following previous bear markets were signals of the start of a new bull cycle.
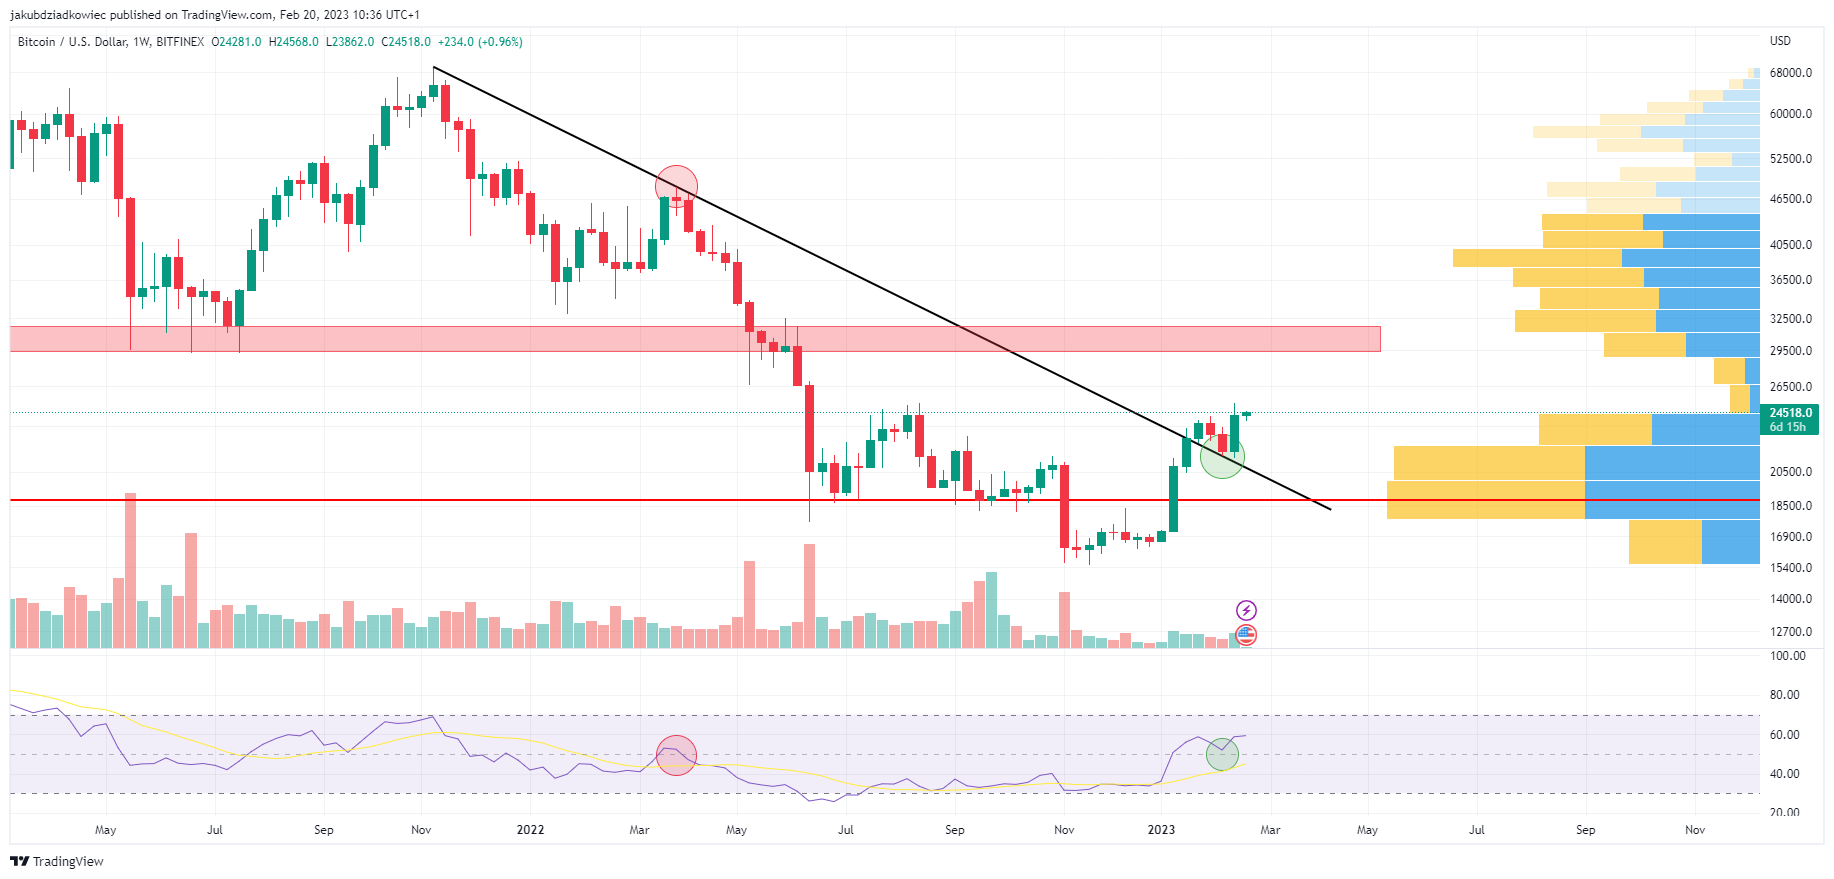
Earlier in March 2022, the same descending line rejected the Bitcoin price and confirmed a long-term bearish trend reversal (red circle). Now an opposite pattern appears on the chart, which could signal a bullish reversal.
This interpretation is reinforced by readings from the weekly RSI, on which an analogous situation is taking place. The indicator has validated the neutral 50 line as support. Readings above this value are interpreted upward. In addition, we see that in March 2022, the 50 line rejected the indicator, which until January 2023 was below this level.
Bitcoin (BTC) Heads Towards Summer 2021 Lows
Moreover, the Volume Profile Visible Range (VPVR) indicator shows that there is little resistance above $25,000. The small trading volume readings above this level suggest that BTC price could make a quick move towards the next important resistance area, around $29,500 (red rectangle).
During the previous bull market, the $29,500 – $31,700 range acted as support in the summer of 2021. It also served as support after the Terra (LUNA) ecosystem crash in May 2022 but was lost a month later. It is now expected to act as resistance, where the upward impulse that has been going on since the beginning of this year will end.
Bounce After Shallow Correction
Readings from the daily time frame support the bullish outlook from the weekly chart. Firstly, we see a price breakout above and validation of the descending logarithmic resistance line (black) mentioned in the previous section.
Then, the validation of this line coincides with the Bitcoin price correction to the 0.382 Fib retracement level, calculating the entire increase from the absolute bottom at $15,487 on November 21, 2022. The shallow correction to this Fib level is a bullish signal, as it indicates a strong uptrend that is likely to continue.
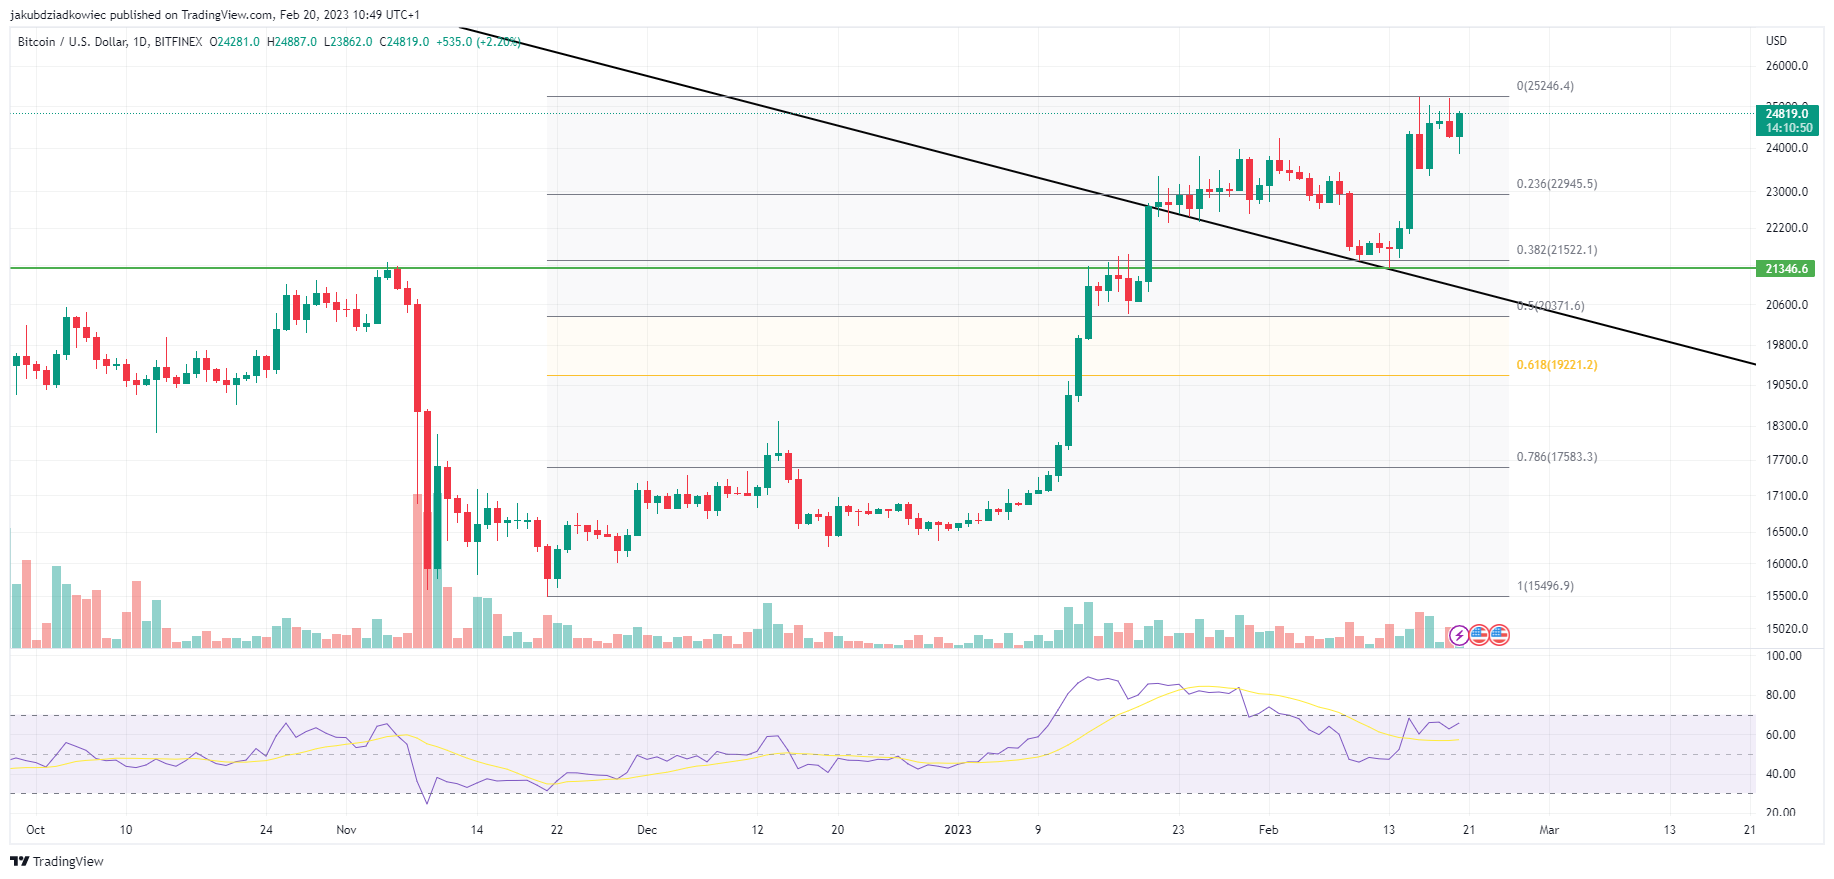
At the same time, the correction has validated the $21,300 level as support (green line). Previously, this area rejected the BTC price in early November 2022. On the other hand, in January 2023, Bitcoin consolidated below this level for several days before breaking out strongly later.
Its re-test turns the previous resistance into support and gives another bullish signal for the continuation of the upward momentum. However, a drop in the BTC price below this area would be a bearish event that would initiate a move to the 0.618 Fib retracement level at $19,200.
In conclusion, both the daily and weekly time frames contain a bullish outlook for the BTC price. If resistance at $25,000 can be broken through, Bitcoin price could quickly move towards $29,500. On the other hand, if rejection occurs, it will be crucial to hold support at $21,300.
For BeInCrypto’s latest crypto market analysis, click here.
