


The Bitcoin (BTC) price has increased since August 1. The price broke out after creating a higher low on August 7 and reached $30,000 the next day.
Despite the increase, a positive reaction to the $30,000 area is still required for the trend’s direction to be confirmed as bullish.
Bitcoin (BTC) Price Finally Reaches $30,000
The BTC price has fallen since reaching a high of $31,818 on July 13. The decrease was contained inside a descending parallel channel and culminated with a low of $28,585 on August 1. Despite the drop, the BTC price held above the $28,800 horizontal support area, validating it multiple times (green icons). The bounces created long lower wicks, considered signs of buying pressure. This is especially evident on the August 7 wick.
The price has increased since. It broke out from the parallel channel on August 7 and moved above $30,000 the next day. BTC has not experienced any retracement since breaking out.
However, despite the increase and breakout, BTC still trades below the $30,000 horizontal area. This is a crucial level since it had acted as support since July 24 and has now turned to resistance.
The BTC price has to reclaim in order to confirm that the correction that started on July 15 has ended. The $30,000 area would support the ensuing upward movement in that case.
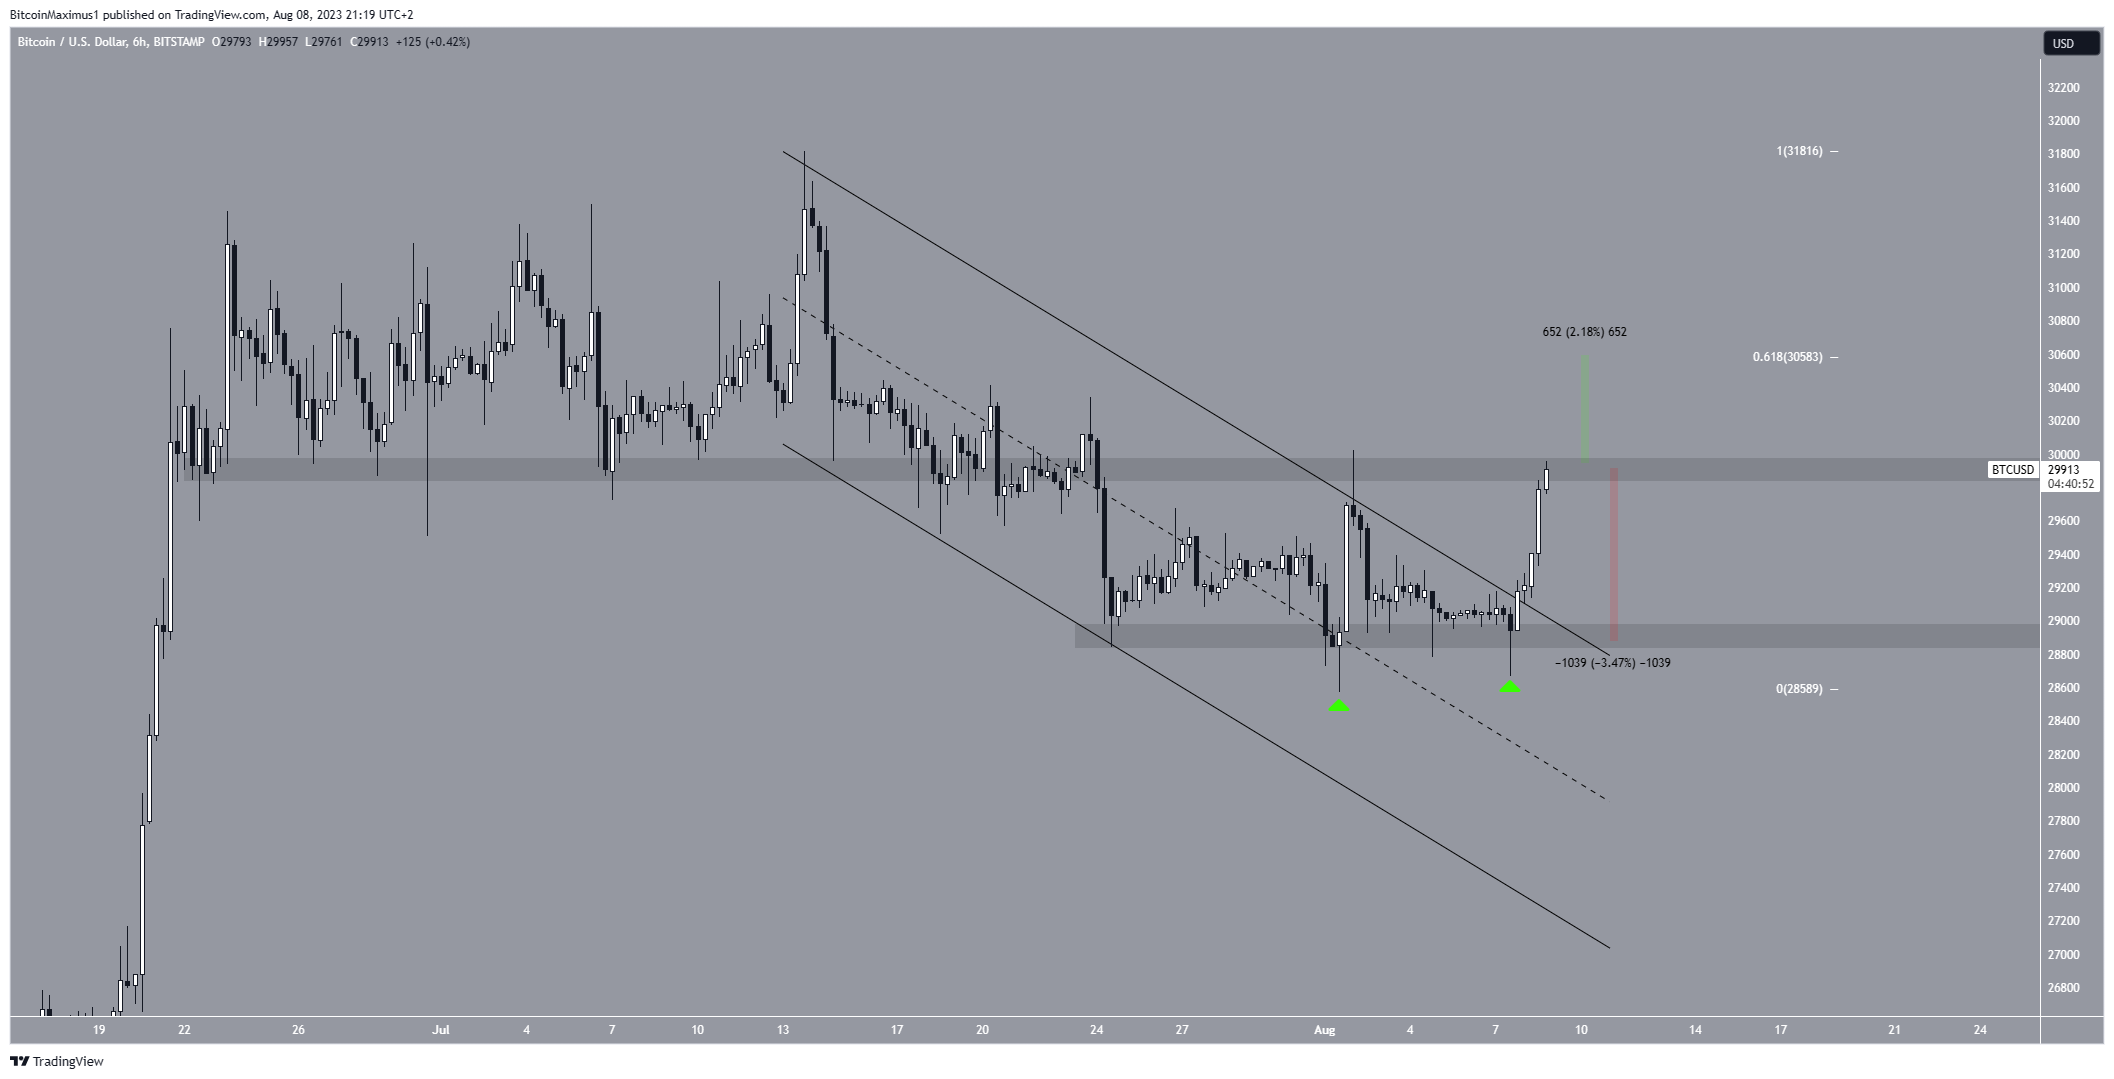
If that happens, the next resistance will be at $30,560, created by the 0.618 Fib retracement resistance level. This would amount to an increase of 2.10% from the current price.
Since the 0.618 Fib level often acts as the top or bottom of the movement is corrective, an increase above it would suggest that the trend is bullish. On the other hand, a rejection would lead to a drop in the $28,800 support area. This would amount to a decrease of 3.50%.



