


Be[In]Crypto takes a look at on-chain indicators, specifically, the NVT (Network Value to Transaction) to determine if the Bitcoin (BTC) network is valued correctly.
Created by Willy Woo, NVT is an on-chain indicator that measures the ratio between the transaction volume of an asset and its market capitalization.
High readings mean that the network value is increasing at a higher pace than its transaction volume. This is considered a bearish sign, since it indicates that the increase is not organic and in turn might not be sustainable.
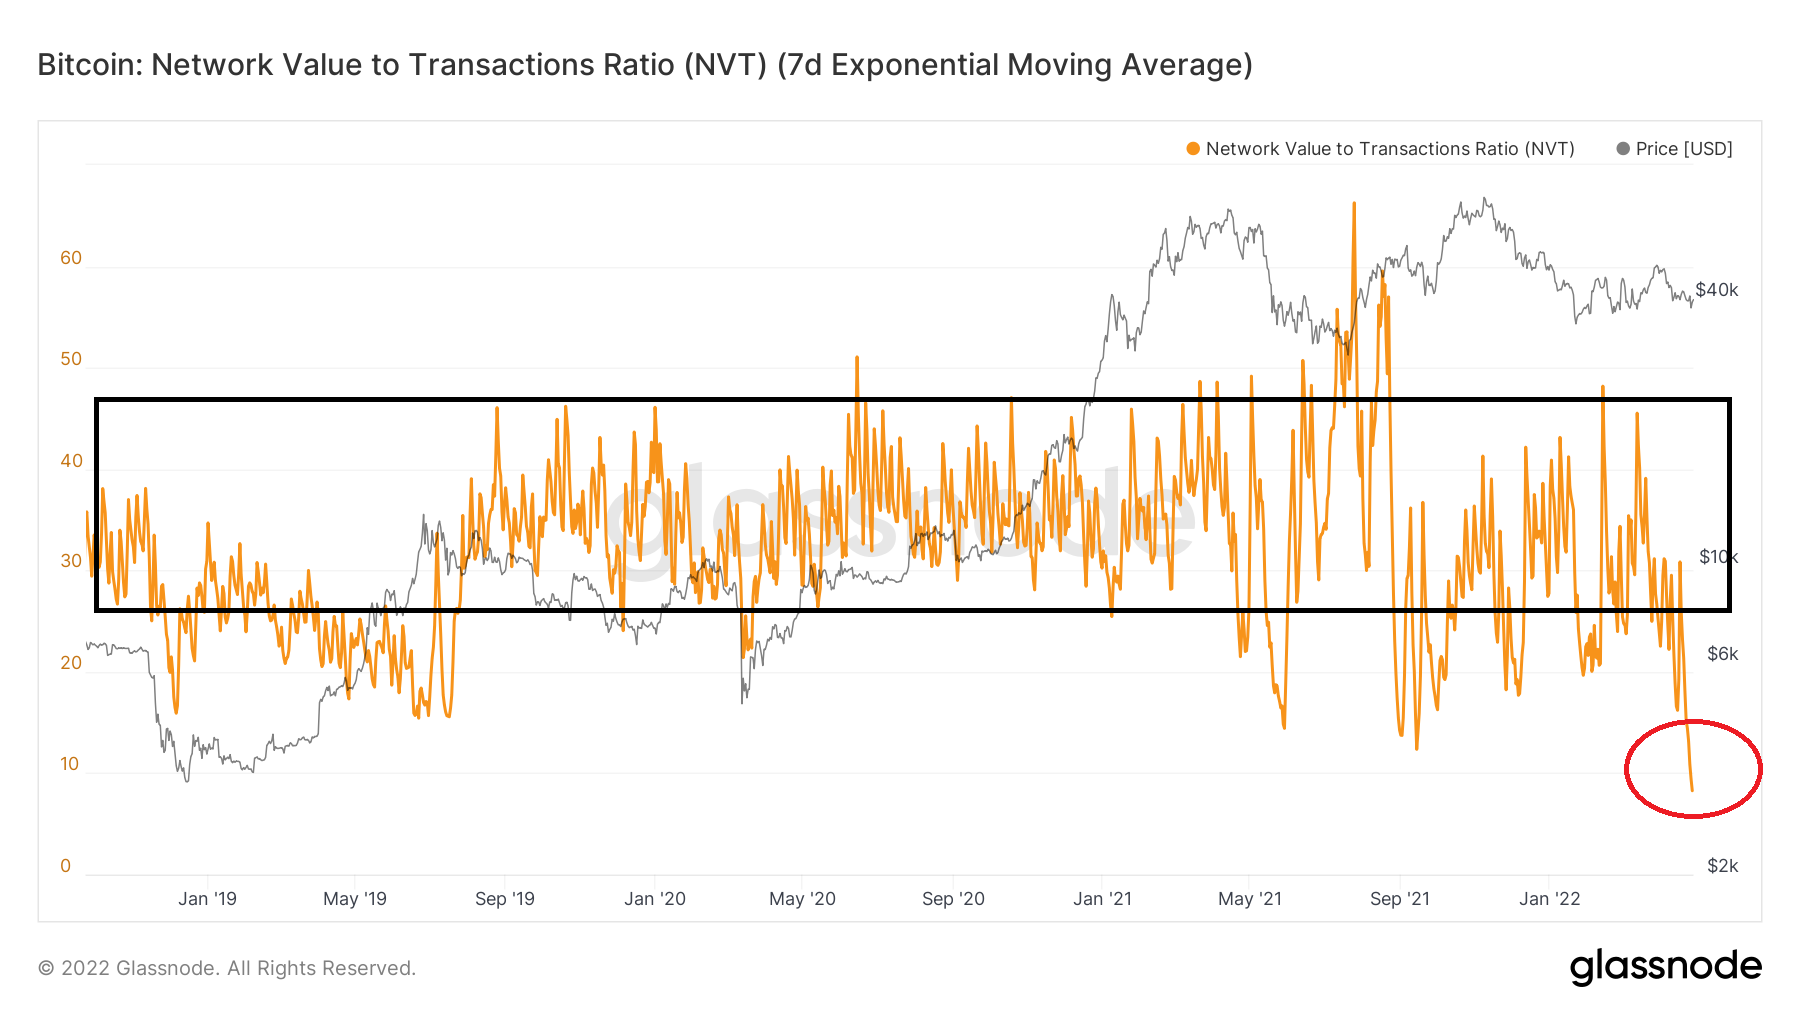
Current reading
Since the current bull run began on December 2018, NVT has given readings between 15 and 66. It has traded between 30 and 50 the vast majority of the time (black rectangle), but there have been considerable deviations below and above since July 2021.
Interestingly, it has been decreasing in April and proceeded to reach a low of 8.28 on April 28 (red circle). This is the lowest value since January 2018.
Therefore, according to NVT, the current BTC price is extremely undervalued.
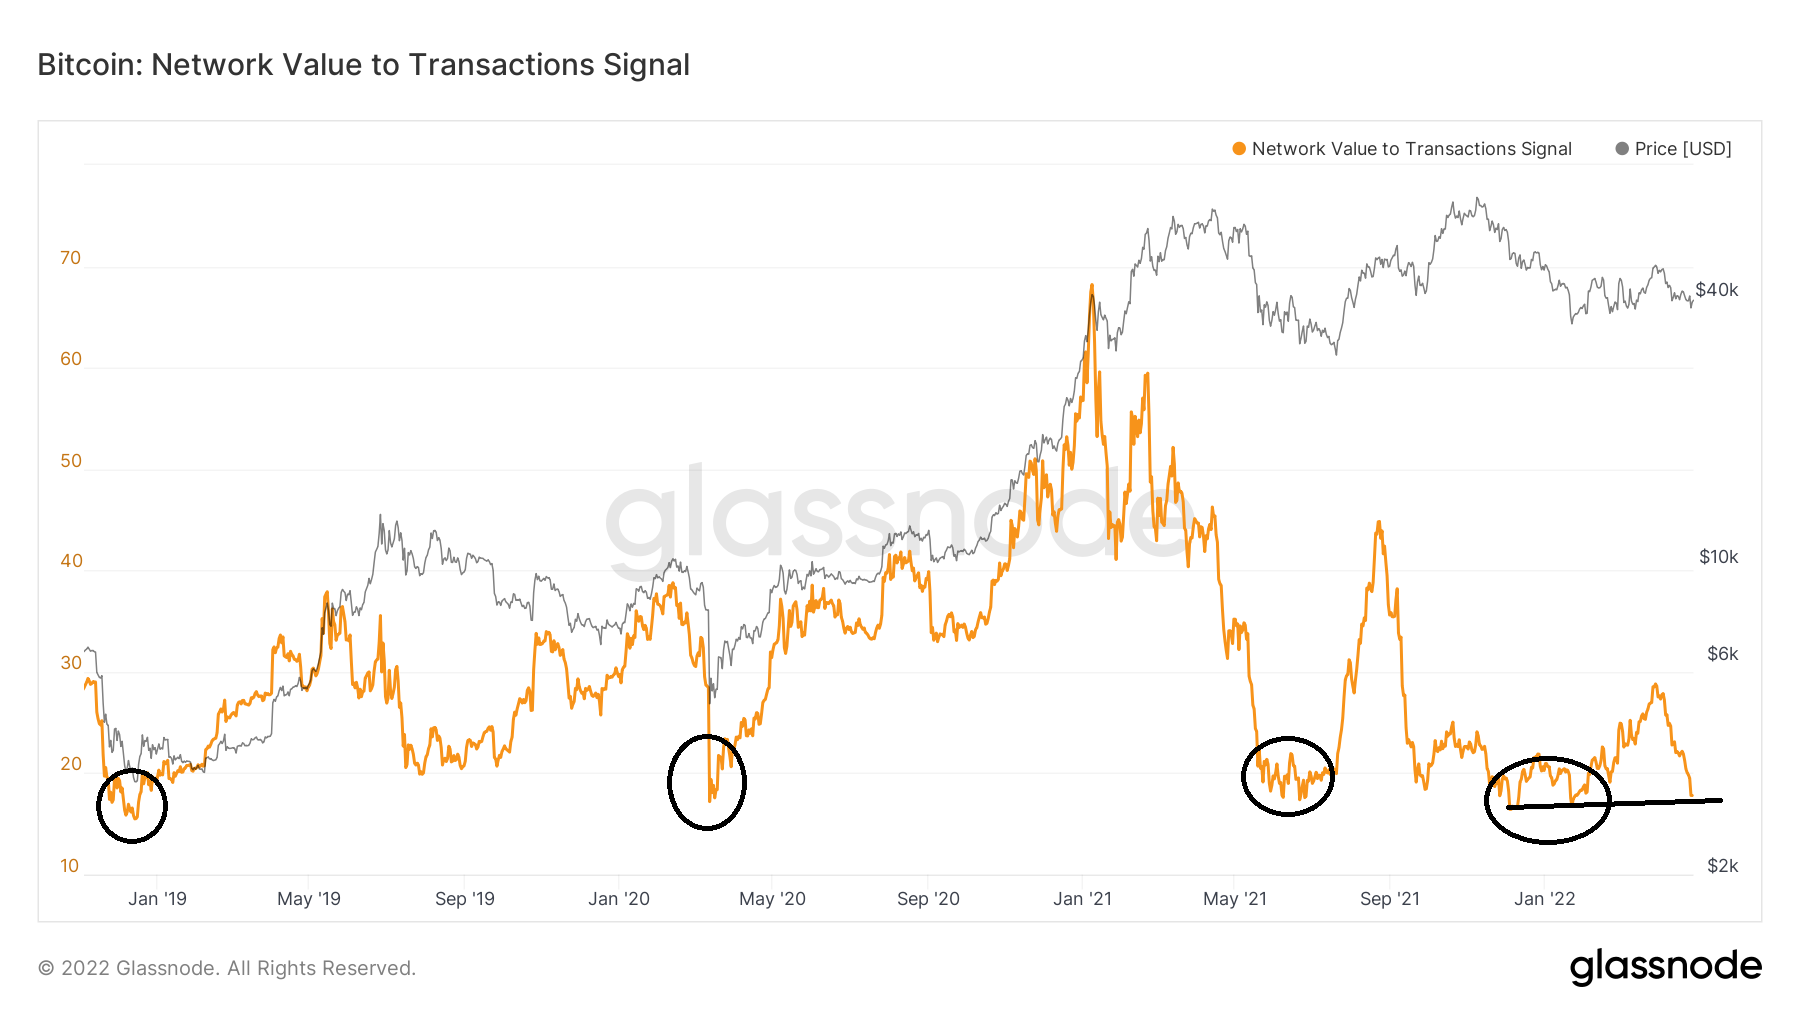
NVT signal
The NVT signal is a slightly different indicator, which uses a 90-day moving average (MA) of the transaction volume instead of the raw data.
The indicator gave readings below 20 only four times (black circles) since December 2018. The first three led to considerable upward movements, while the fourth one has yet to initiate a response.
Currently, NVT signal is at 17.8, and is approaching its yearly lows of 16.60.
Since the trendline from those lows (black line) is still intact, the possibility that an upward movement will follow still remains.
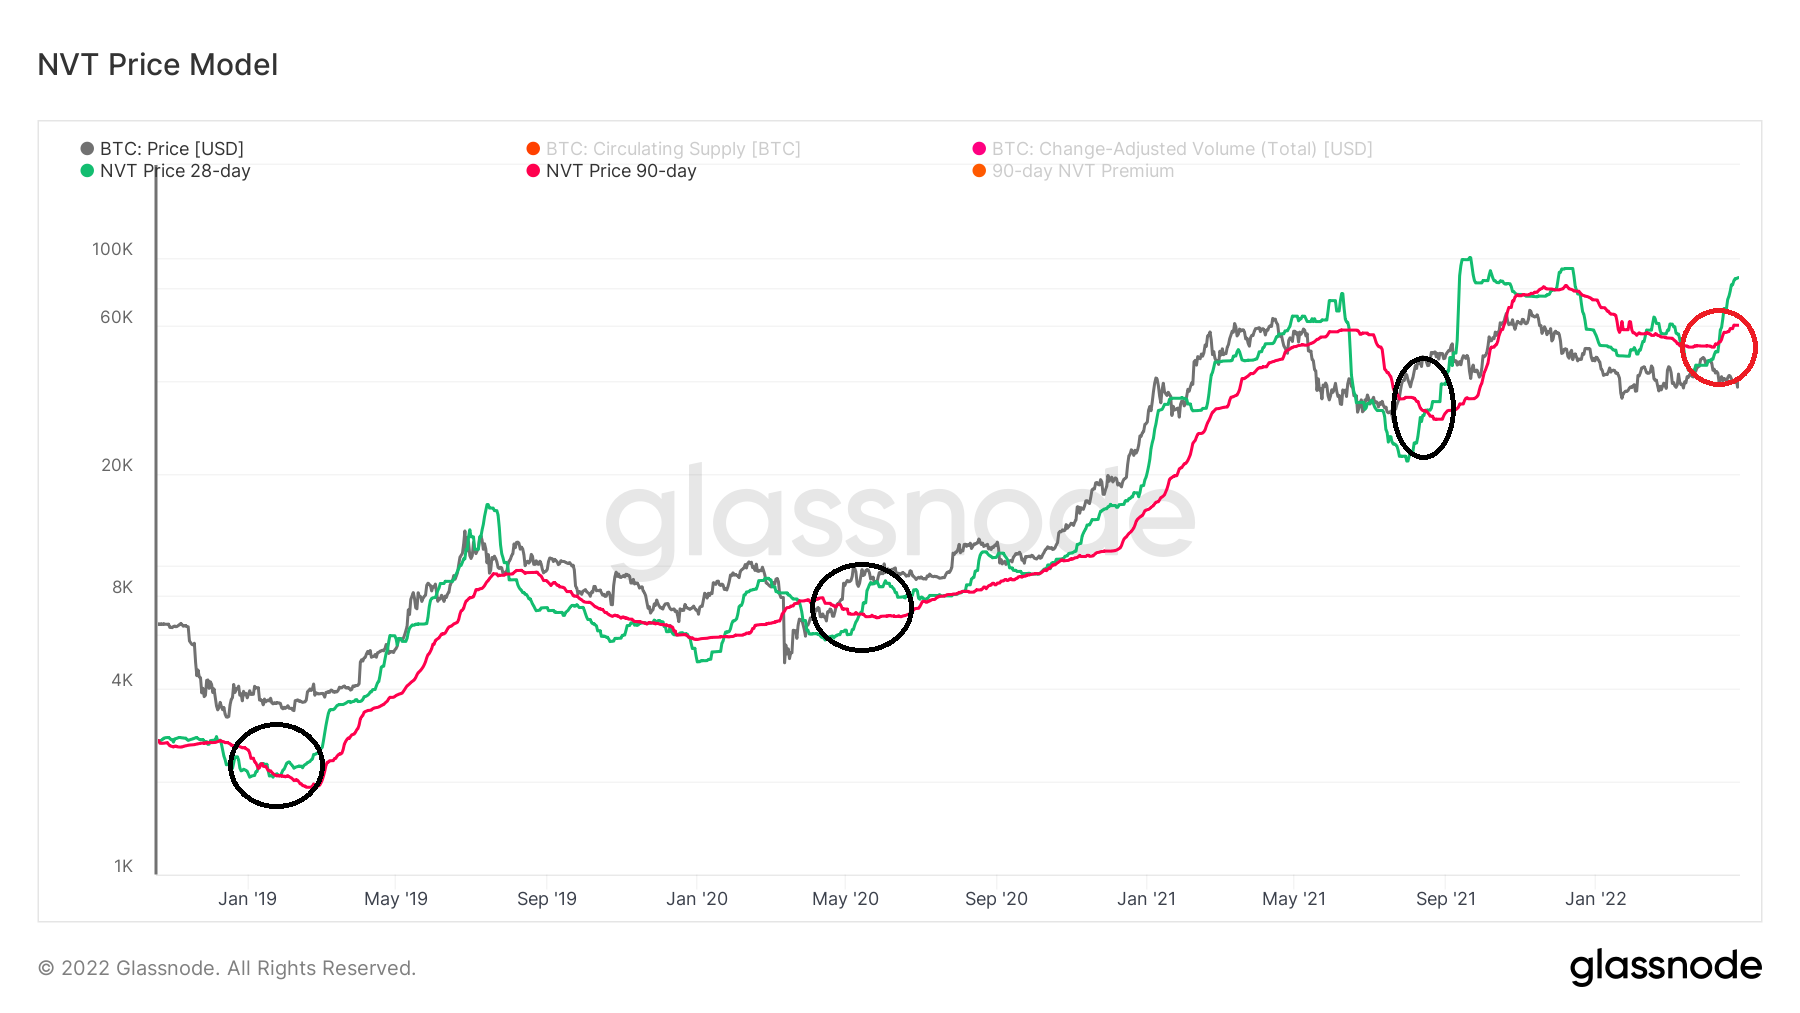
NVT price model
Finally, the NVT price model provides an interesting reading that supports the possibility that an upward movement will follow. The model uses a 28-day (green) and a 90-day (red) median of the NVT ratio in order to provide a fast and a slow signal.
A bullish cross occurs when the fast (green) signal crosses above the slow (red) one. Historically, such crosses have preceded upward movements (black circle).
A bullish cross occurred on April 11 (red circle), and the fast signal has been moving upwards at an accelerated rate since.
Ultimately, NVT and its variations all suggest that BTC is undervalued and an upward movement could begin soon.
For Be[I]nCrypto’s latest Bitcoin (BTC) analysis, click here.
What do you think about this subject? Write to us and tell us!


