Net Unrealized Profit/Loss (NUPL) is one of the best-known on-chain indicators that has been giving signals of an impending bottom in the price of Bitcoin (BTC) for some time now. In a recent post, analyst @caprioleio tweeted, based on NUPL analysis, that Bitcoin has reached a “deep value region.”
NUPL historical lows have always correlated with BTC price macro lows. Will the capitulation on the chart of this on-chain indicator signal the end of the bear market this time too?
What is NUPL?
Net Unrealized Profit/Loss is an on-chain indicator that calculates the difference between relative unrealized profit and relative unrealized loss. In another way, it can be calculated by subtracting the realized market capitalization from the market capitalization and dividing the result by the latter.
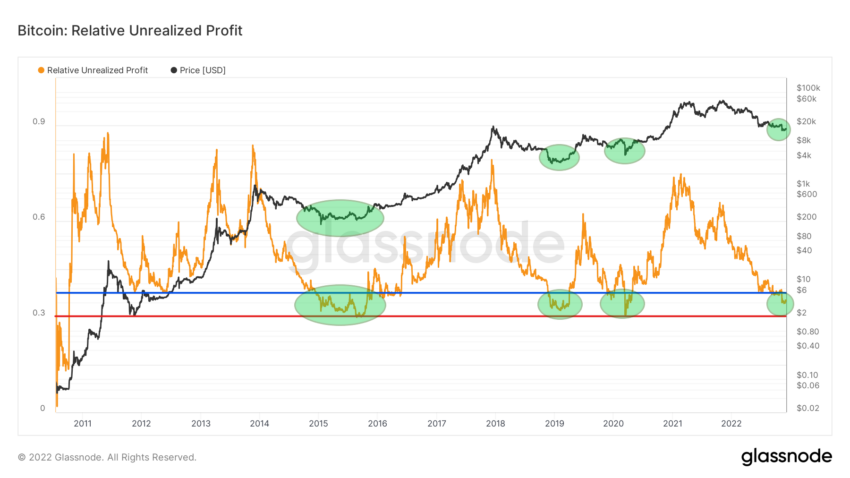
If we would like to use the former method, we should first consider the Relative Unrealized Profit indicator. Its definition is the total profit in USD of all existing coins whose price at realization time was lower than the current price normalized by the market capitalization.
On the long-term chart of relative unrealized profit, we see that the indicator has already reached lows comparable to previous bear markets. Indeed, it is not yet as low as the lows of late 2015 and the March 2020 crash (red line). However, it has already fallen below the 2011-2012 lows (blue line).
Moreover, we can see that whenever the relative unrealized profit was between these two lines (green areas), the Bitcoin price was in the process of generating a macro bottom, to which it never returned thereafter.

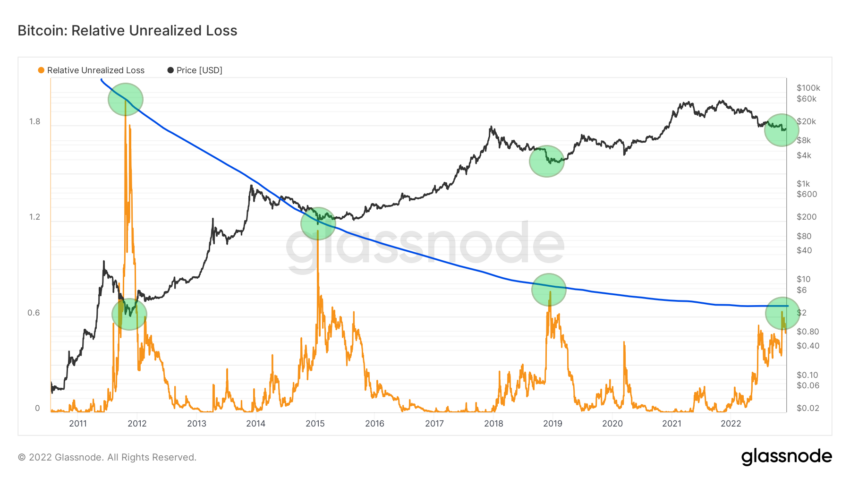
The second component of NUPL is the Relative Unrealized Loss indicator. As above, this is the total loss in USD of all existing coins whose price at realization time was higher than the current price normalized by market capitalization.
On its long-term chart, one can try to draw a logarithmic curve that connects past peaks (blue). Each peak of unrealized loss corresponds to the macro bottoms of successive bear markets in 2011, 2015 and 2018 (green areas). If the index has also now hit its peak – as the logarithmic curve suggests – then BTC may have already reached a bottom.

NUPL vs. Bear Market
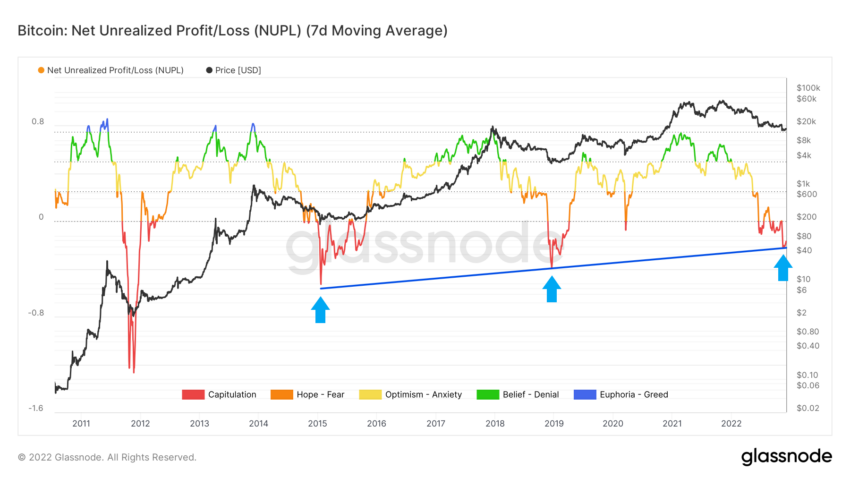
In the above analysis, we see that both components of NUPL today seem to be pointing to values correlated with the lows of historical bear markets. A similar conclusion can be reached by looking at the long-term chart of NUPL on its seven-day moving average (7MA).
By connecting the lowest values of the index for the two previous bear markets and the current value (blue arrows), we get an ascending support line (blue). Bitcoin could have reached the macro bottom of the current bear market at $15,476 on Nov. 21, 2022.

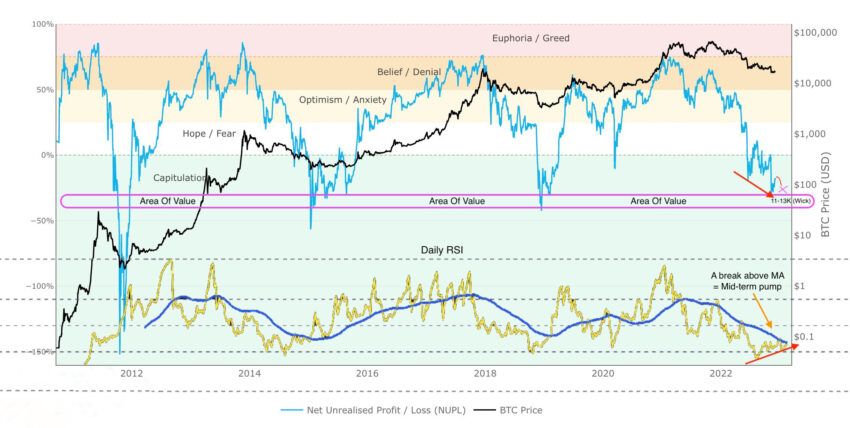
However, cryptocurrency trader @StreetTraderJPP suggested today that he expects another drop to the $13,000 area. In his analysis, he combined the NUPL chart with Bitcoin’s daily RSI. One of the signals of an upcoming trend reversal is the bullish divergence between the falling NUPL and the rising RSI (red arrows).
According to the analyst, an RSI breakout above the moving average (dark blue) will signal a midterm pump in BTC price. However, he predicts that before that, the Bitcoin price will briefly find itself in the pink “area of value” and shortly fall into the $11-13k range.

Edwards: “Deep Bitcoin Value”
Well-known cryptocurrency market analyst @caprioleio also recently published a chart of NUPL. However, he referred to its variant for long-term holders (LTH). Long-term holders are investors who hold Bitcoin for at least 155 days. Historically, their capitulation on the NUPL chart has been an additional confirmation of a bottom for the BTC price.
According to Edwards, in the current market conditions we have just such a situation. On his chart we see that LTH-NUPL has just reached the level of historical lows (pink line).
This leads him to conclude that “we are at a historic and rare deep value region.” So far, this situation has happened four times – always at the end of long-term bear markets.
Disclaimer: BeInCrypto strives to provide accurate and up-to-date information, but it will not be responsible for any missing facts or inaccurate information. You comply and understand that you should use any of this information at your own risk. Cryptocurrencies are highly volatile financial assets, so research and make your own financial decisions.
Disclaimer
In line with the Trust Project guidelines, this price analysis article is for informational purposes only and should not be considered financial or investment advice. BeInCrypto is committed to accurate, unbiased reporting, but market conditions are subject to change without notice. Always conduct your own research and consult with a professional before making any financial decisions. Please note that our Terms and Conditions, Privacy Policy, and Disclaimers have been updated.


