

Be[in]Crypto takes a look at Bitcoin (BTC) on-chain indicators, focusing this week on the Market-Value-To-Realized-Value (MVRV) and its cross into negative territory.
MVRV Z-Score
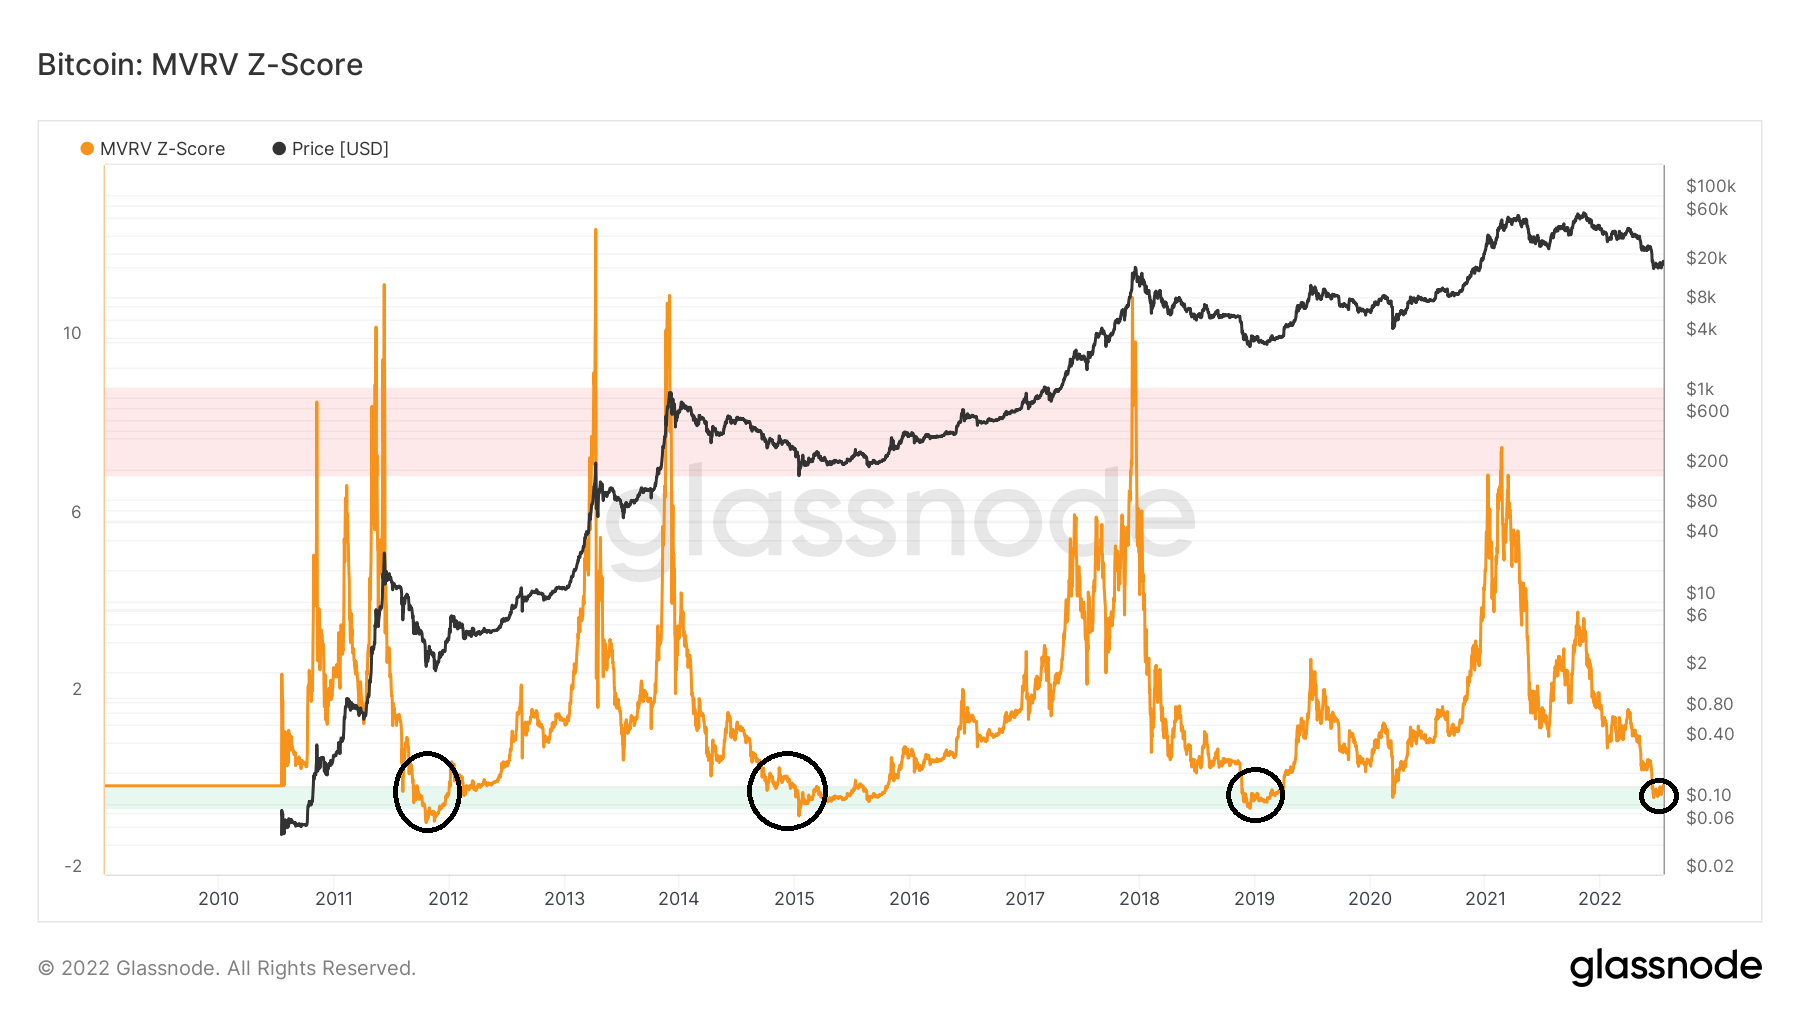
MVRV is an indicator that measures the ratio between the market and realized capitalization levels. Values higher than 1 show that the market cap is larger than the realized cap. The MVRV Z-score subsequently uses a standard deviation in order to normalize the values. So, negative values indicate that the market cap is smaller than the realized cap.
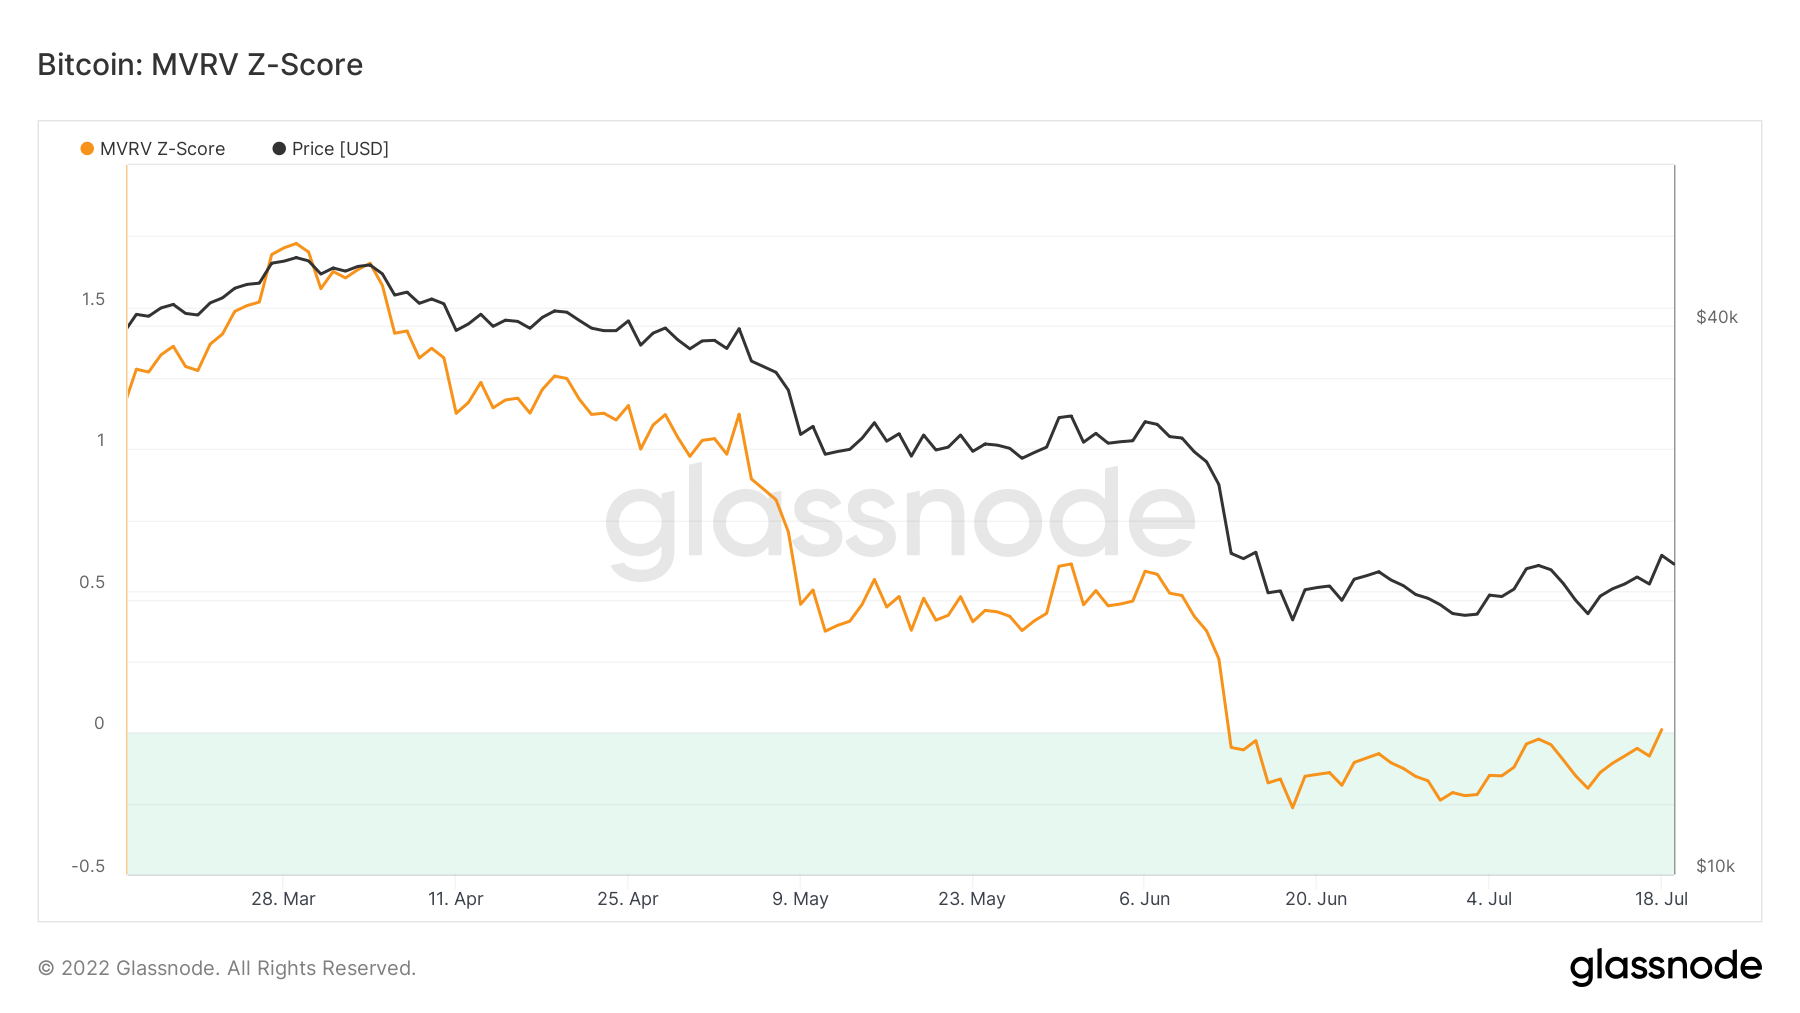
Historically, values between 7 and 9 have coincided with market cycle tops, while those below 0 with bottoms. The indicator has been decreasing since Oct.
Besides March 2020, the other times (black circles) in which the indicator crossed into negative territory required some time before the bottom was reached.
In 2012, the bottom was reached two months after the indicator first moved into negative territory.
In 2015, it was reached 12 days after the indicator first moved into negative territory. Finally, in 2018, it was reached roughly one month after the indicator first moved into negative territory.
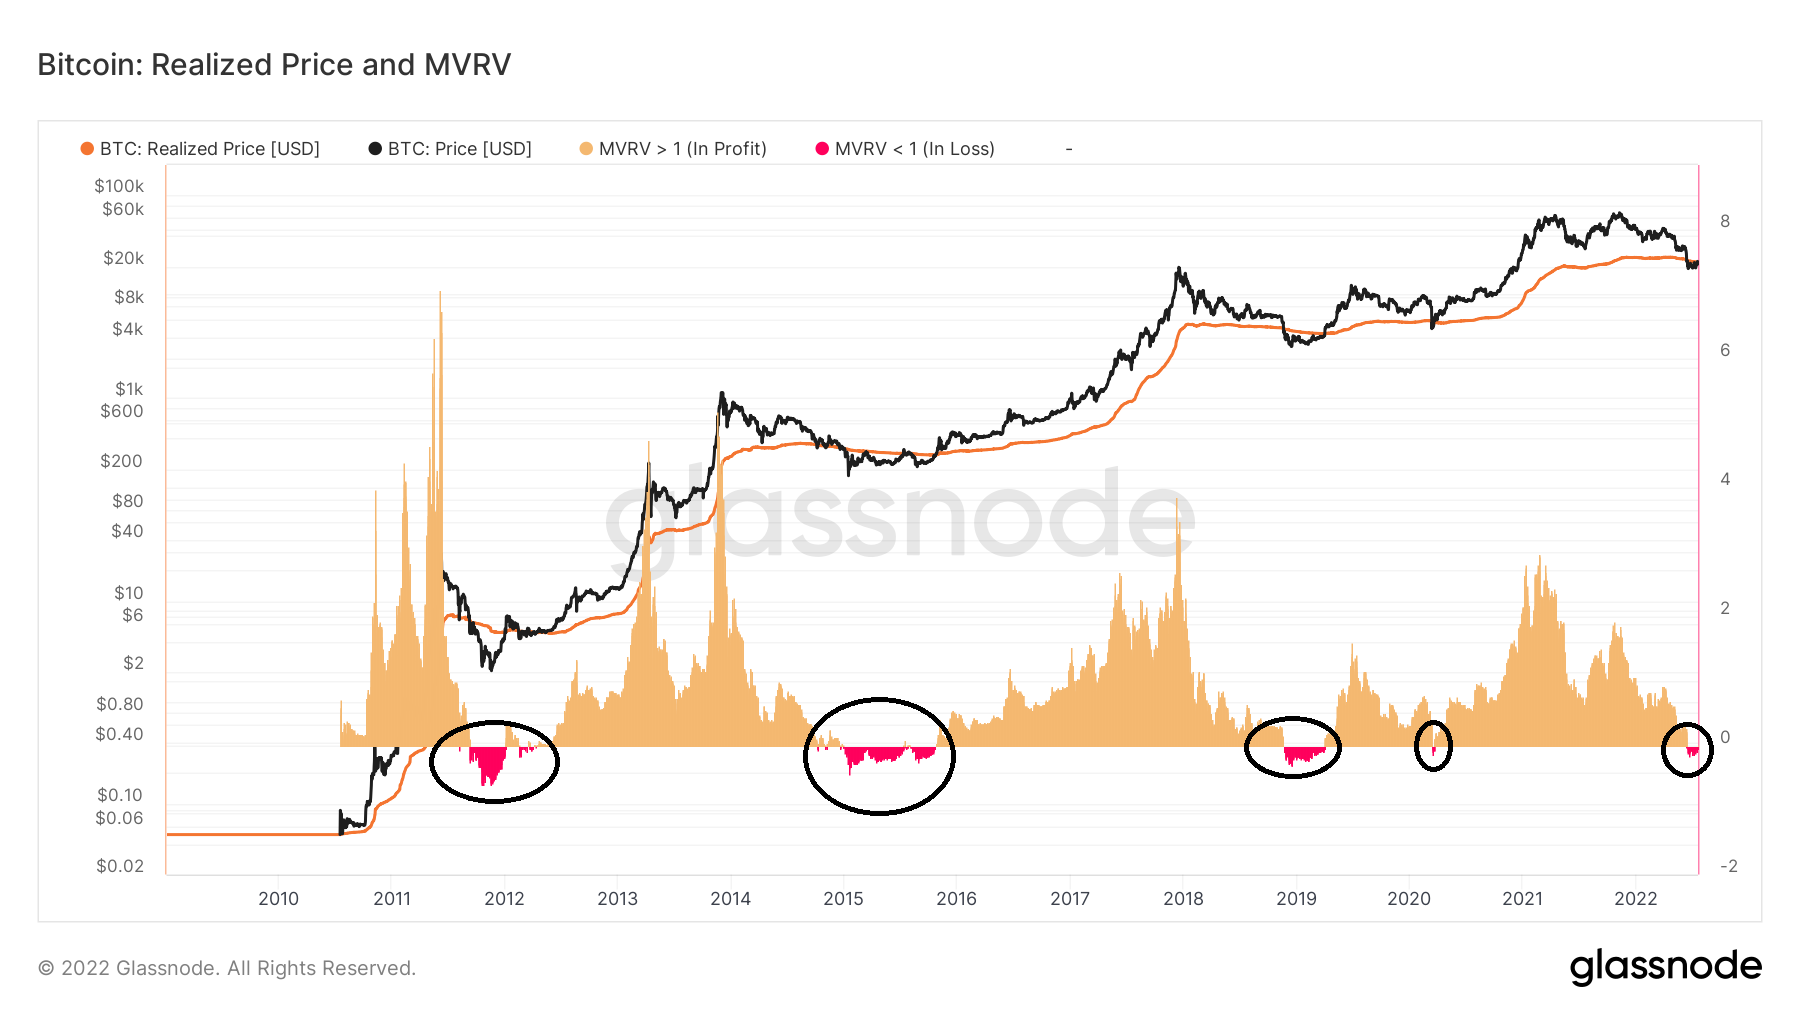
Days BTC MVRV is at a loss
The days in which MVRV is at a loss can be better visualized using the workbench. As can be seen by the black circles, times in which the BTC price falls below the realized price (orange line) are associated with negative readings in MVRV.
As outlined above, there have been four such times in the price history of BTC, with the ongoing decrease being the fifth one.
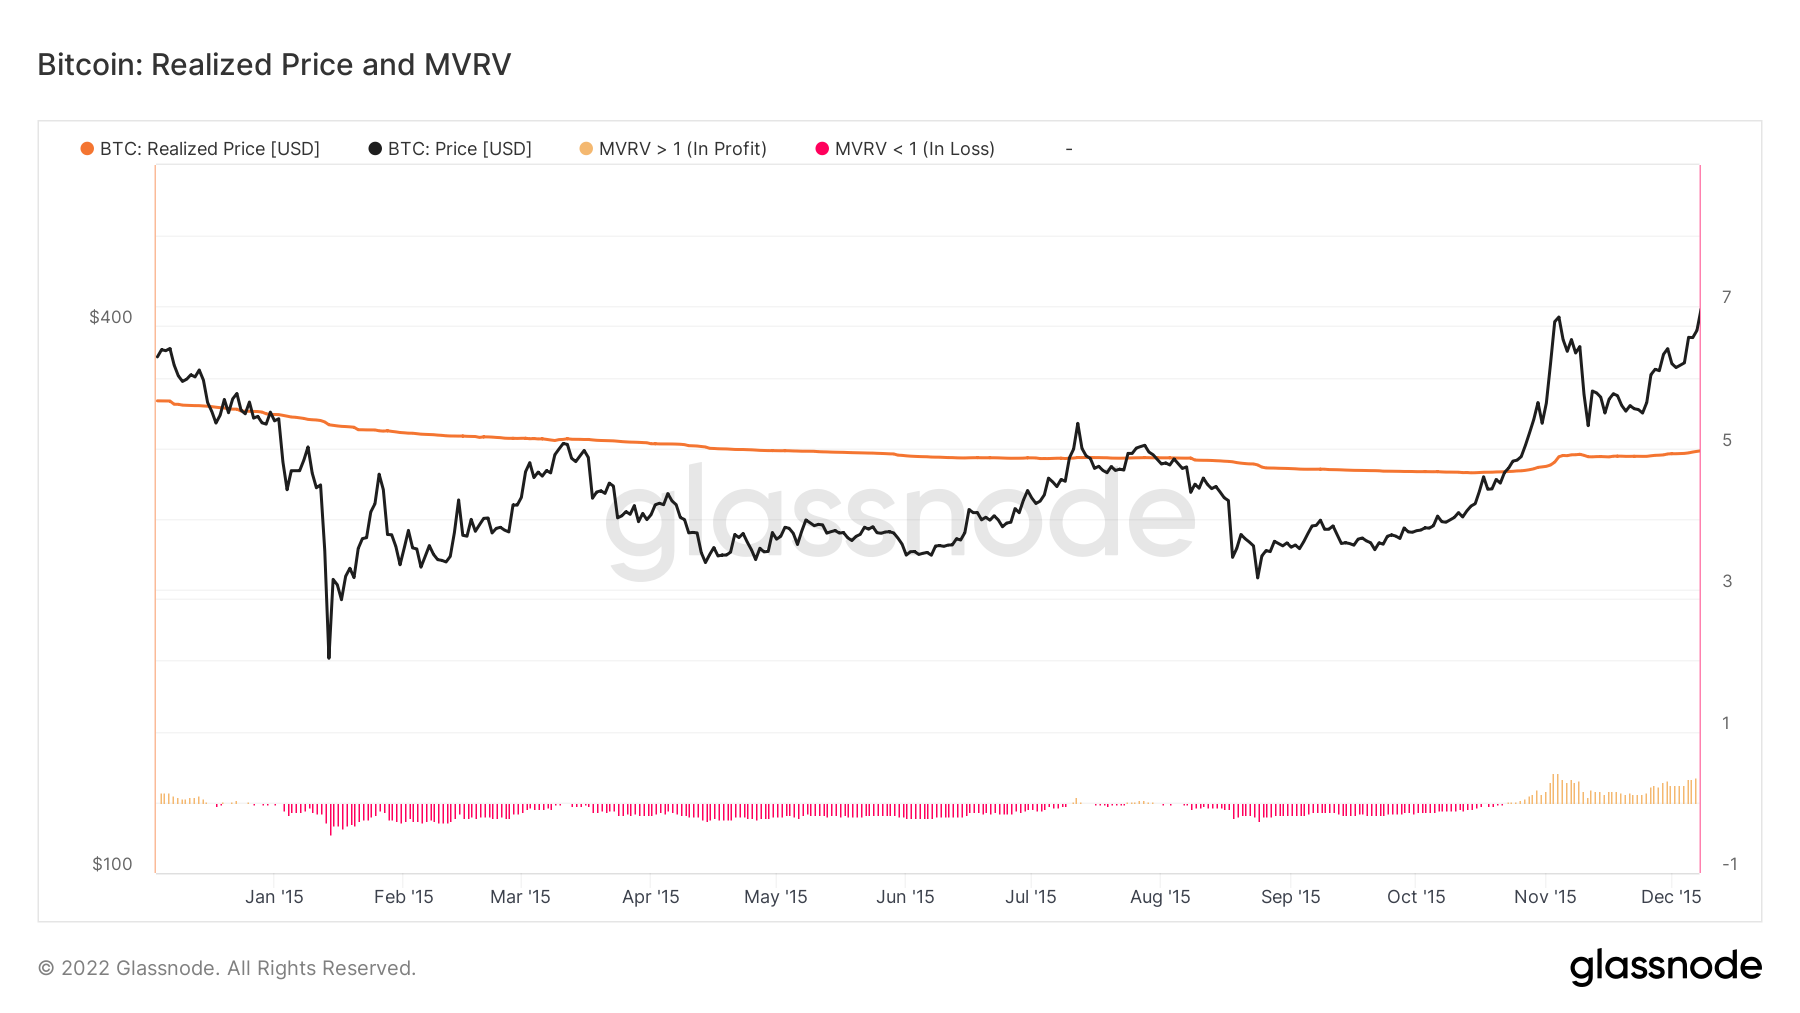
An interesting observation is that even when the bottom was reached shortly after the first cross, as was the case in 2015, it took a long time until MVRV moved back to positive territory. More specifically, the indicator moved into positive territory in Oct 2015, roughly 10 months after the first bearish cross.
However, while the BTC price consolidated below the realized price (orange), it still created higher highs and did not fall below the Jan 2015 price. Thus, while it took a while for BTC to initiate another upward movement, the bottom was reached fairly quickly after the first bearish cross.
For Be[in]Crypto’s latest Bitcoin (BTC) analysis, click here
Disclaimer
In line with the Trust Project guidelines, this price analysis article is for informational purposes only and should not be considered financial or investment advice. BeInCrypto is committed to accurate, unbiased reporting, but market conditions are subject to change without notice. Always conduct your own research and consult with a professional before making any financial decisions. Please note that our Terms and Conditions, Privacy Policy, and Disclaimers have been updated.
