

Be[in]Crypto takes a look at Bitcoin (BTC) on-chain indicators that relate to miners, more specifically, the difficulty ribbon compression and the Market Cap to Thermocap Ratio
Difficulty ribbon compressions
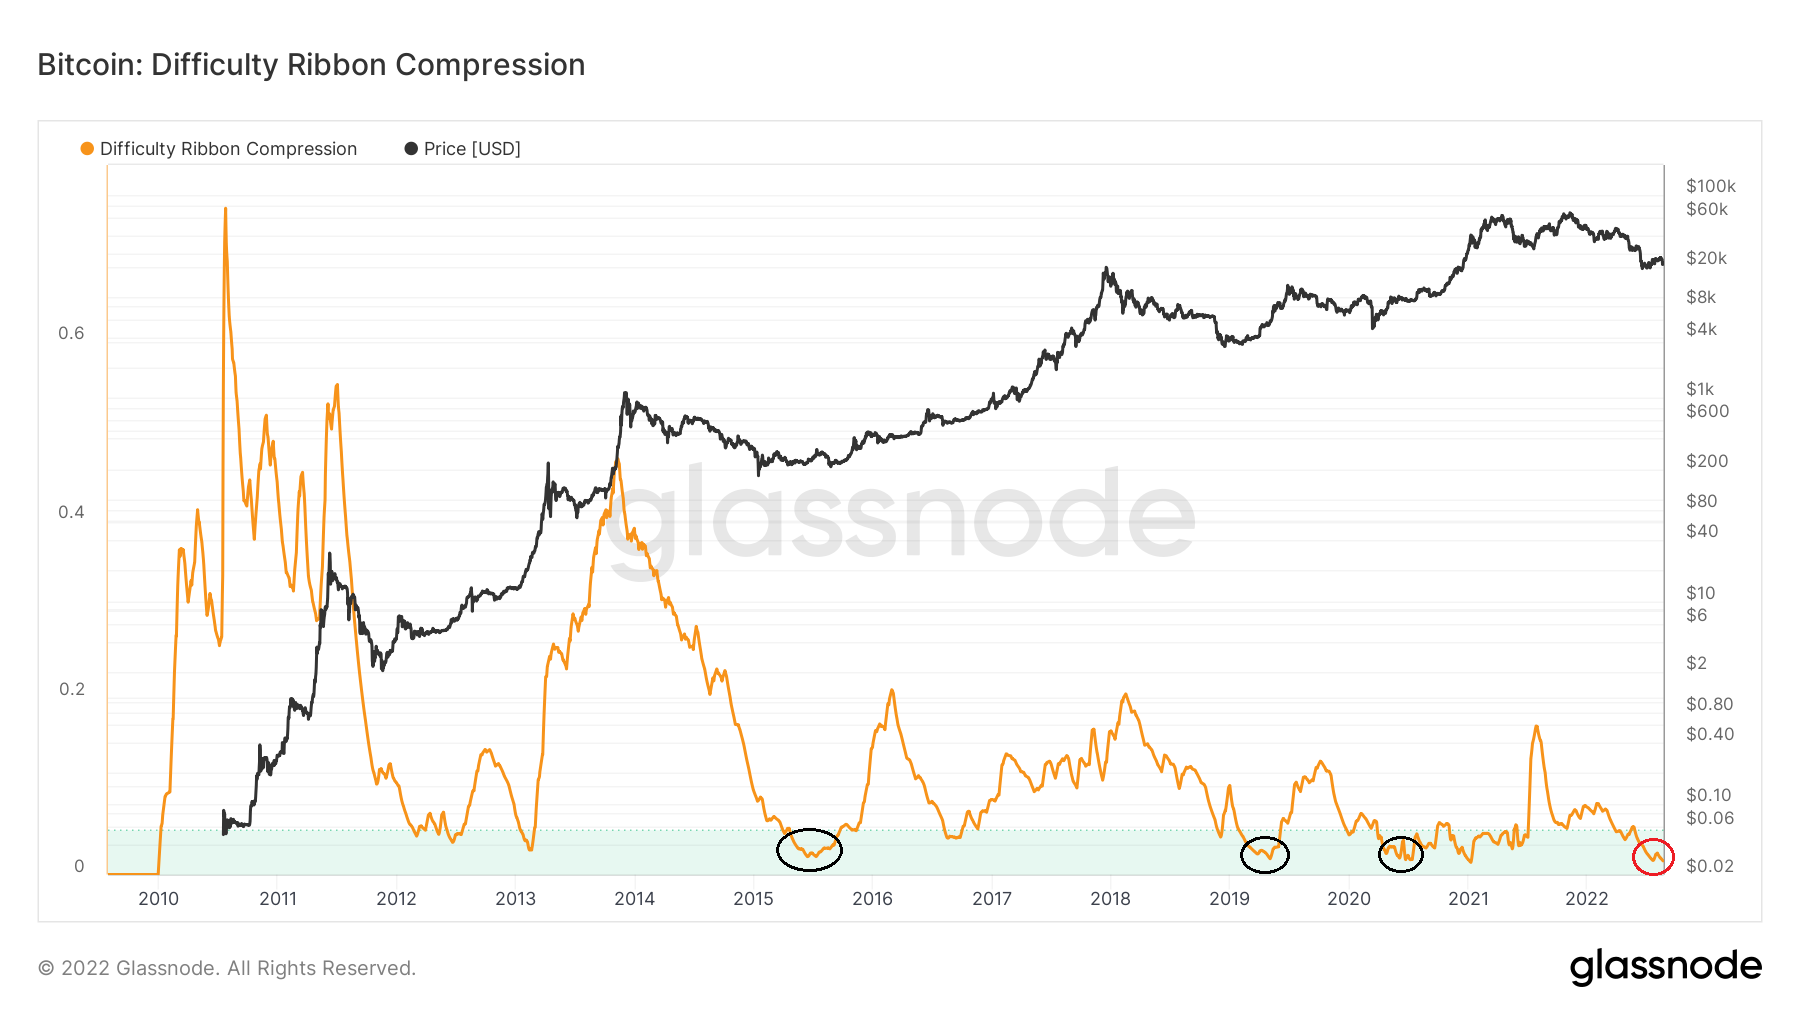
The difficulty ribbon is an on-chain indicator which uses moving averages (MA) of the Bitcoin mining difficulty. Next, the difficulty ribbon compression adds a standard deviation in order to better determine if the market is close to bottoming.
Historically, values between 0.01 and 0.02 have been associated with bottoms.
In 2022, the indicator crossed into oversold territory (<0.05) in May and is currently at 0.0153 (red circle) The only other time it as lower than this was in Jan 2021 at 0.0137.
However, all three previous market cycle bottoms (black circles) were reached at higher values.
More specifically, the 2015 bottom was reached at 0.024, the 2018 bottom was reached at 0.019 and the 2020 one at 0.020.
So, the difficulty ribbon compression indicator suggests that BTC is close to a bottom. This reading is also in line with other mining indicators such as the Puell Multiple and the Hash Ribbon.
BTC market cap to Thermocap ratio
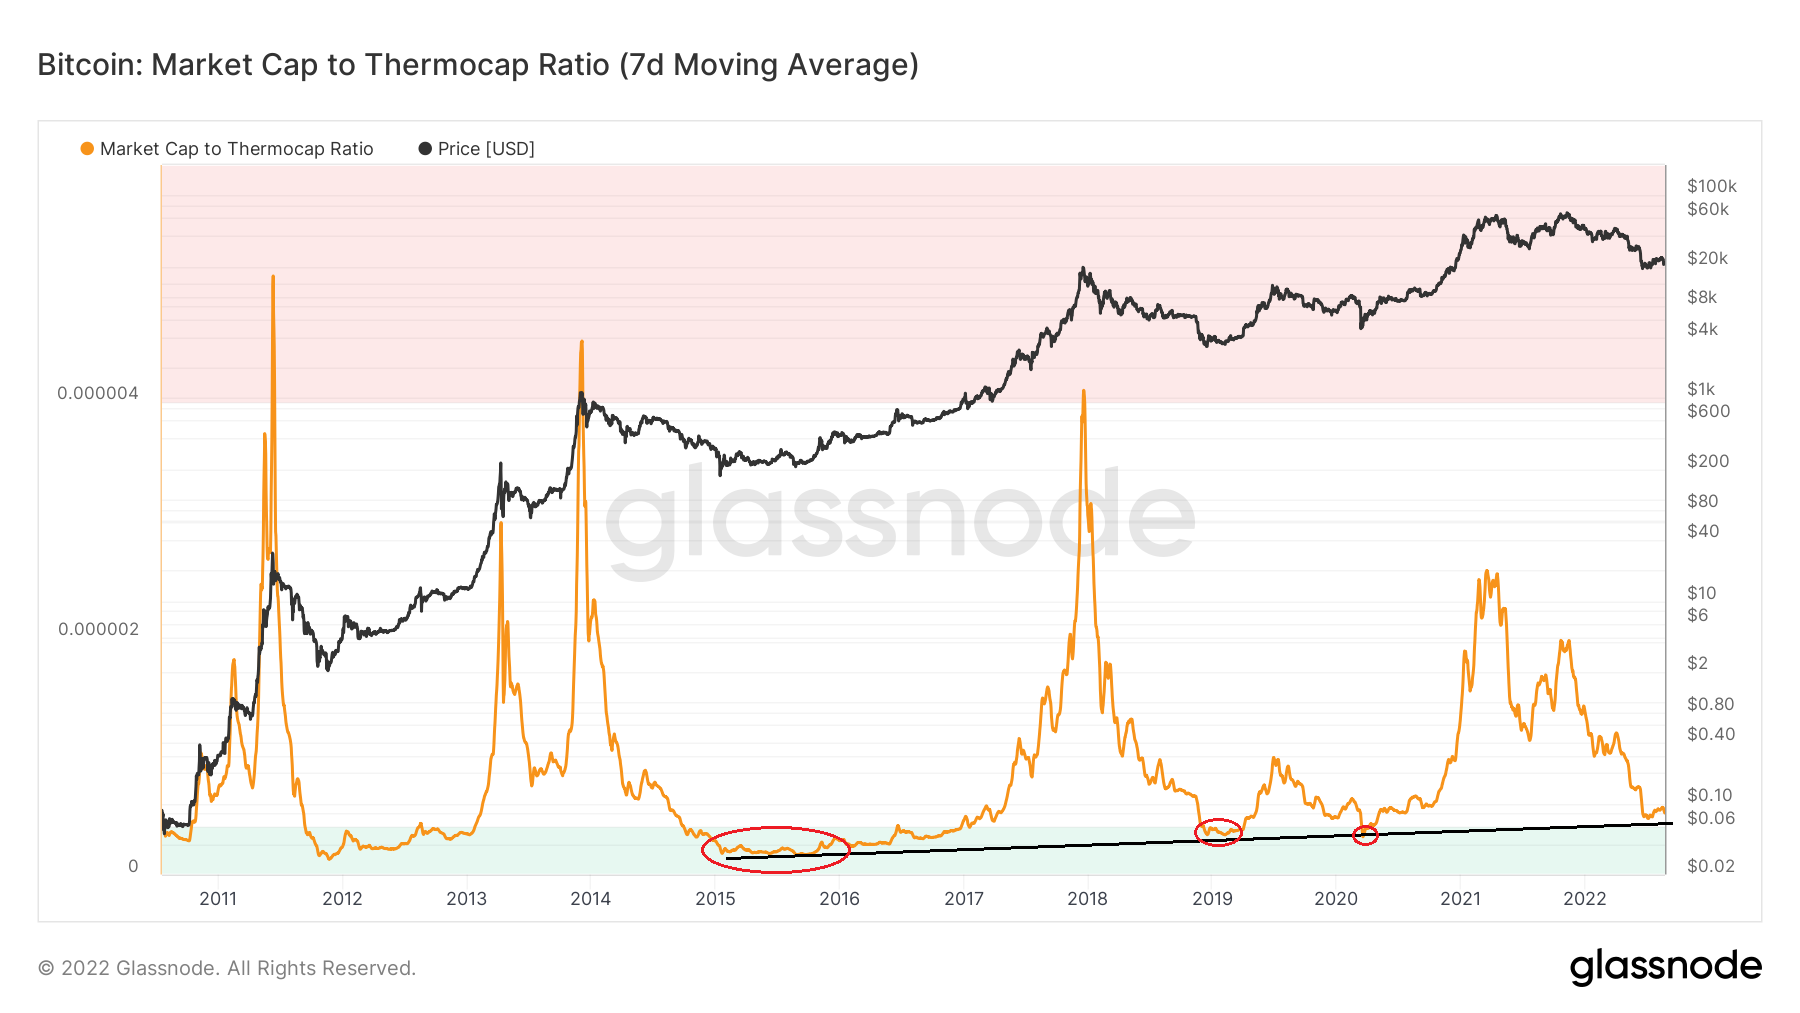
The Thermocap is the aggregated amount of coins that are paid to miners. It serves as a proxy to how much mining resources are spent. The Market Cap to Thermocap Ratio is created by dividing the market cap by the thermocap. It is used to determine if the price is oversold or overbought relative to the total security spend by miners.
Indicator values below 0.0000004 are considered oversold. Historically, every bottom has been reached below this level (red circle). Currently, the indicator is giving a reading of 0.00000056, which is above this oversold area.
However, it is possible to draw an ascending support line that connects the previous bottoms. In this case, the indicator has bounced at this support line once more. This alternate reading supports the possibility that a bottom has been reached.
If correct, the indicator will bounce at this support line and reverse its current bearish trend.
For Be[in]Crypto’s latest Bitcoin (BTC) analysis, click here
Disclaimer
In line with the Trust Project guidelines, this price analysis article is for informational purposes only and should not be considered financial or investment advice. BeInCrypto is committed to accurate, unbiased reporting, but market conditions are subject to change without notice. Always conduct your own research and consult with a professional before making any financial decisions. Please note that our Terms and Conditions, Privacy Policy, and Disclaimers have been updated.
