BeInCrypto takes a look at Bitcoin (BTC) on-chain indicators that relate to lifespan, more specifically the liveliness indicator.
Bitcoin liveliness
Liveliness is an indicator that shows the age of BTC that is being spent. It gives values between 0 and 1. Values closer to one suggest that old coins are on the move, while those closer to 0 suggest that young coins are being transacted.
On-chain Bitcoin (BTC) analyst @kenoshaking noted an interesting observation about the periods of time that liveliness values plateau.
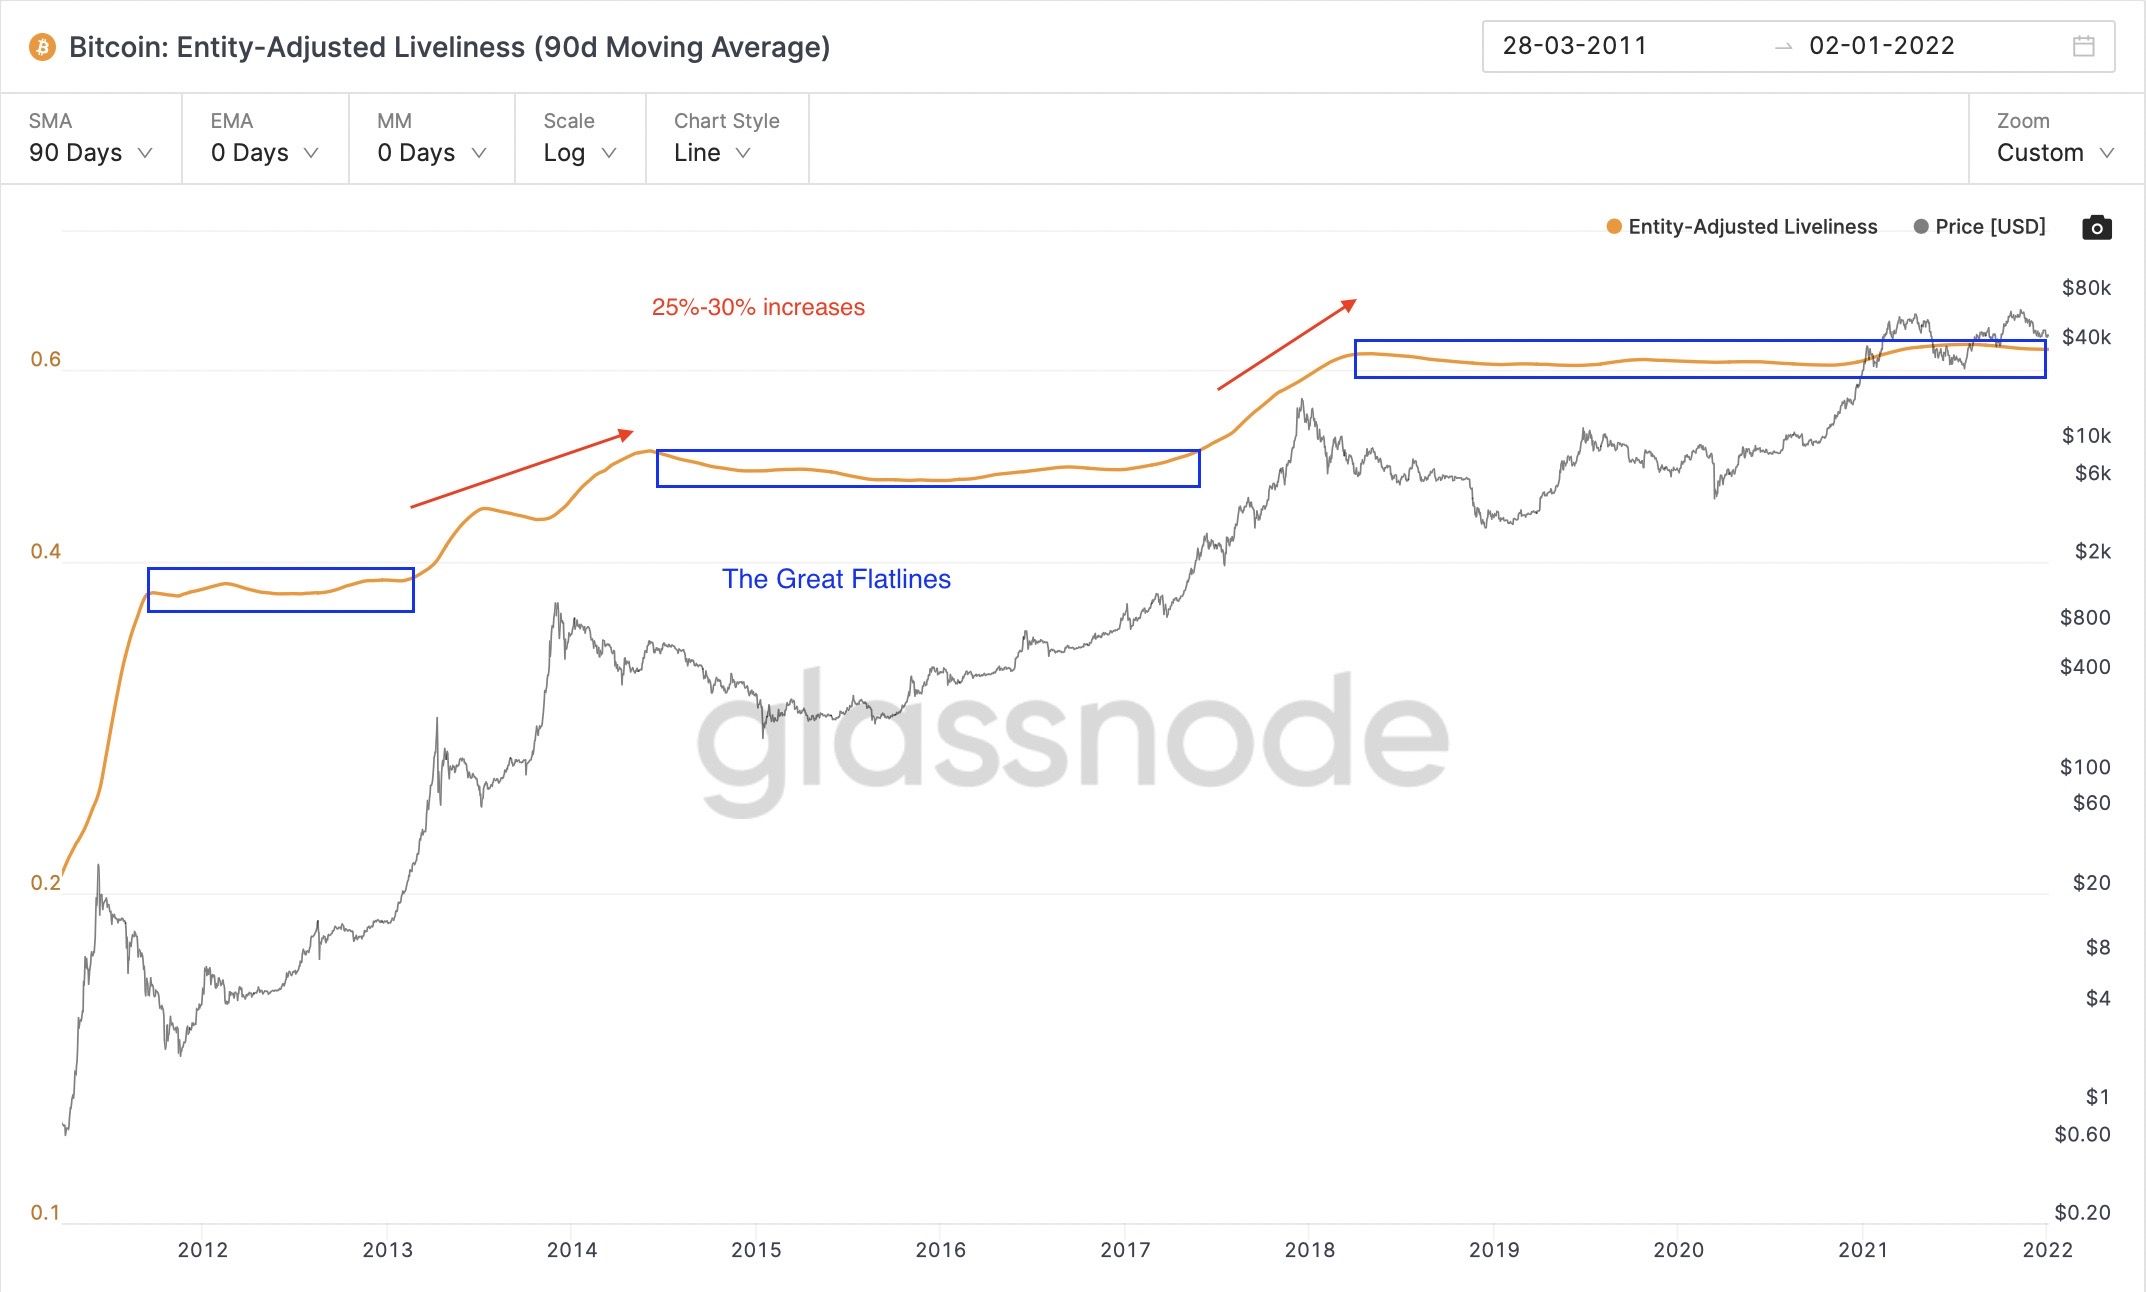
There is an initial increase in the indicator, meaning that long-term holders are liquidating their positions. This often occurs during the beginning of bull markets when BTC price rallies become parabolic (red lines).
Afterward, the indicator decreases very slowly for a considerable period of time (black line). This means that long-term holders are accumulating in anticipation of the next upward move.
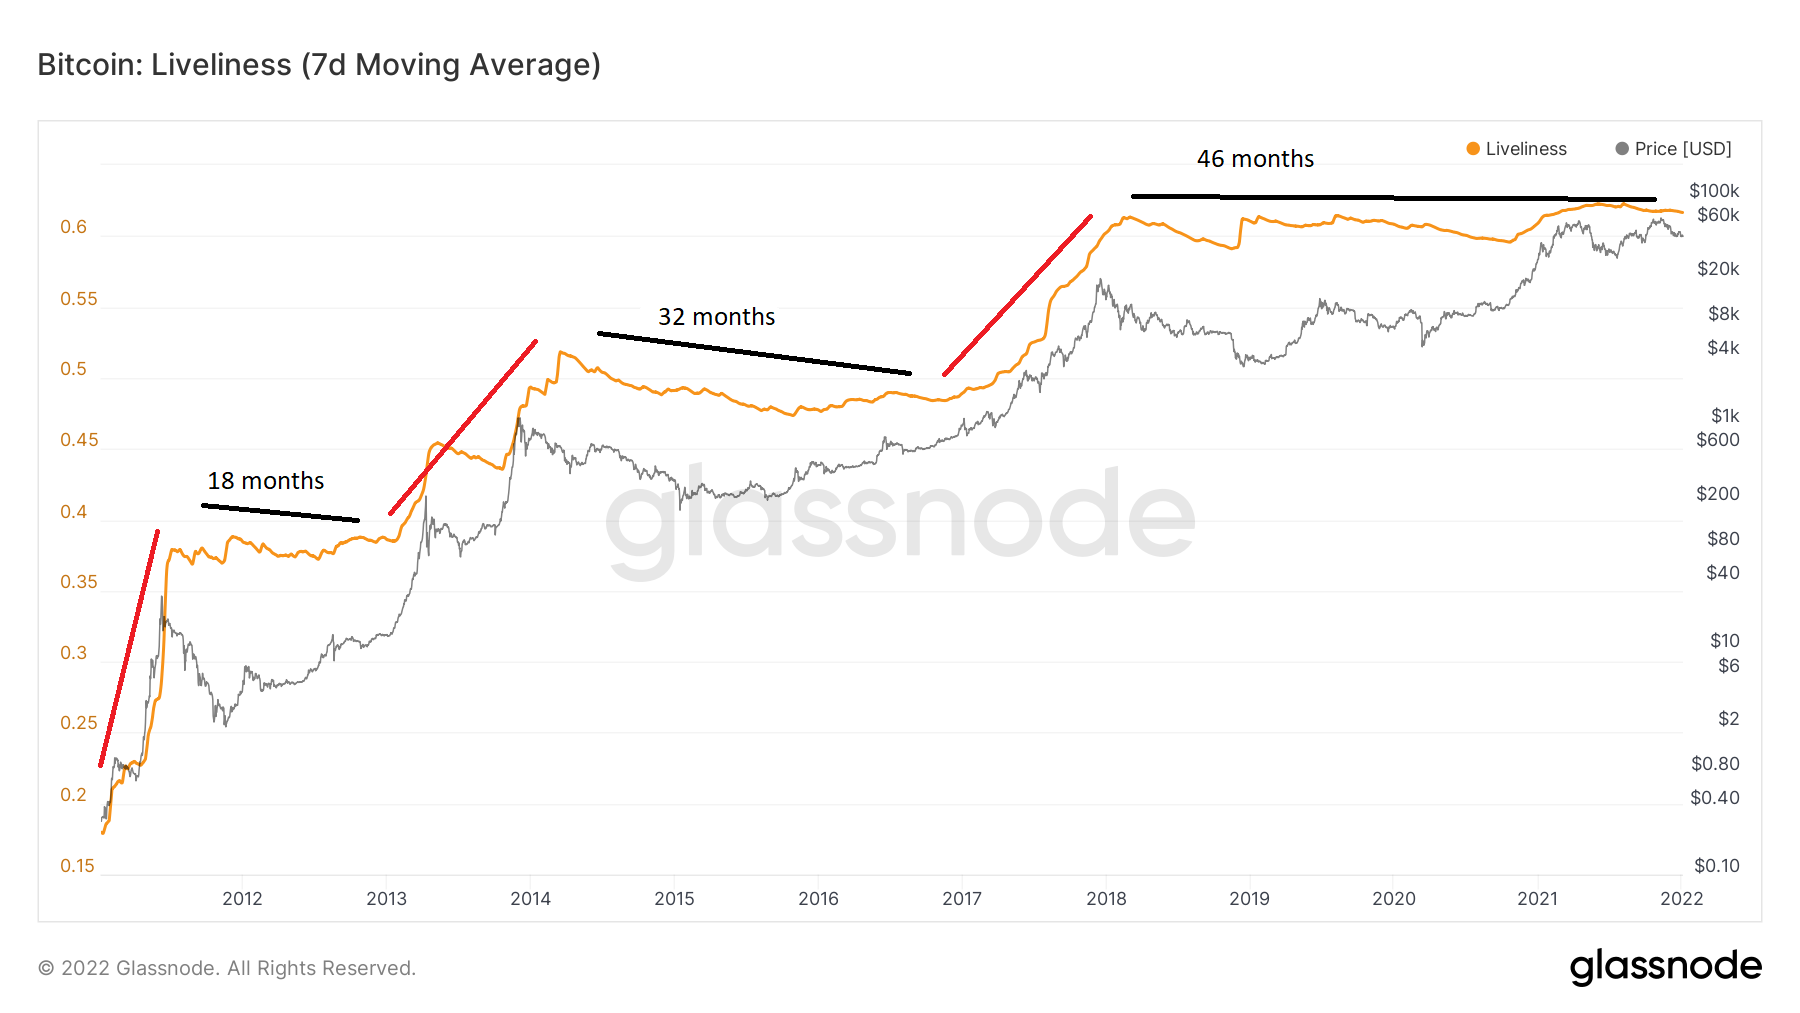
Interestingly, these accumulation cycles have become longer each time they transpire.
The first such cycle lasted for 18 months, while the second one went on for 32 months. The third and current cycle is still ongoing.
In February 2018, liveliness gave a reading of 0.62. This occurred just after the then all-time high of December 2017. Since then, the indicator has hovered between 0.62 and 0.58, and is currently at 0.61. Therefore, over the past 46 months, liveliness has decreased very gradually.
When compared to the previous cycles, it could mean that the true parabolic move in the BTC price in which long-term holders take profit has not even begun yet.
Short-term reading
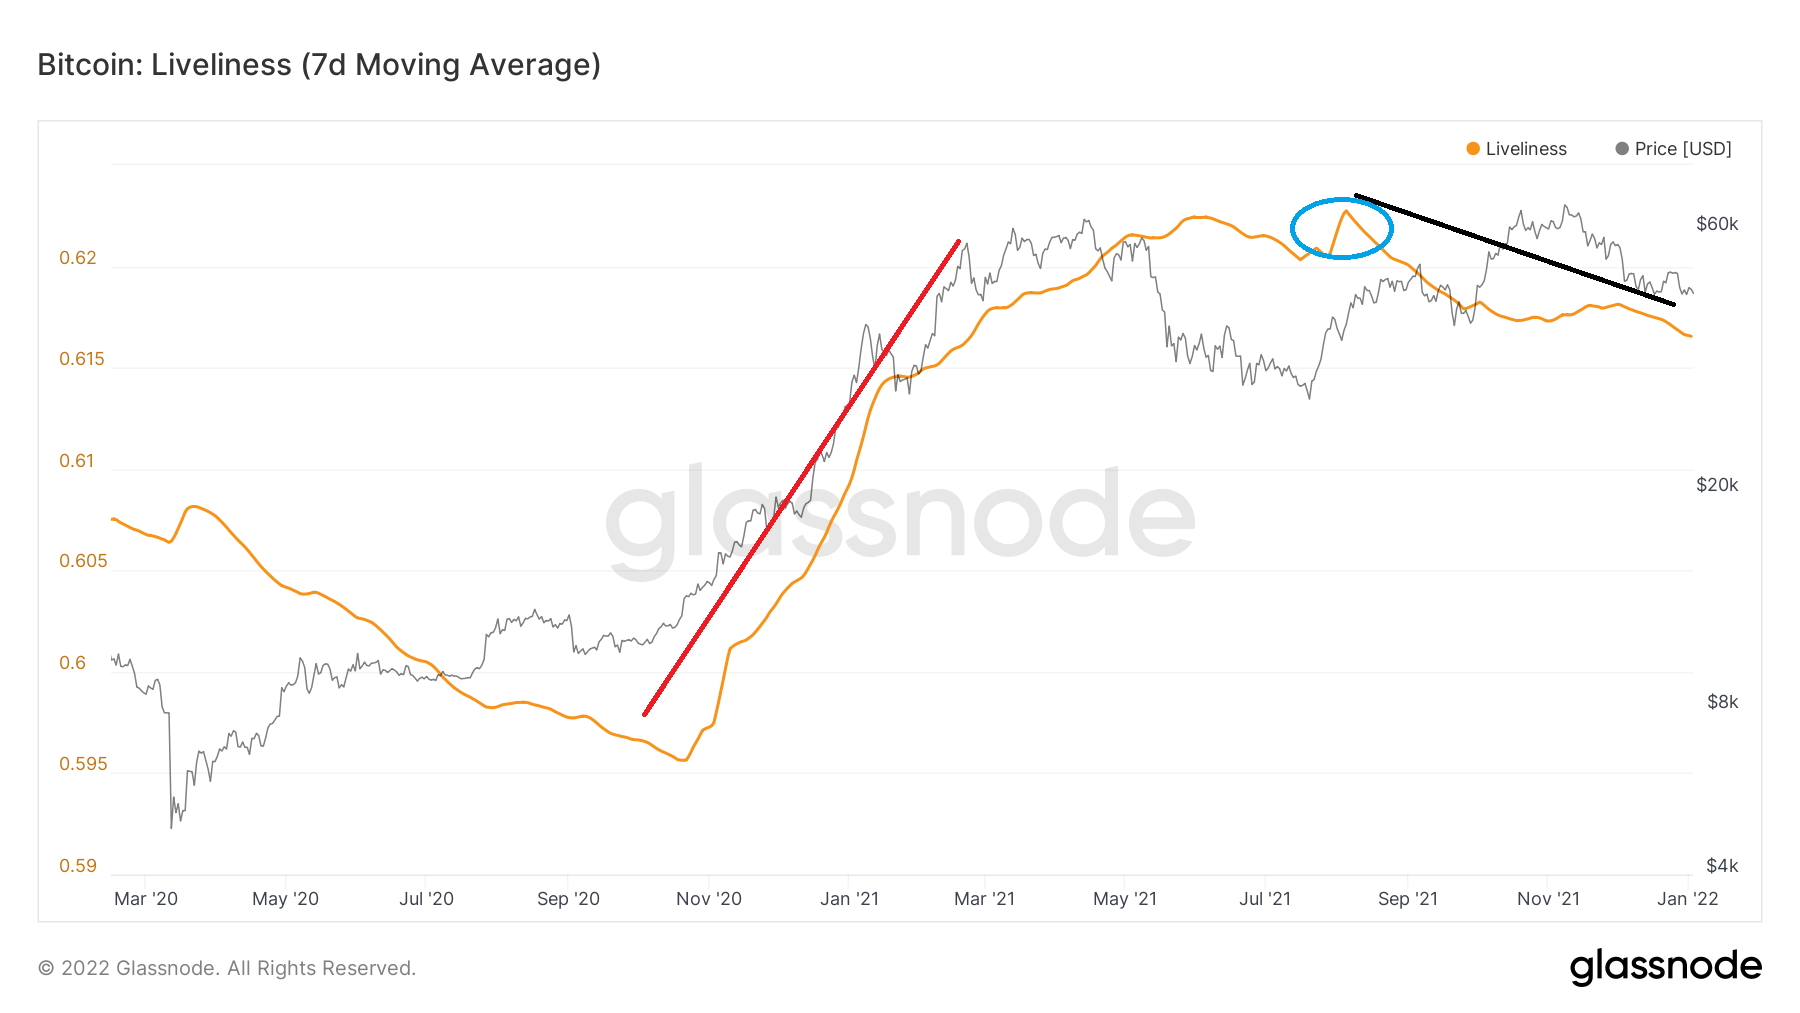
In the period between October 2020 and August 2021, liveliness increased from 0.59 to 0.62, the biggest increase since the aforementioned February 2018 high.
On Aug 5, 2020, it reached a new all-time high value of 0.6225 (blue circle) and the indicator has been decreasing since.
Going by historical values, it would be possible that this was the beginning of the parabolic upward move, while the current decrease is the accumulation phase.
Therefore, it could just be part of a longer-term cycle that has been repeating since 2011.