
A look at on-chain indicators for Bitcoin (BTC). The HODL Wave is analyzed with the purpose of determining the lifespan of coins that have been transacted over the past few months.
The indicator shows accumulation from medium/long-term holders. At the same time, a significant decrease is seen in short-term activity.
HODL Wave
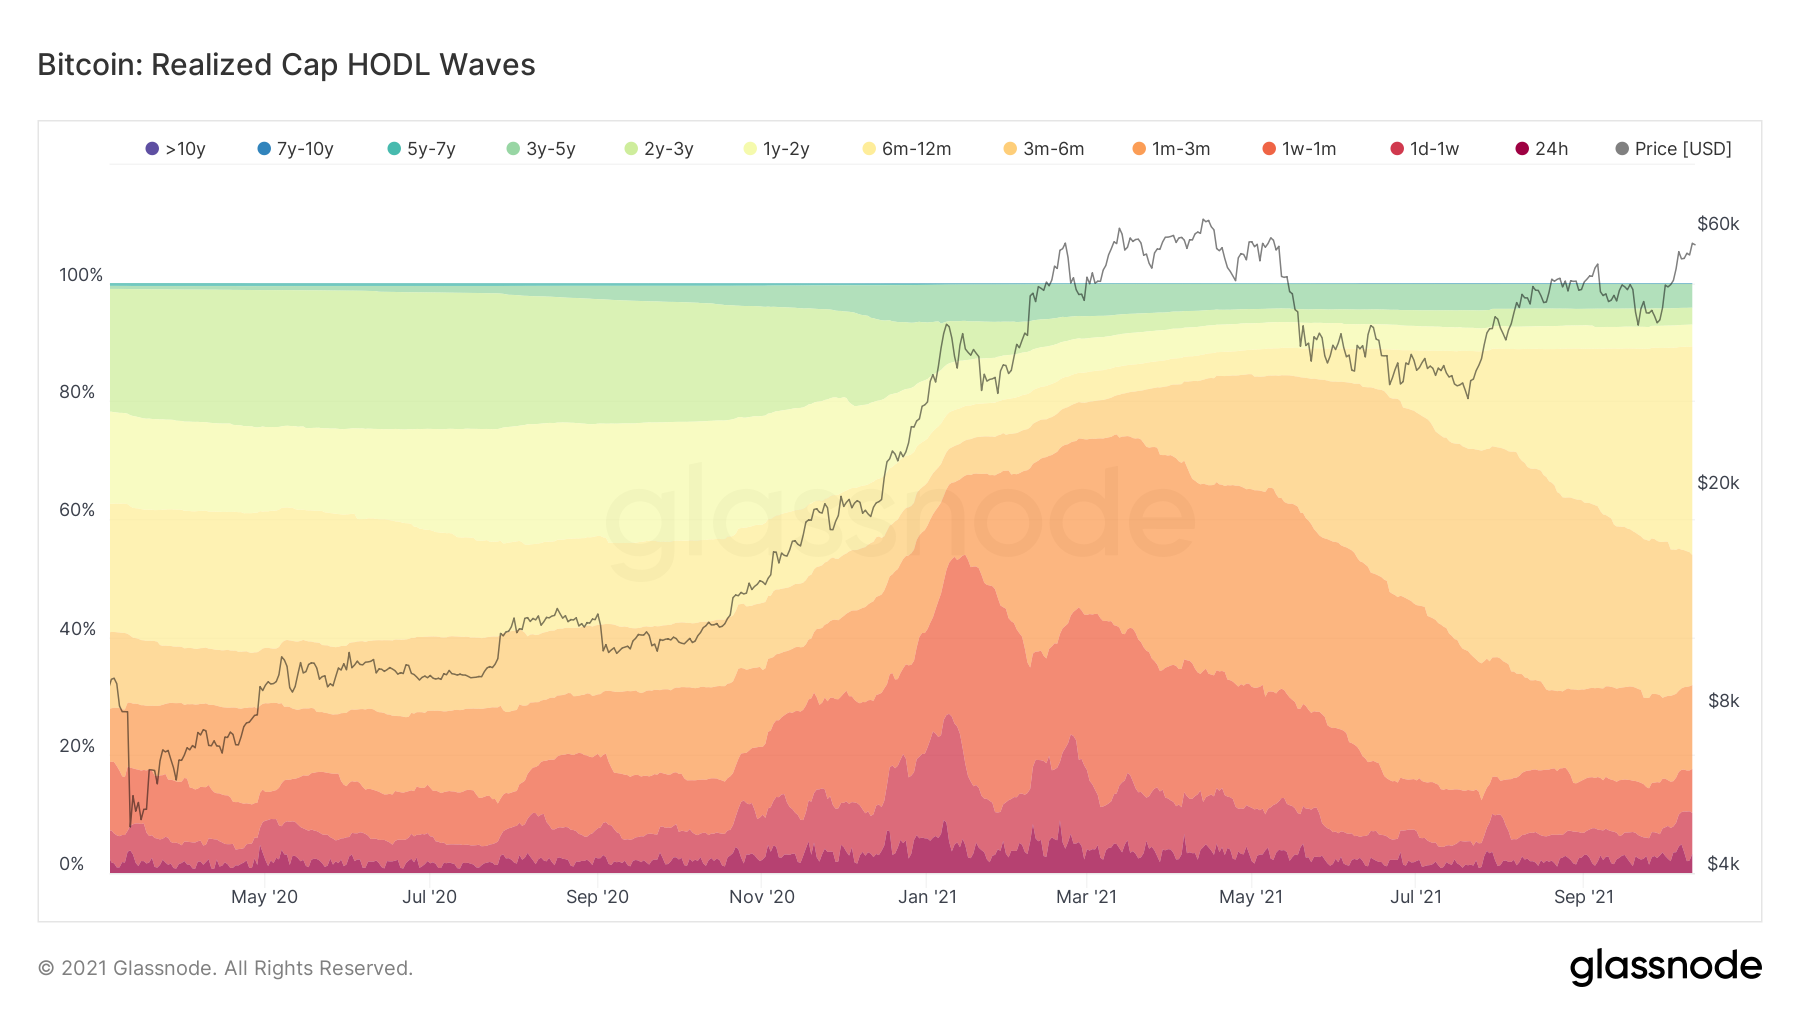
The HODL wave shows that the percentage of BTC that has moved in a specified time-frame. Warm colors (red, orange, yellow) represent BTC that have moved recently, while cold ones (yellow, green, blue) shows BTC that has not transacted in a while.
For example, if the 1-3 month HODL wave has a magnitude of 10%, it means that 10% of the total supply of BTC moved between 6 and 12 months earlier.
Interesting developments
The two most interesting developments when looking at the indicator are:
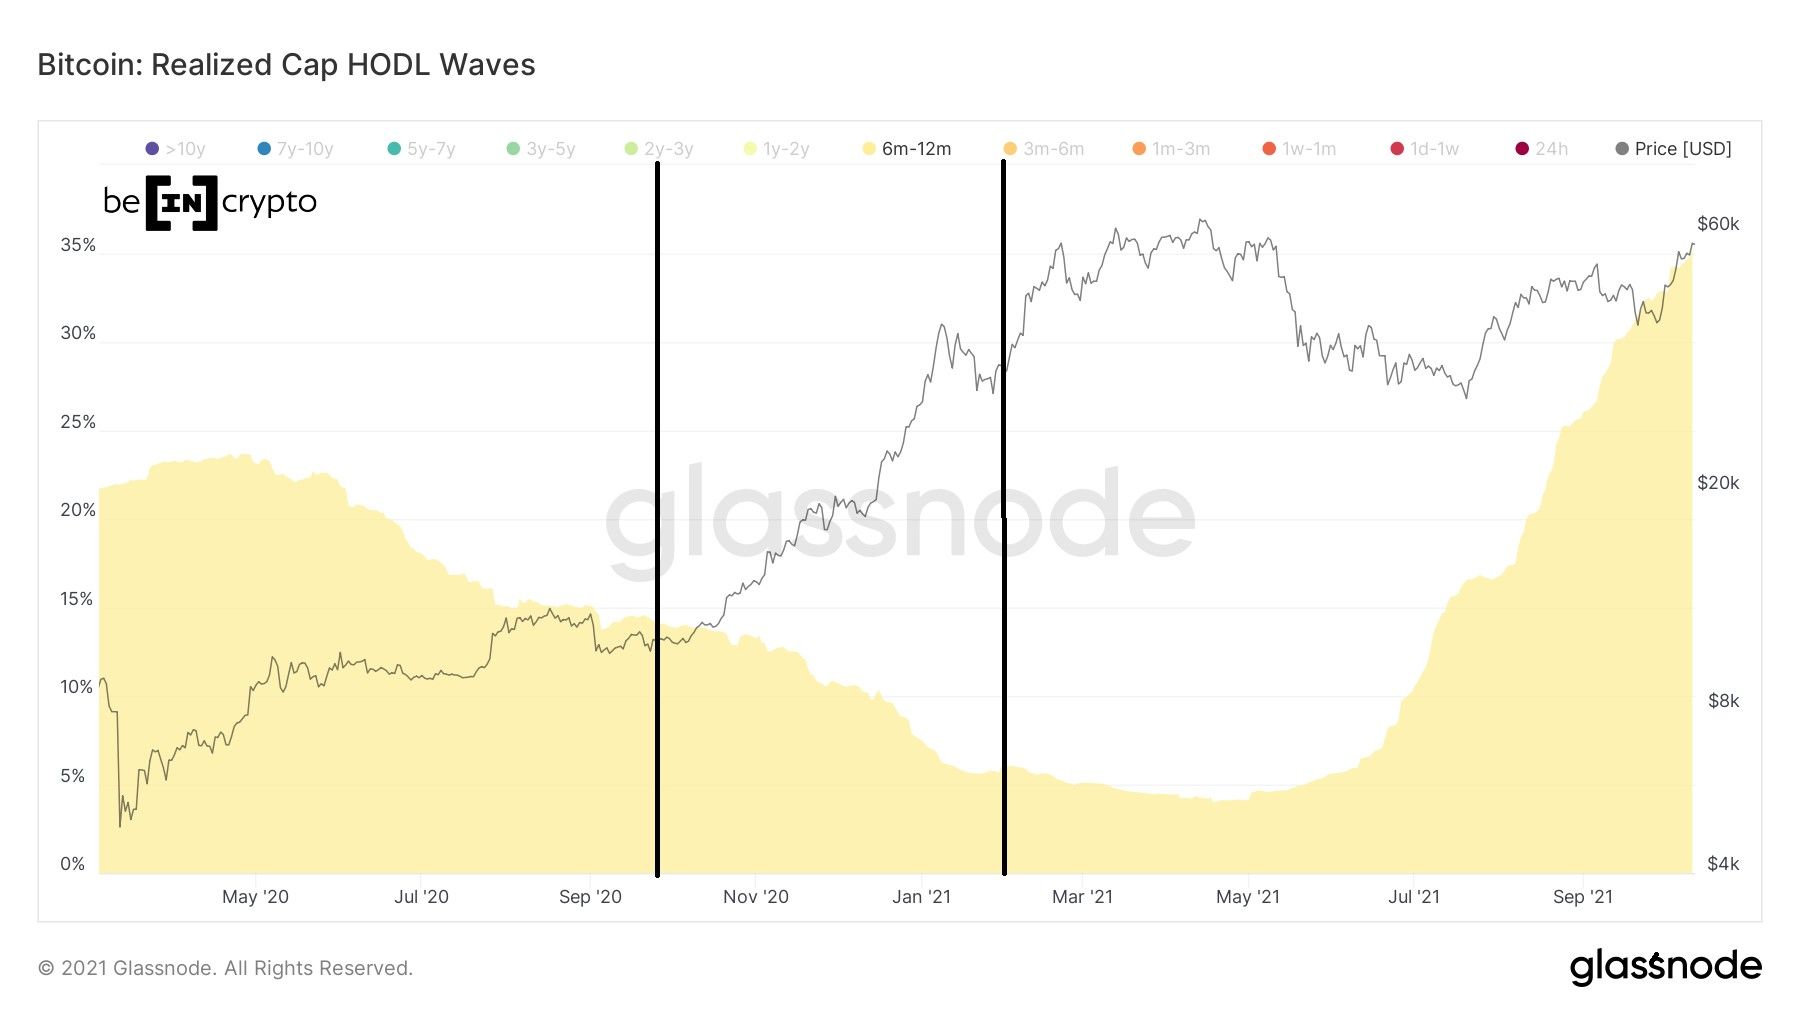
- An increase in the 6 month – 12 month band
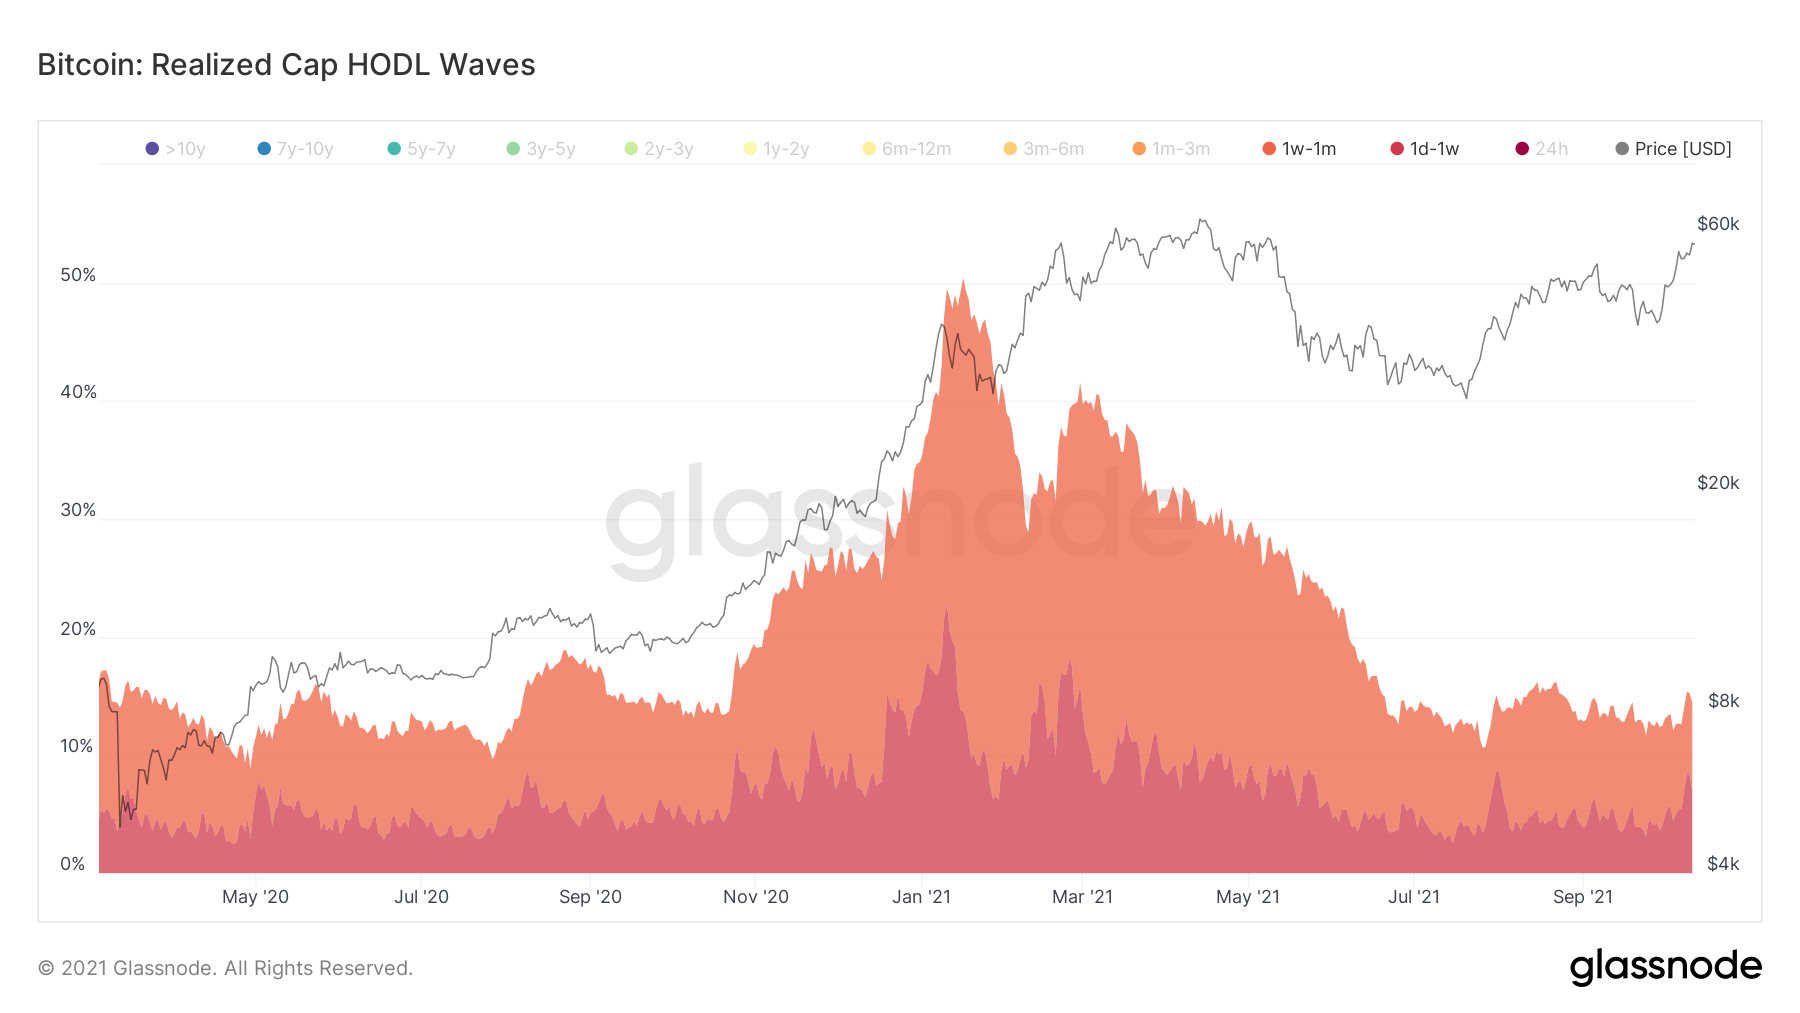
- A decrease in short-term bands (less than one month)
The 6-12 month band is currently at a yearly high of 35%. This means that 35% of the total supply of BTC last moved between 6 and 12 months, more specifically in the period between Oct 2020 to April 2021.
The swelling of this band means that buyers from those levels are still holding, and have not realized profits if they were early buyers. Furthermore, those that bought close to the April all-time high are not selling at a loss either, hence the increase in the bands.
Inside the same time-frame, we can see that the waves between one day and one month are decreasing. They peaked on Jan 2021 and has been moving downwards since, reaching a local low in July.
Increased activity from short-term holders is a sign of market tops. Therefore, the decrease in short-term activity combined with the increase in the 6 -12 month bands is a sign of accumulation prior to potentially another bull run.
An image that shows all bands in this same time-frame is presented below.
For BeInCrypto’s latest Bitcoin (BTC) analysis, click here.
What do you think about this subject? Write to us and tell us!
