


Bitcoin (BTC) has been struggling to move above the $59,500 area for the past seven days.
Bitcoin is expected to eventually break out from this resistance and gradually move towards a new all-time high.
Bitcoin consolidates
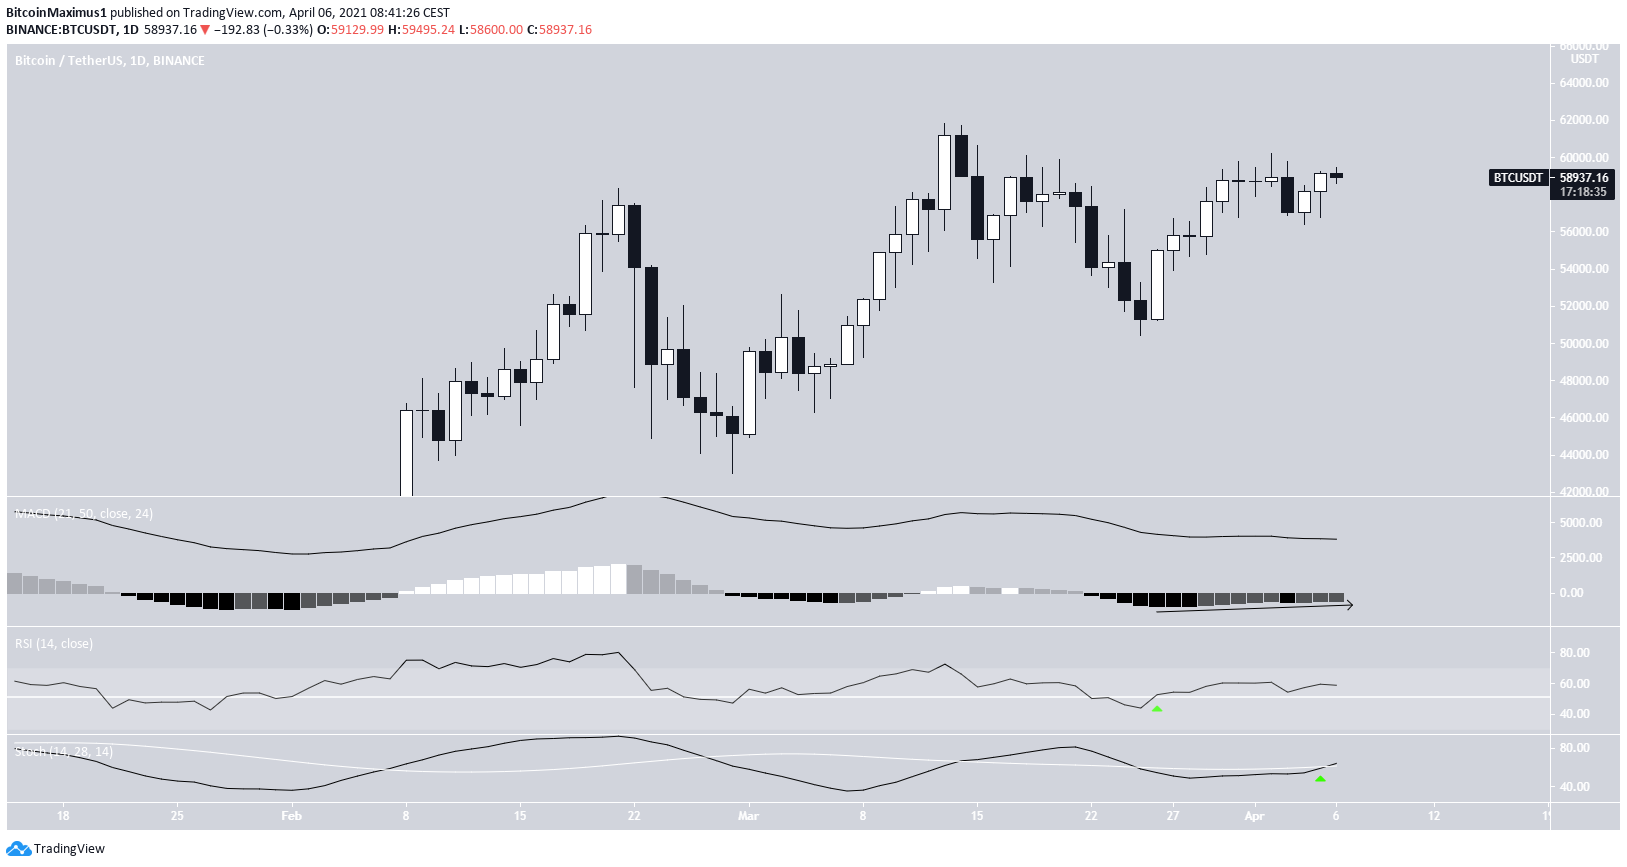
BTC has been increasing since bouncing on March 25. While the increase has been significant, BTC has stalled near the $60,000 level. It’s been struggling to move above it since March 30.
However, technical indicators are bullish. The MACD has given a bullish reversal signal, the RSI has crossed above 50, and the Stochastic oscillator has made a bullish cross.
Therefore, BTC is expected to eventually break out from this minor resistance level.
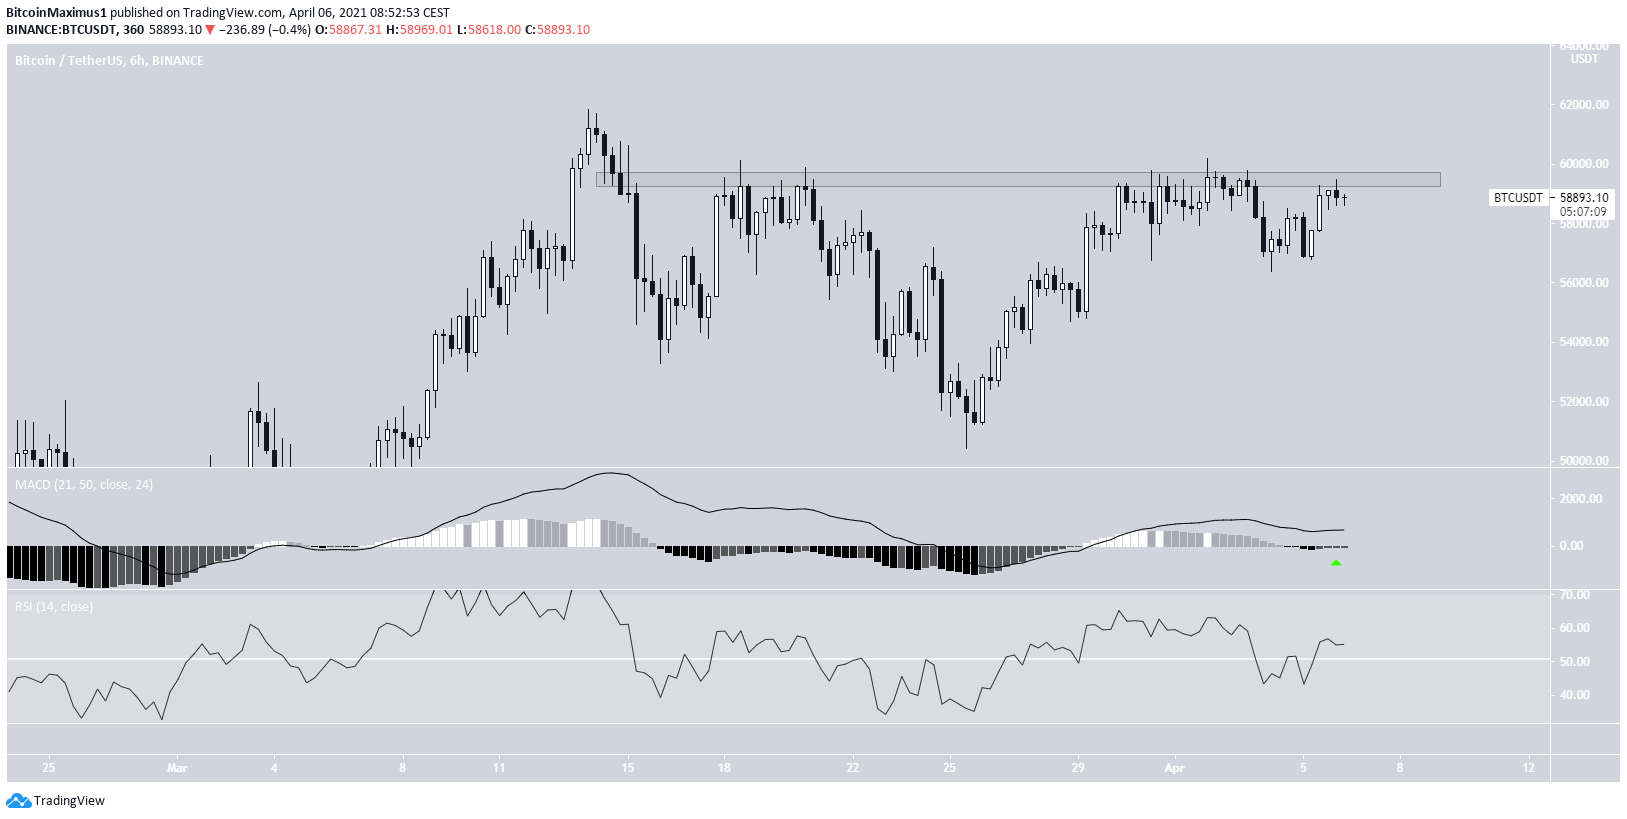
The short-term chart supports this scenario. It clearly shows the resistance level at $59,500, which has been tapped five times since March 18.
The more times a resistance level gets touched, the weaker it becomes. Therefore, a breakout from this area is expected.
Similar to the daily time-frame, the potential breakout is also supported by the six-hour RSI and MACD.
It’s still unclear if BTC will decrease in the short-term prior to the breakout, or if it will do so swiftly.
Wave count
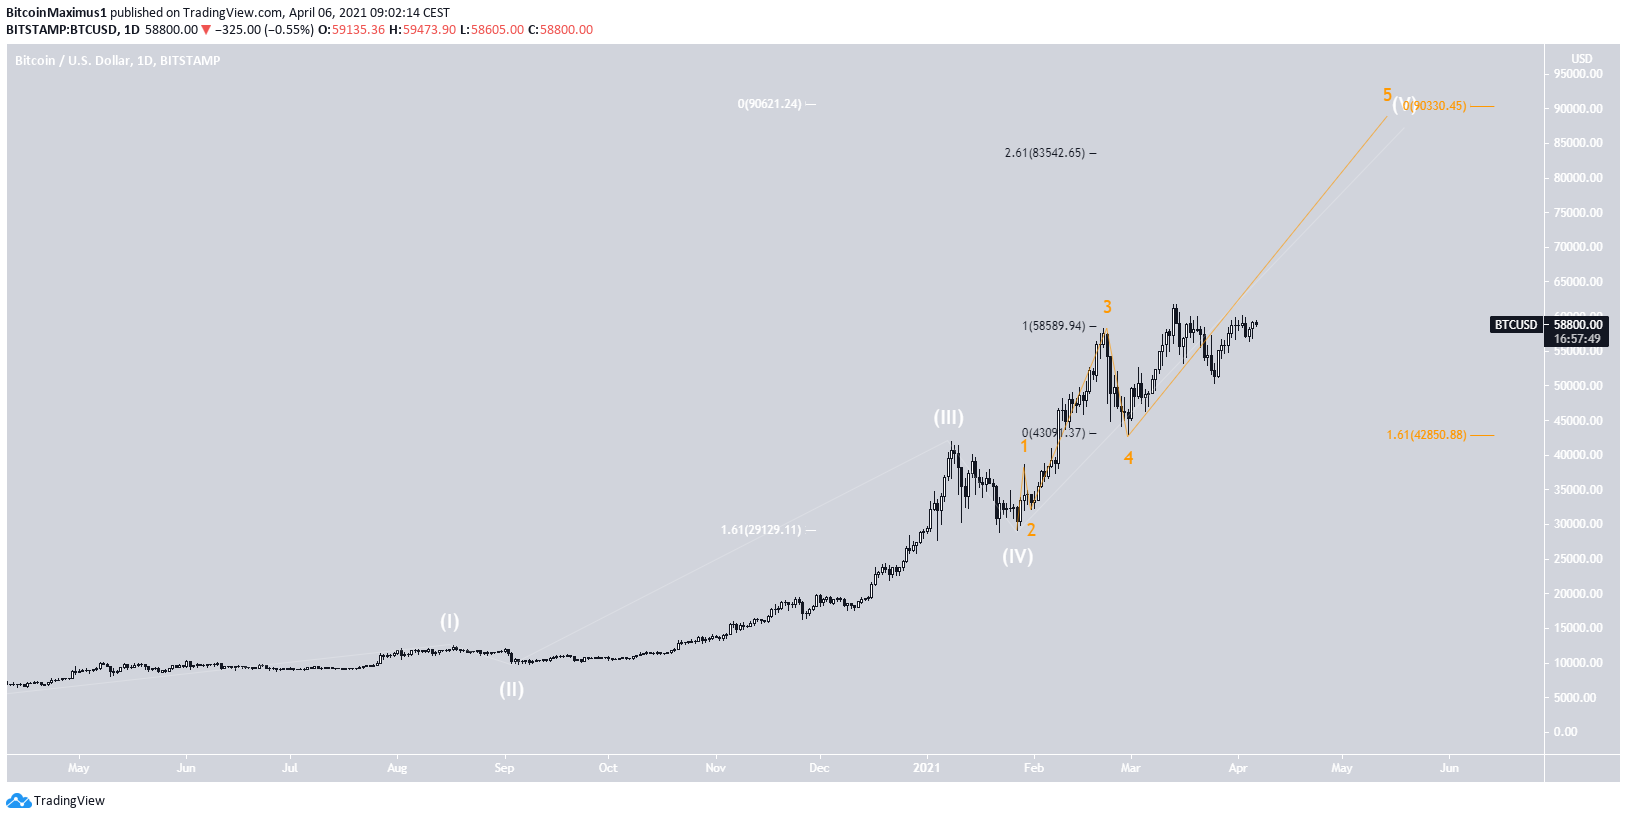
The most likely wave count indicates that BTC is in an extended sub-wave five (orange) of a long-term wave five (white).
The most likely target for the top of the move is found between $83,500-$90,000. This range is found by using Fib projections on waves 1-3 and sub-waves 1-3 (white and orange Fib). In addition, an external retracement is used in order to find the $83,500 target.
Conclusion
Bitcoin is expected to reach a new all-time high price. Afterward, it could potentially move towards the range of $83,500-$90,000.
It’s still unclear if BTC will drop in the short-term prior to a breakout.
For BeInCrypto’s previous bitcoin (BTC) analysis, click here.


