


The price of Bitcoin (BTC) has been increasing since March 14 and has shown preliminary signs of a potential bullish rally.
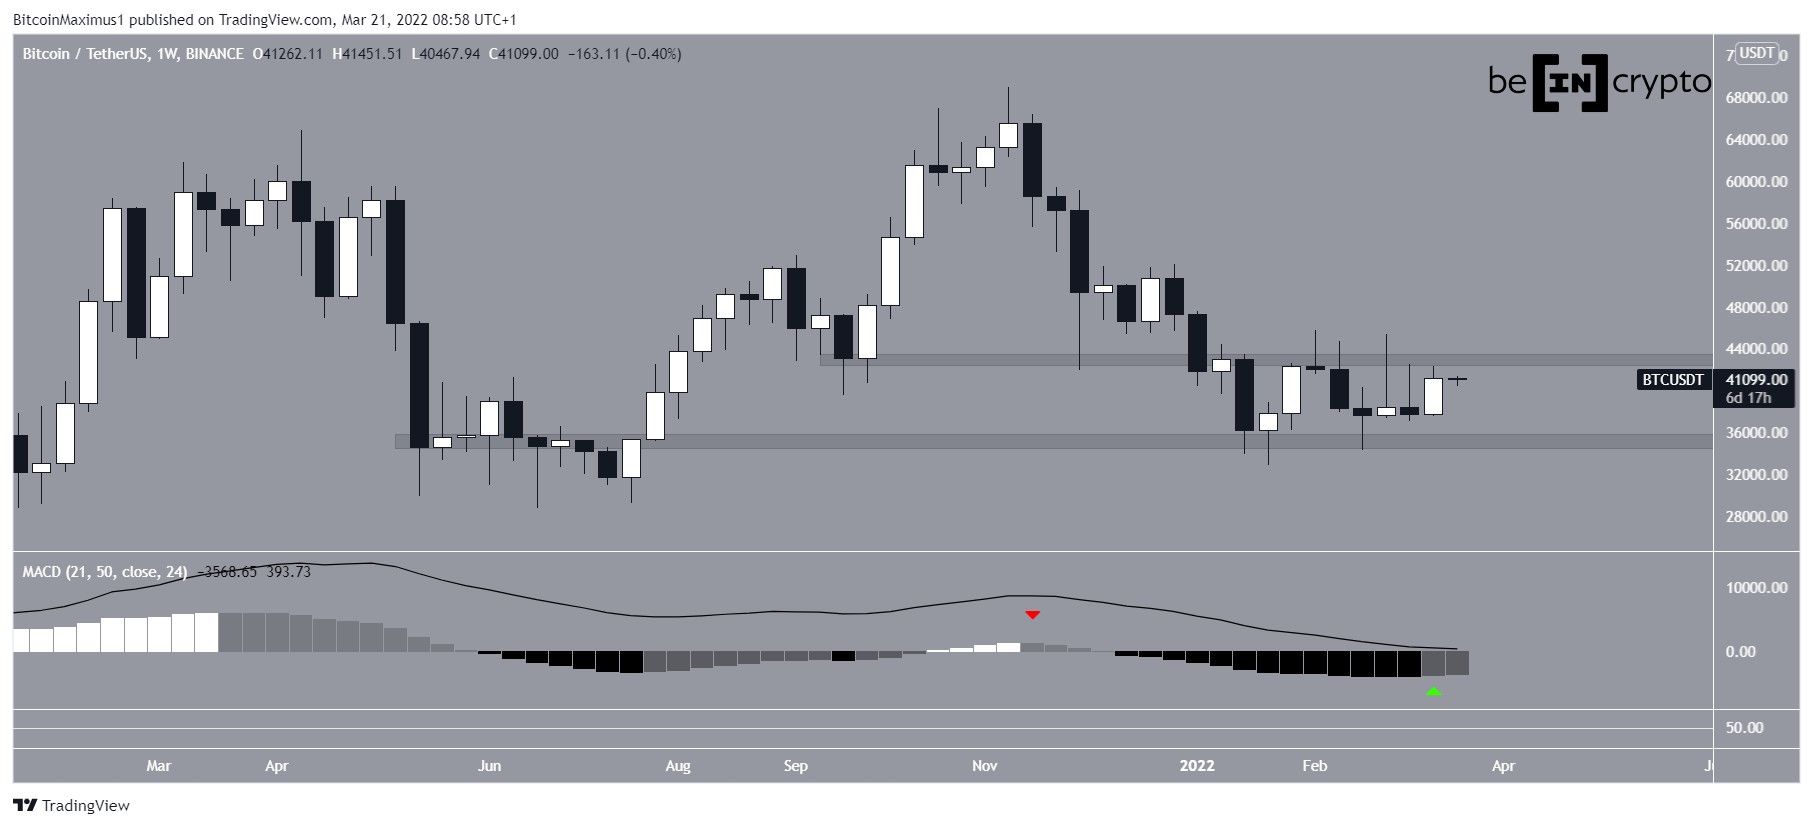
Bitcoin increased during the week of March 13-20, creating a bullish candlestick and negating much of the previous week’s long upper wicks. The price is now slightly below the $43,000 resistance area, which has been in place since the beginning of the year.
Besides the bullish candlestick, another important bullish sign is the higher momentum bar (green icon) created in the MACD. The MACD is an indicator created by short and long-term moving averages (MA), and this means that the short-term MA is gradually gaining momentum relative to the long-term average.
This was the first higher momentum bar (green icon) after 17 consecutive lower bars(red icon).
The previous time this occurred was in August 2021, when BTC initiated the upward move toward the current all-time high price reached in November 2021.
Ongoing BTC support
The daily chart shows that BTC has been trading above an ascending support line since Jan. 22. It bounced at the line on March 14 and created a bullish engulfing candlestick (green icon).
Similar to the weekly time-frame, technical indicators are showing bullish signs. The RSI is above 50 and the MACD has nearly crossed into positive territory (green circle).
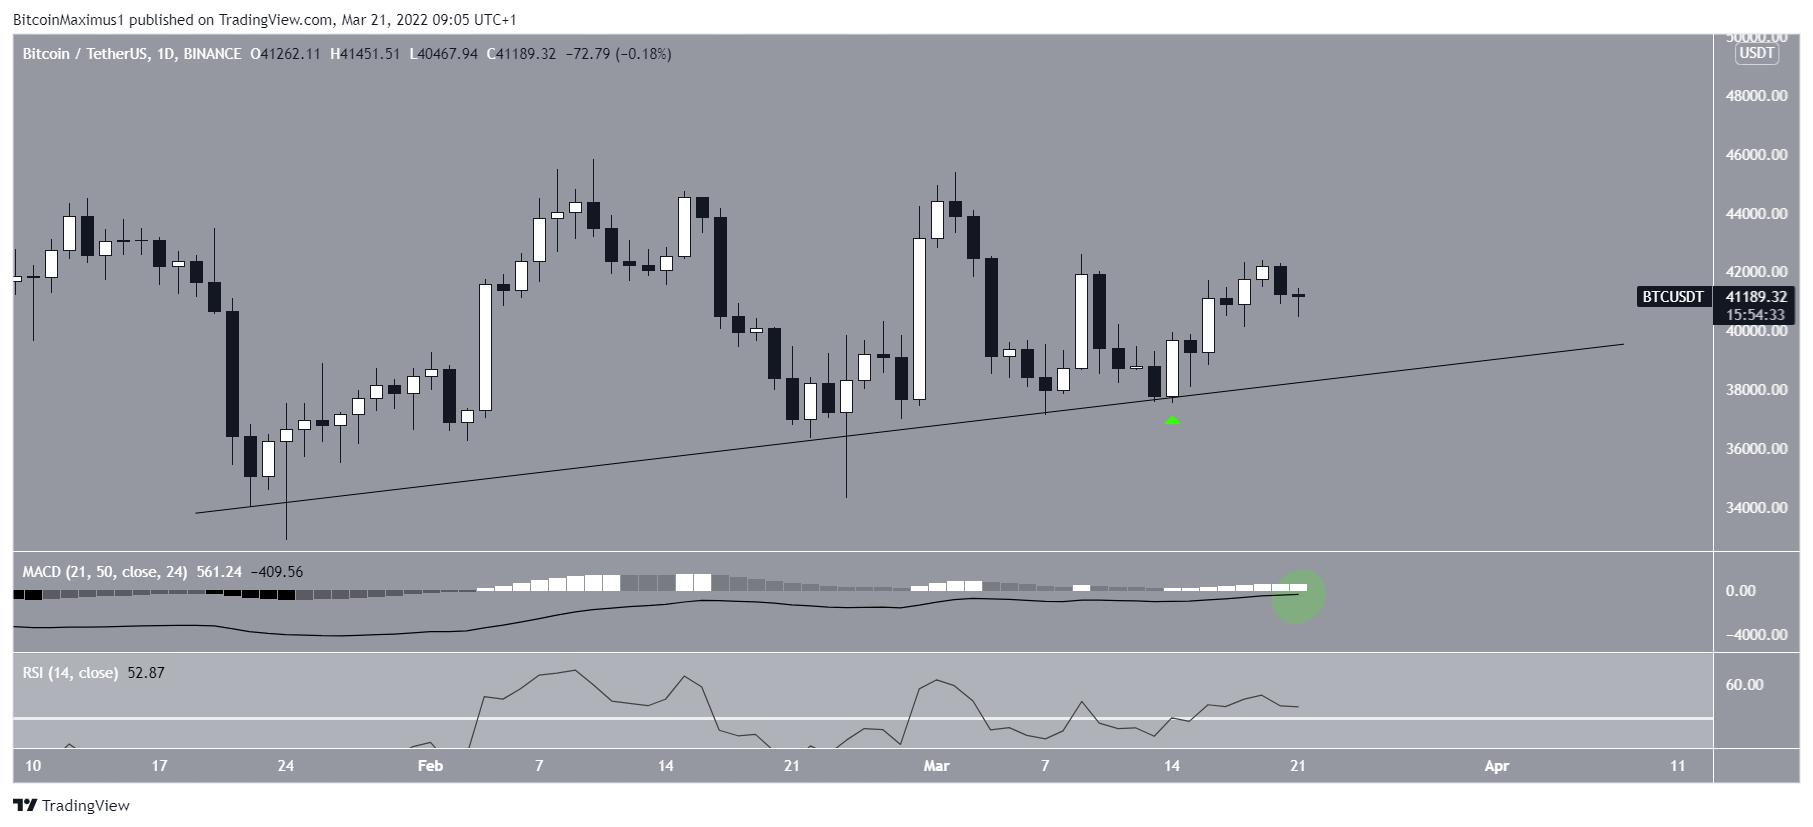
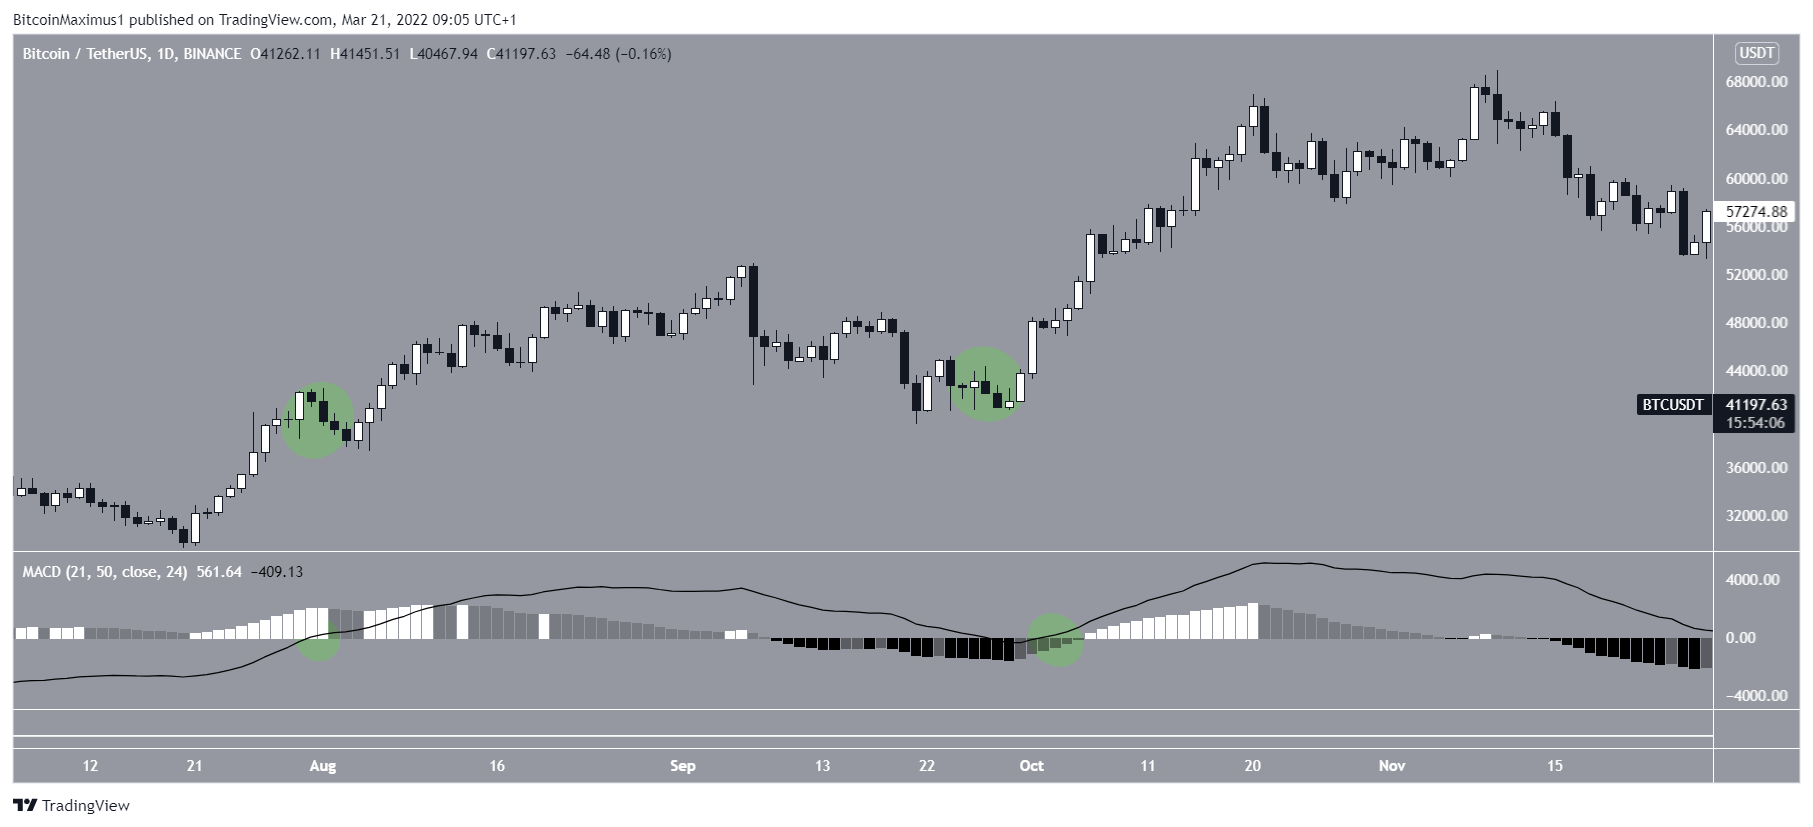
The latter is extremely important since the two previous times this occurred, a considerable upward move followed that led to the current all-time high price.
Short-term movement
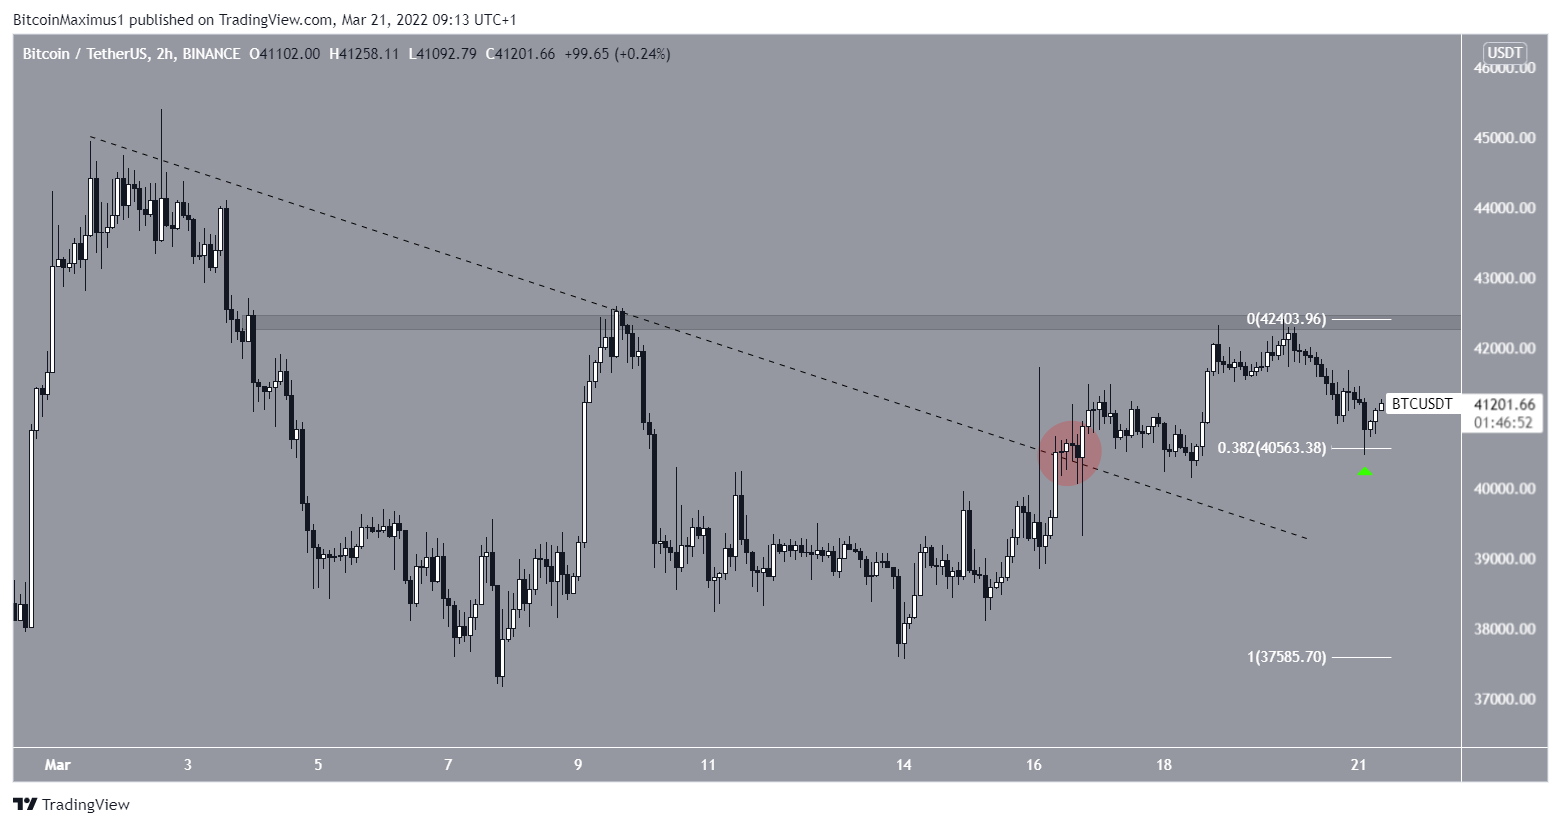
Finally, the two-hour BTC chart shows that the price has broken out from a descending resistance line (red circle) which previously had been in place since the beginning of March.
On March 21, BTC bounced at the 0.382 Fib retracement support level and created a long lower wick (green icon).
The main resistance area is found at $42,600. A breakout above this level would likely cause the price to spike rapidly. However, the true wave count still remains unclear.
For BeInCrypto’s previous Bitcoin (BTC) analysis, click here


