
Bitcoin (BTC) has been moving upwards over the past two days and has reclaimed an important short-term support level in the process.
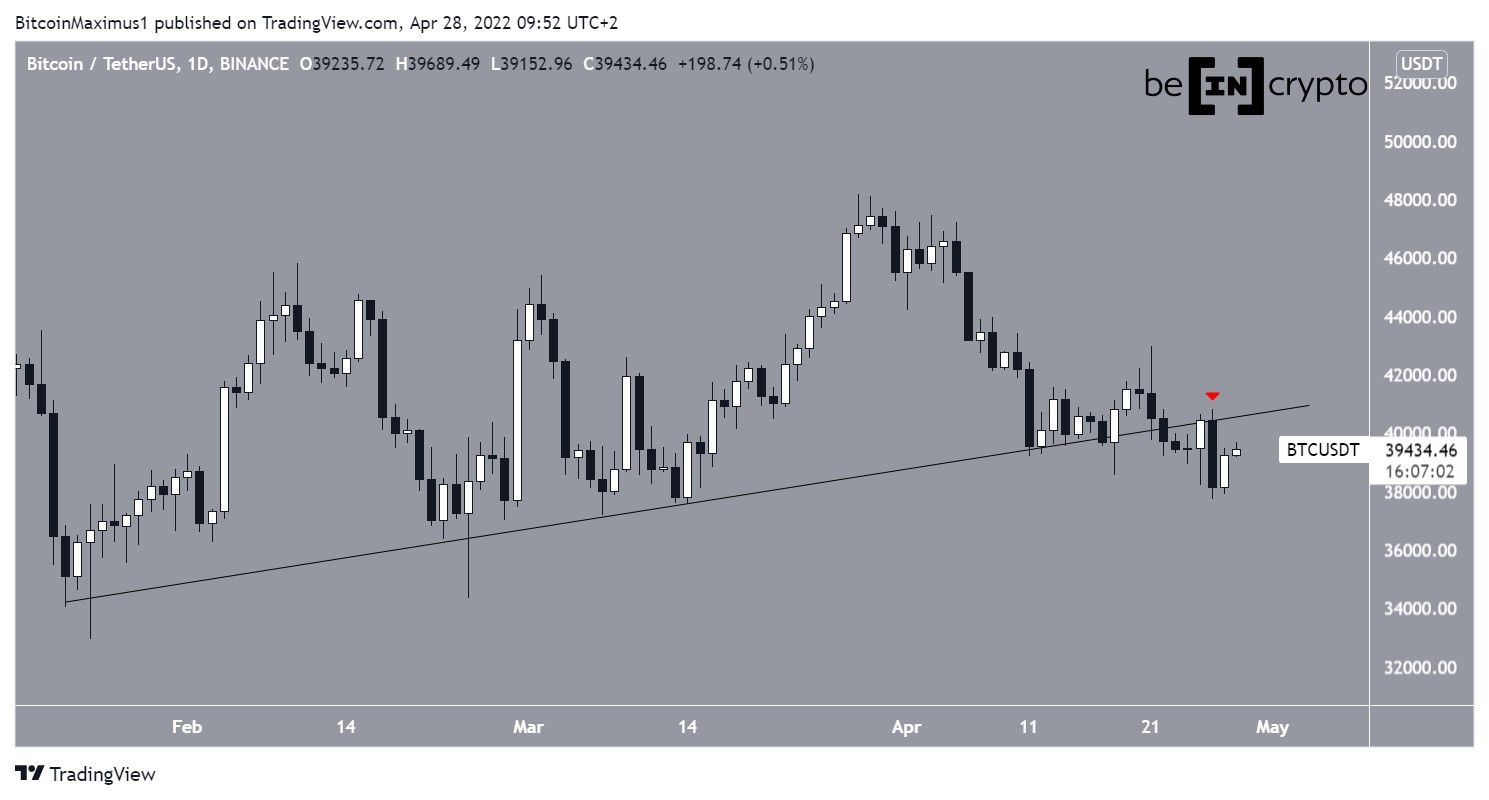
Since Jan. 22, Bitcoin had been trading above an ascending support line. While doing so, it managed to reach a local high of $48,189 on March 28. However, the price has been falling since then and broke down from the line on April 22.
On April 26, BTC created a bearish engulfing candlestick, validating the previous support line as resistance (red icon). It’s possible that this will serve as a catalyst for the continuation of the downward move towards the January and February lows near $32,000.
Ongoing BTC bounce
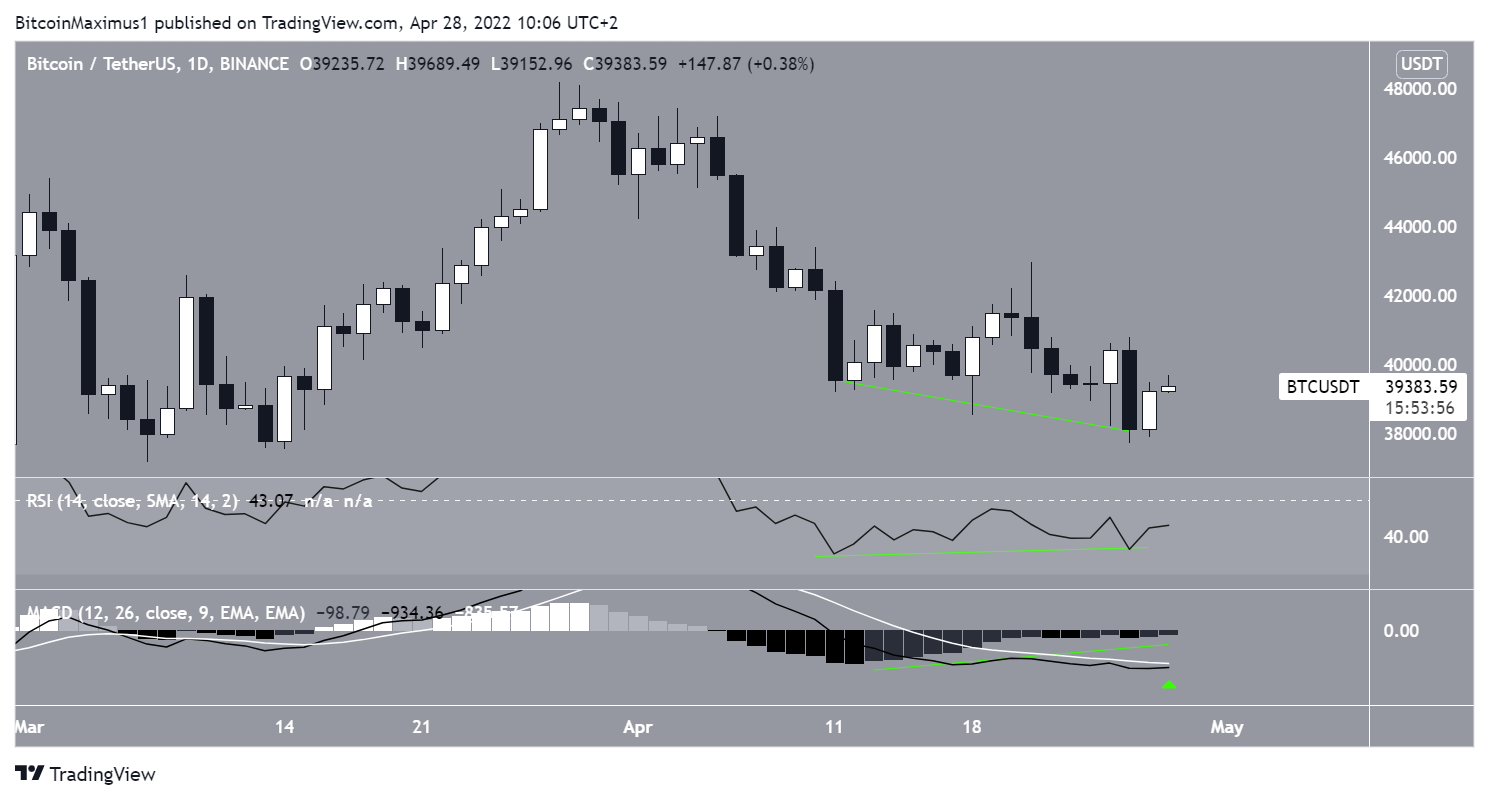
Despite the bearish price action, technical indicators are showing bullish signs. This is especially visible in the bullish divergence in the daily RSI (green line). Such divergences often lead to significant upward movements.
Additionally, the MACD has also generated a bullish divergence, but it’s only visible in the histogram. However, the MACD is very close to making a bullish cross (green icon), which is another sign that the momentum is gradually turning bullish.
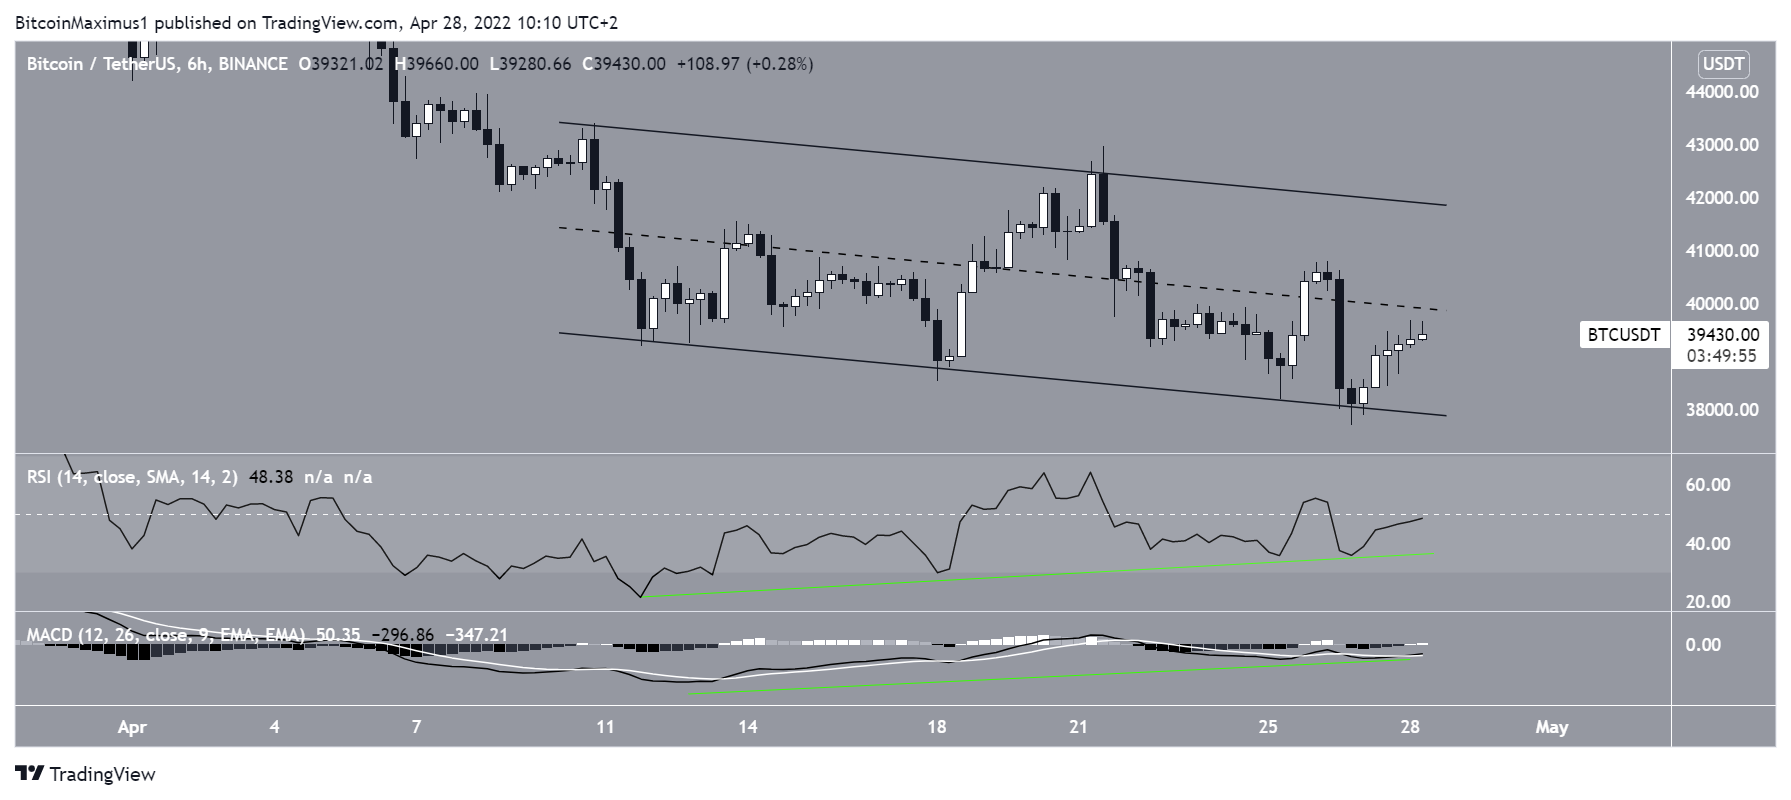
A similar occurrence can be seen in the six-hour time frame, which has even more pronounced bullish divergences.
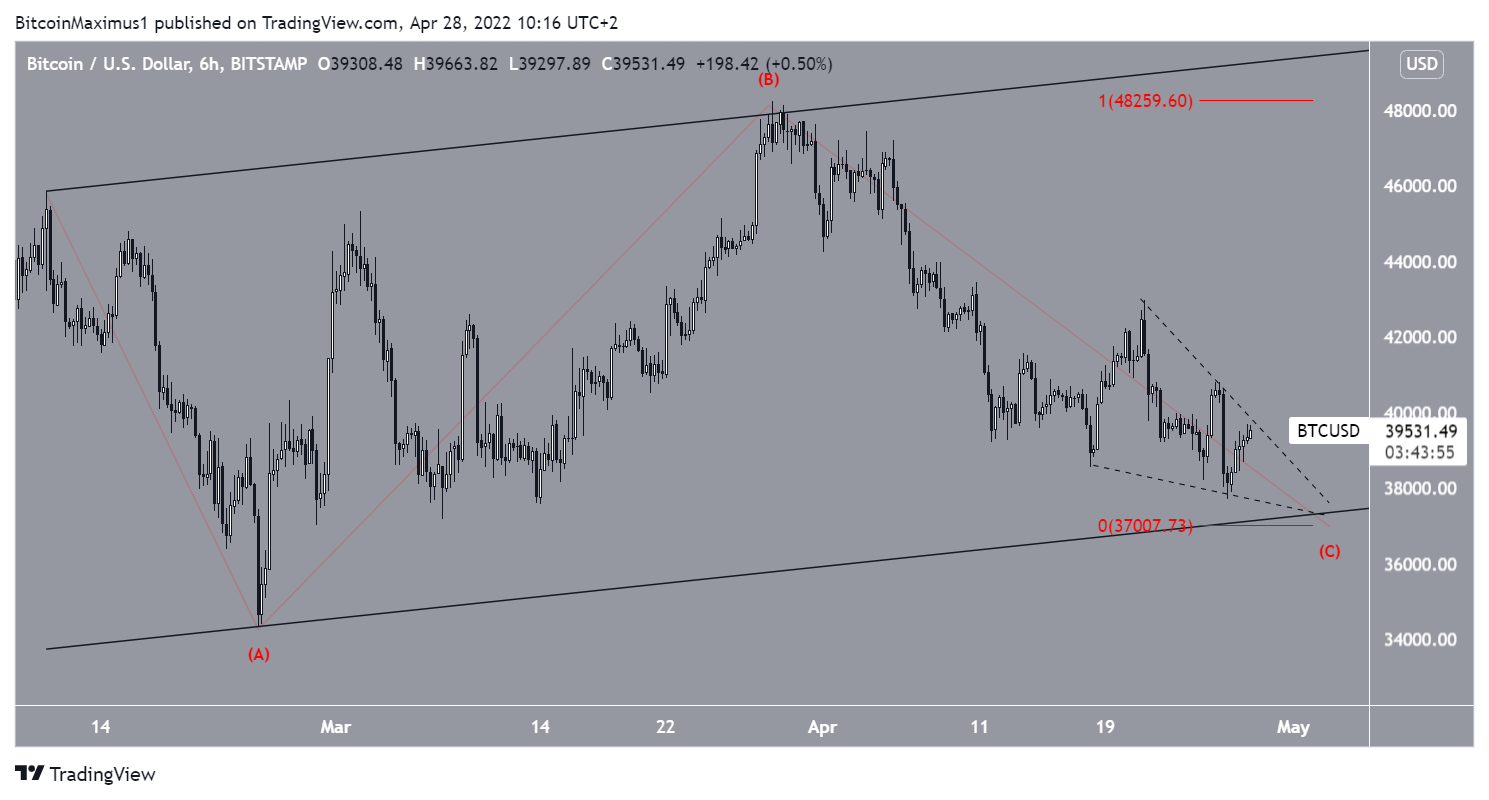
In addition to this, BTC seems to be trading inside a descending parallel channel. Such channels usually contain corrective movements, meaning that a breakout from it would be the most likely scenario.
Currently, the price is approaching the midline of the channel. If it manages to reclaim this level, it would be a strong sign that a breakout is likely.
Future movement
The two-hour chart is more decisively bullish. It shows that BTC has reclaimed the $38,700 area after previously deviating below it.
Currently, the price is increasing towards the next closest resistance area at $40,700. A breakout above this resistance would be a significant bullish development.
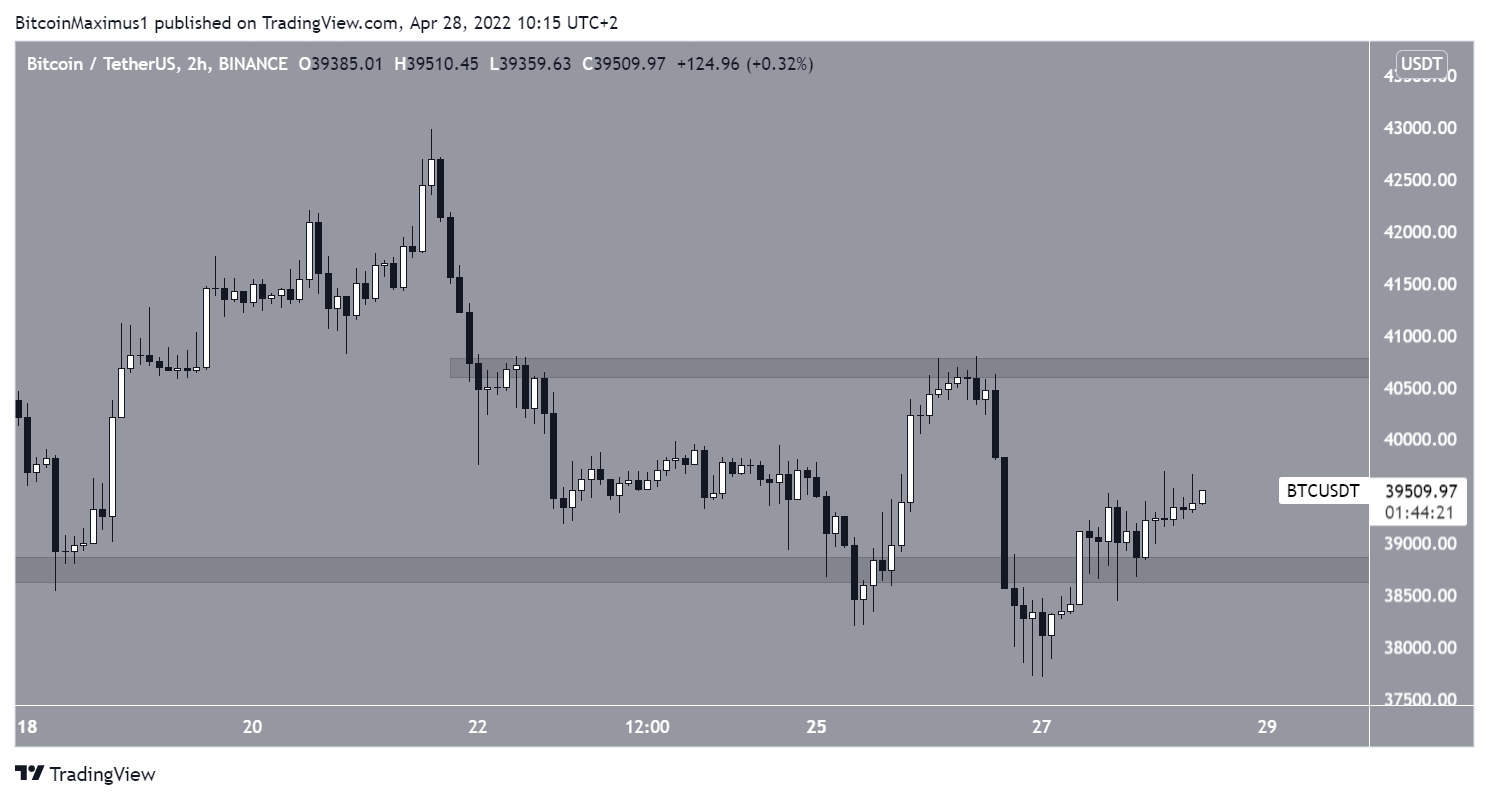
If BTC gets rejected instead, it could continue gradually decreasing towards $37,000, validating the support line of an ascending parallel channel that has been in place since Feb. 24, before eventually breaking out.
In any case, it does seem that a bottom is very close to being reached.
For BeInCrypto’s previous Bitcoin (BTC) analysis, click here
