


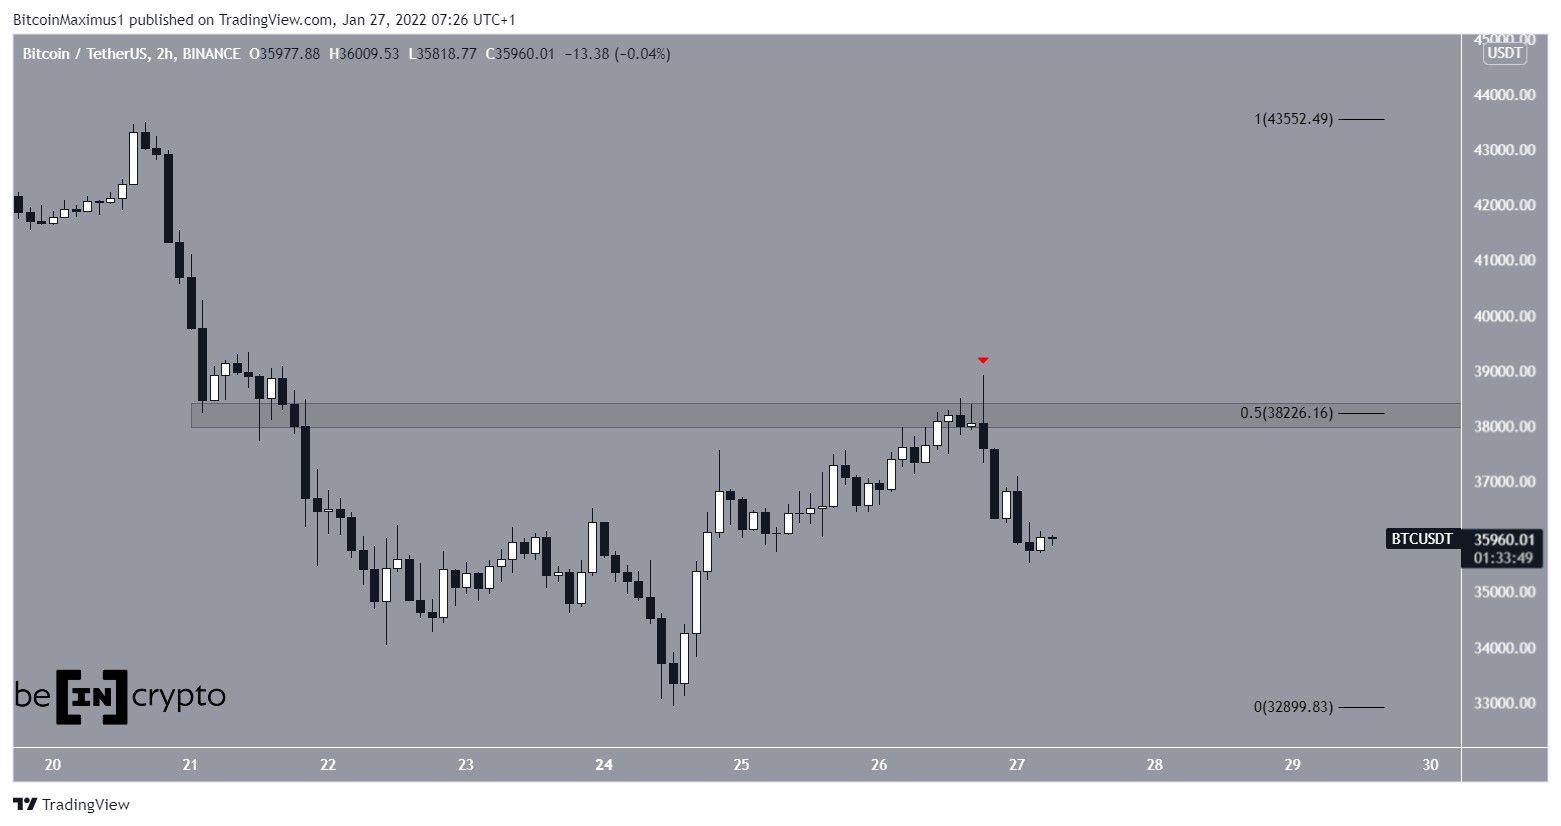
Bitcoin (BTC) managed to return to the $38,919 level since falling below the area on Jan 21. It’s fallen back some since then but it’s possible that it has completed a short-term corrective structure.
Bitcoin had rebounded and was moving upwards after touching a local low of $32,917 on Jan 24. The upward move continued until BTC reached a high of $38,919 on Jan 26. However, this was short-lived, as BTC created a long upper wick and the price decreased the same day.
It failed to break out above the $38,200 resistance, which is both the 0.5 Fib retracement resistance level and a horizontal resistance area.
BTC has to reclaim this area in order for it to create a short-term bullish structure.
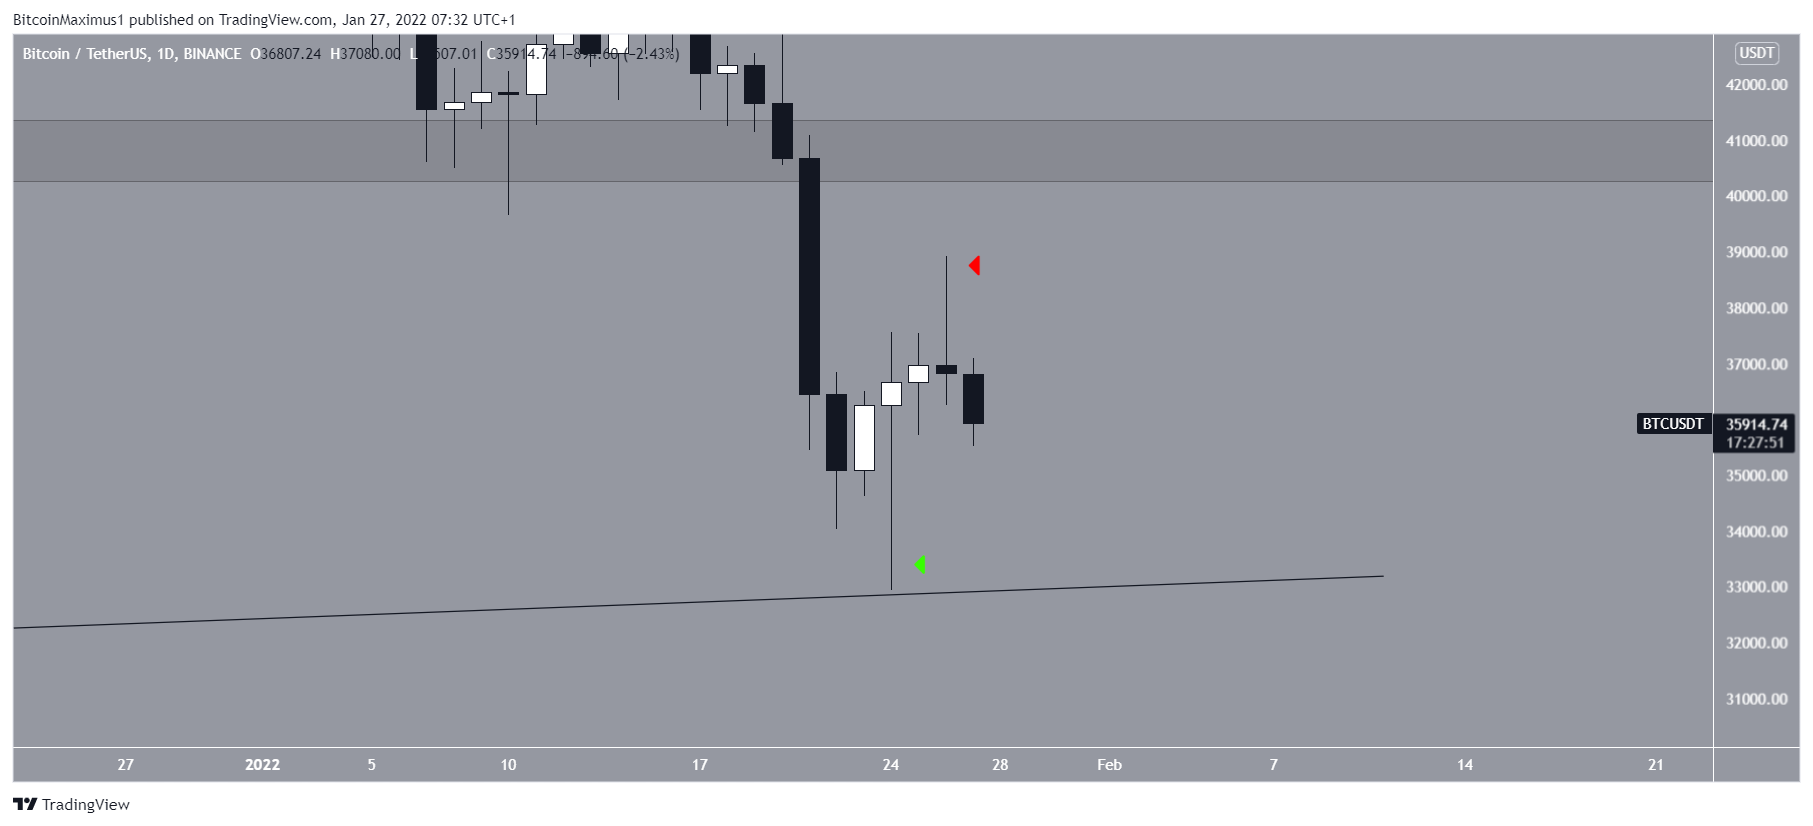
Long-term BTC movement
The daily chart shows that on Jan 26, the price created a long upper wick, which is considered a sign of selling pressure.
However, it’s now approaching the territory of the long lower wick that was created on Jan 24, which is expected to provide support.
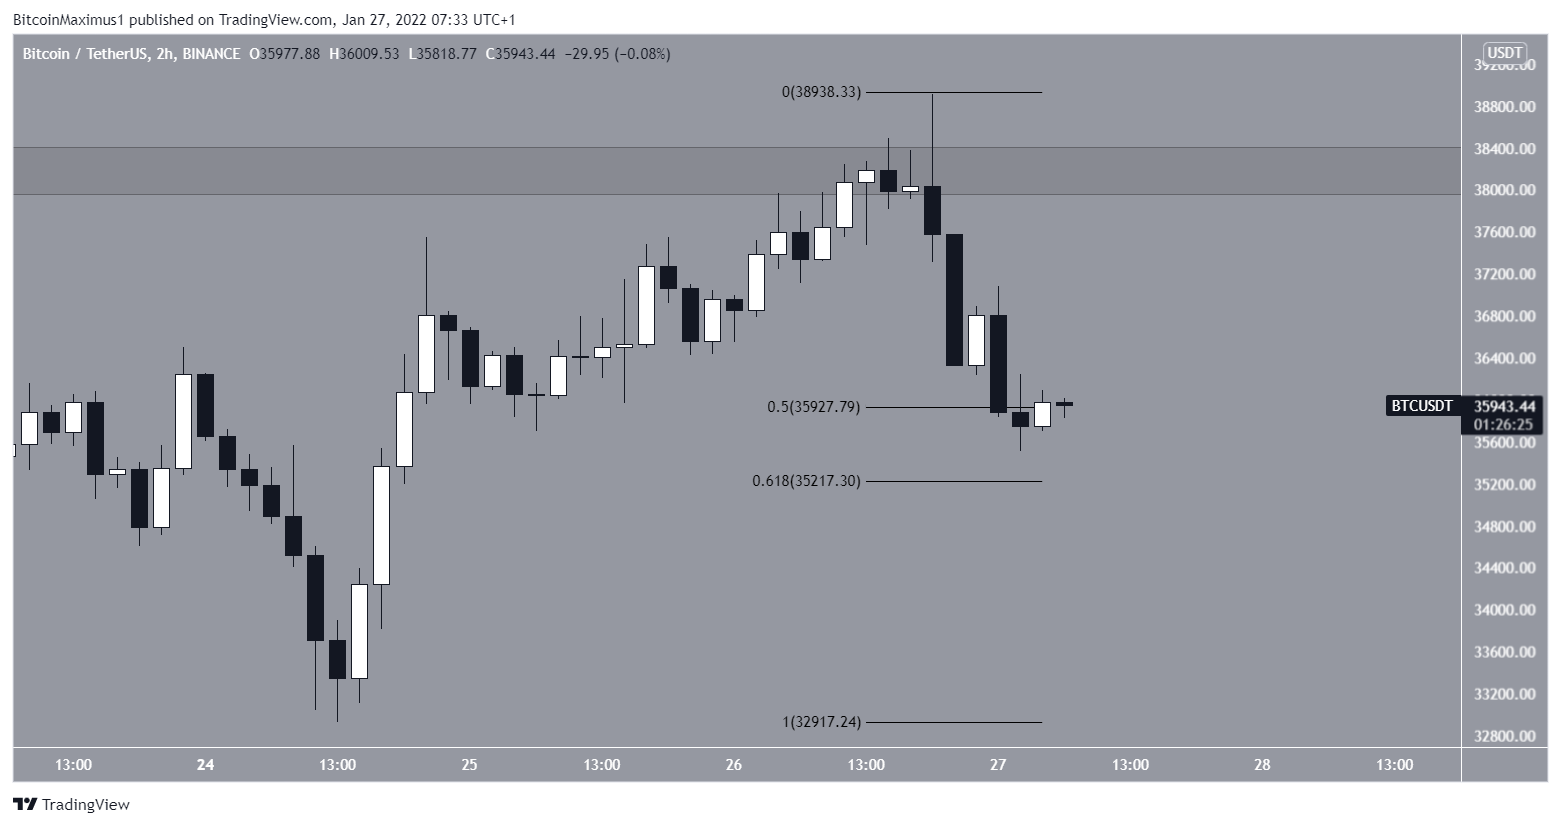
Furthermore, when looking at the two-hour chart, BTC is trading inside the 0.5-0.618 Fib retracement support zone between $35,200-$35,900.
This is the most common Fib area to provide support after a sharp fall, so it could initiate a reversal, allowing BTC to create a higher low in the process.
Wave count analysis
The long-term wave count suggests that BTC has completed a large A-B-C corrective structure that’s been contained inside an ascending parallel channel.
In it, waves A and C had an exact 1:1 ratio, suggesting that a bottom was reached on Jan 24.
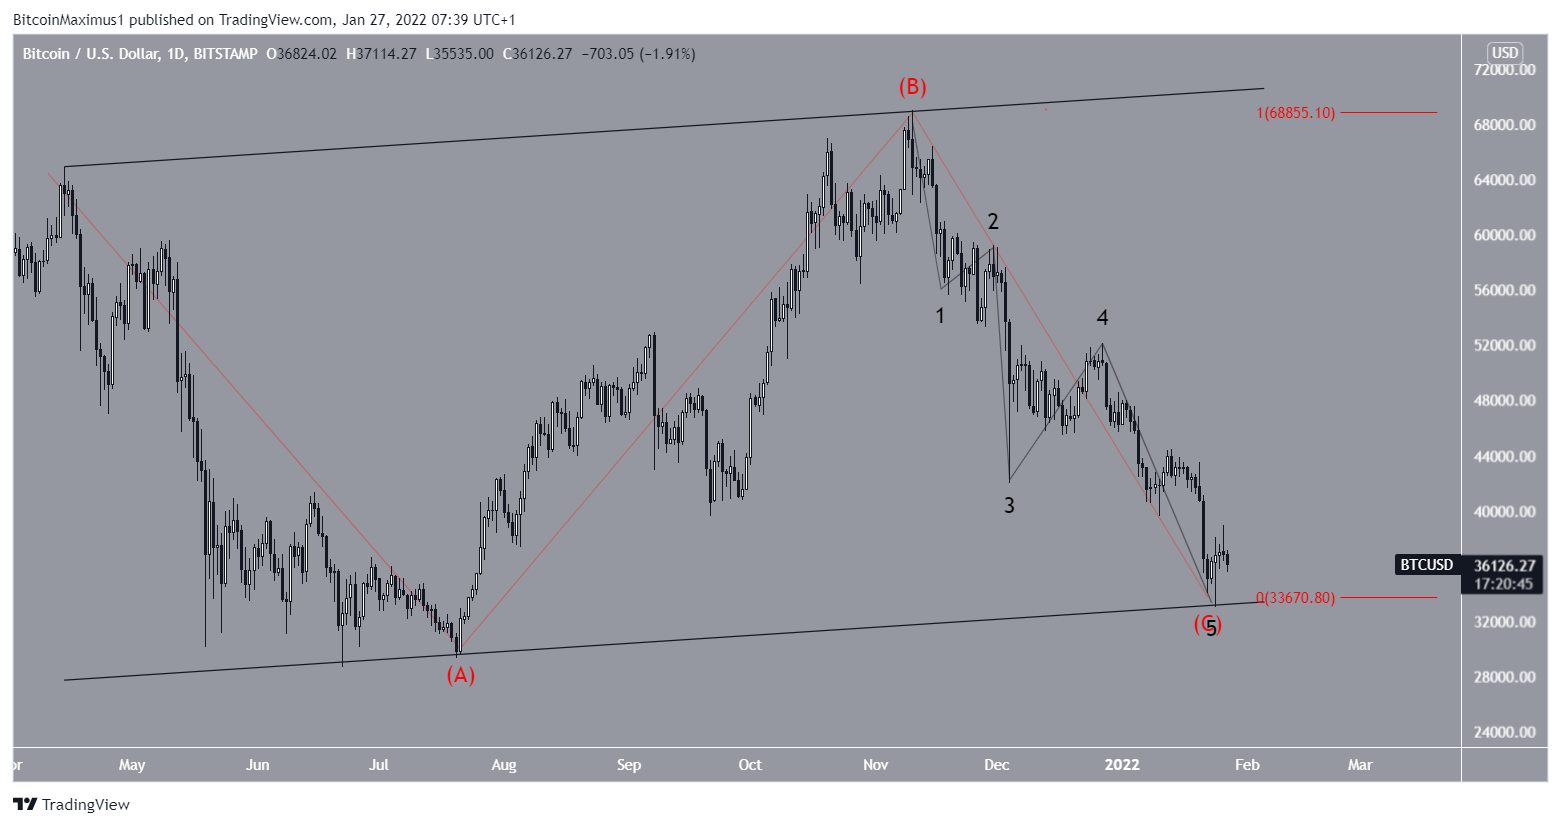
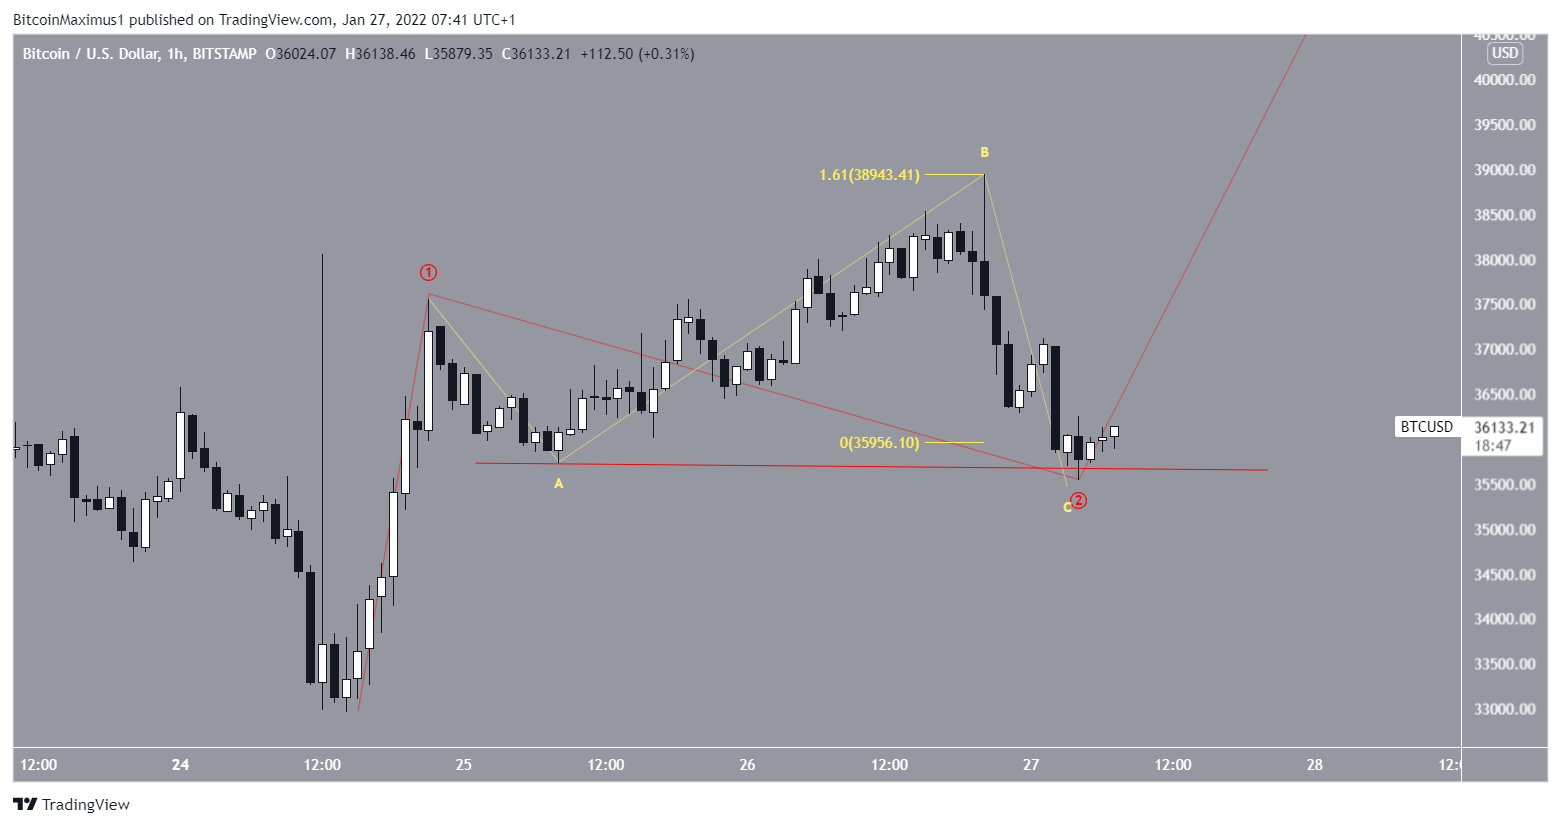
If correct, the short-term count suggests that BTC has completed sub-waves one and two (red). In it, the entire movement from Jan 26 has taken the shape of an irregular flat correction (yellow).
The A and C sub-waves in this correction had a 1:1.61 ratio, which is the second most common in such structures.
For BeInCrypto’s previous Bitcoin (BTC) analysis, click here!


