


Bitcoin (BTC) continues its decline from a local peak of $48,200. On Aug 17, the price closed below the 200-day moving average (MA). An ongoing breakdown from the short-term support line could take BTC to support in the $42,600 area.
Bitcoin loses 200-day MA
Bitcoin saw a decline of nearly 3% yesterday and closed at $44,671. The candle left behind a long top wick, which is a sign of increasing selling pressure.
The price also fell below the important 200-day moving average (MA) (blue line), above which it had been for the past week. Previously, bitcoin had been below this line for the entire 2.5-month downtrend since the May 19 crash.
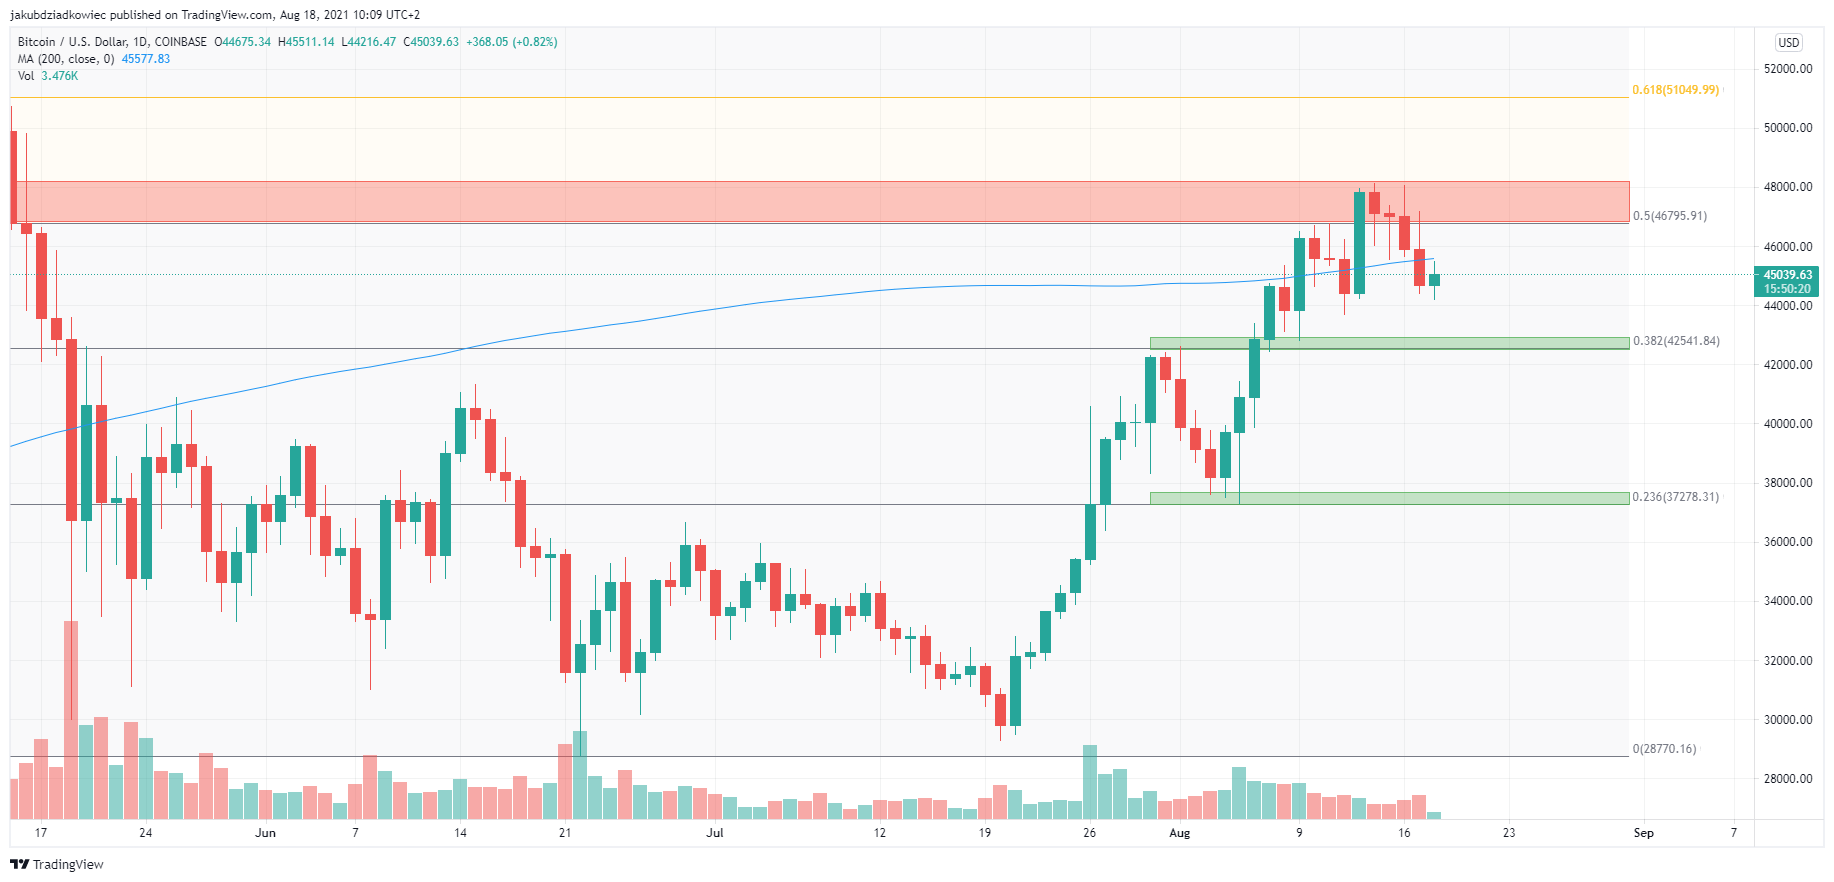
Today we are seeing a small rebound and the price is struggling to regain the $45,000 level. This area coincides with the 200-day MA, which may now act as resistance.
If the decline continues, the closest support area is at the $42,600 level. This is the 0.382 Fib retracement of the long-term downtrend. The next support is $37,300 at the 0.236 Fib retracement.
Technical indicators are providing rather bearish readings. The RSI has moved toward neutral territory but is still above the 50-line, the MACD is falling and printed a second negative momentum bar today, and the Stochastic oscillator has formed a bearish cross but is trying to reverse the decline.
Breakdown from the rising support line
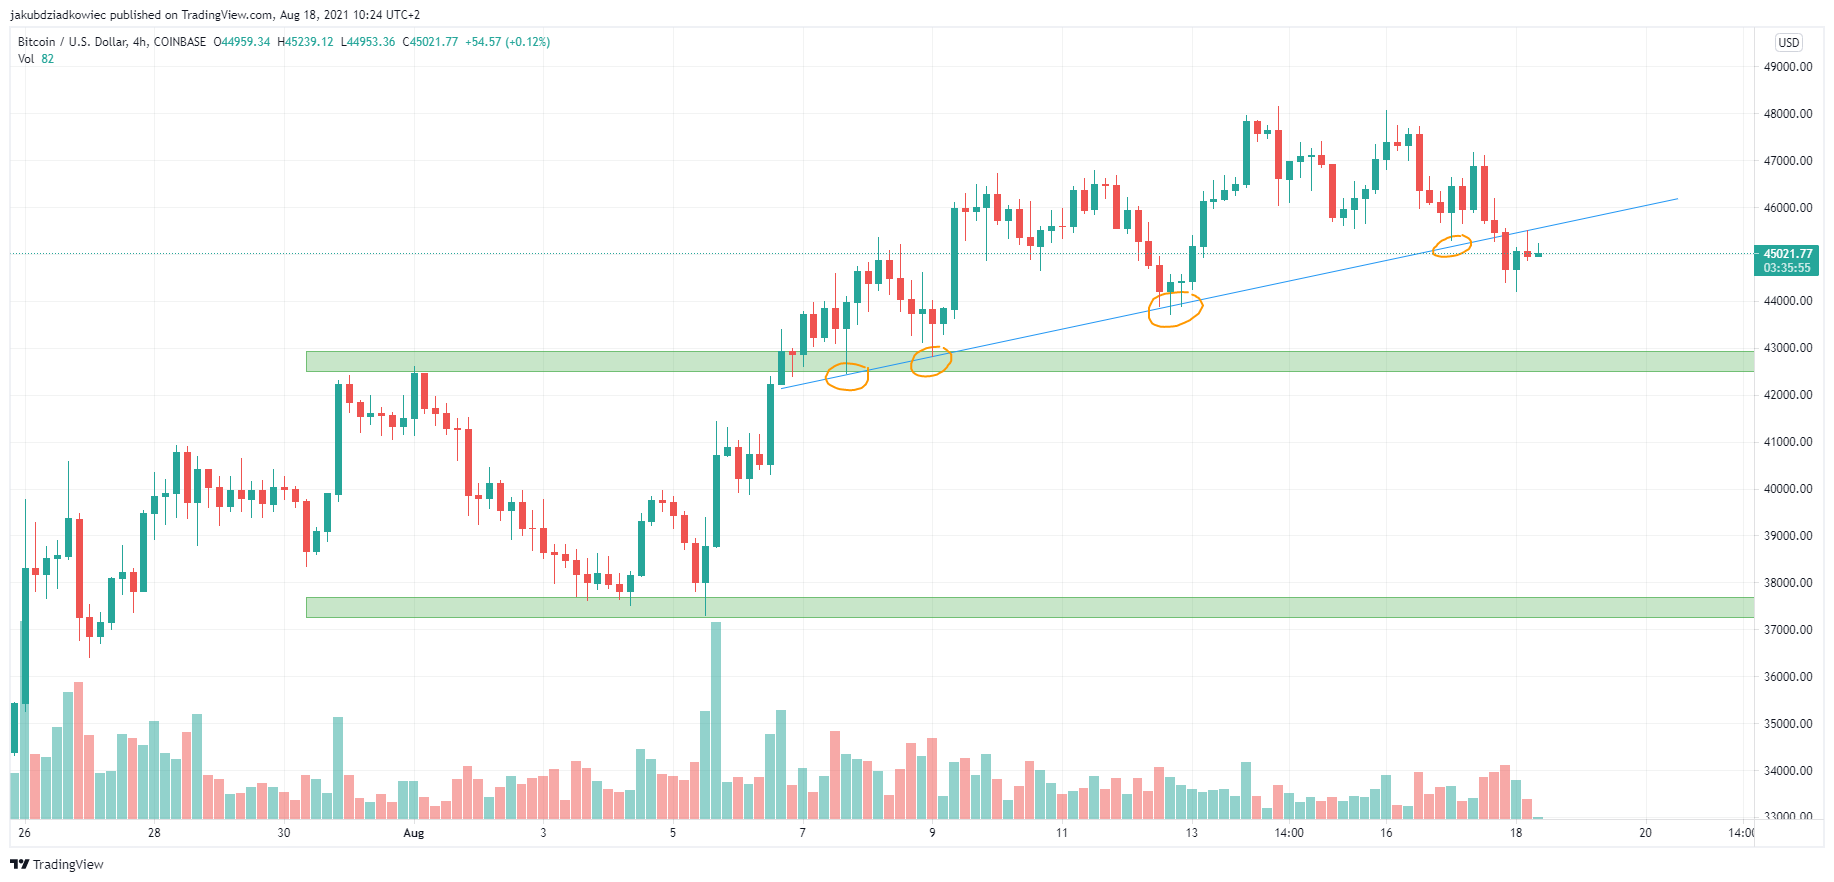
The four-hour chart confirms the bearish outlook from the daily chart. The price has broken down from the rising support line that has been in place since Aug 6.
After testing this support level four times (orange circles), the price broke below it on Aug 17. By the morning of Aug 18, there was a bearish retest of this area that flipped into resistance.
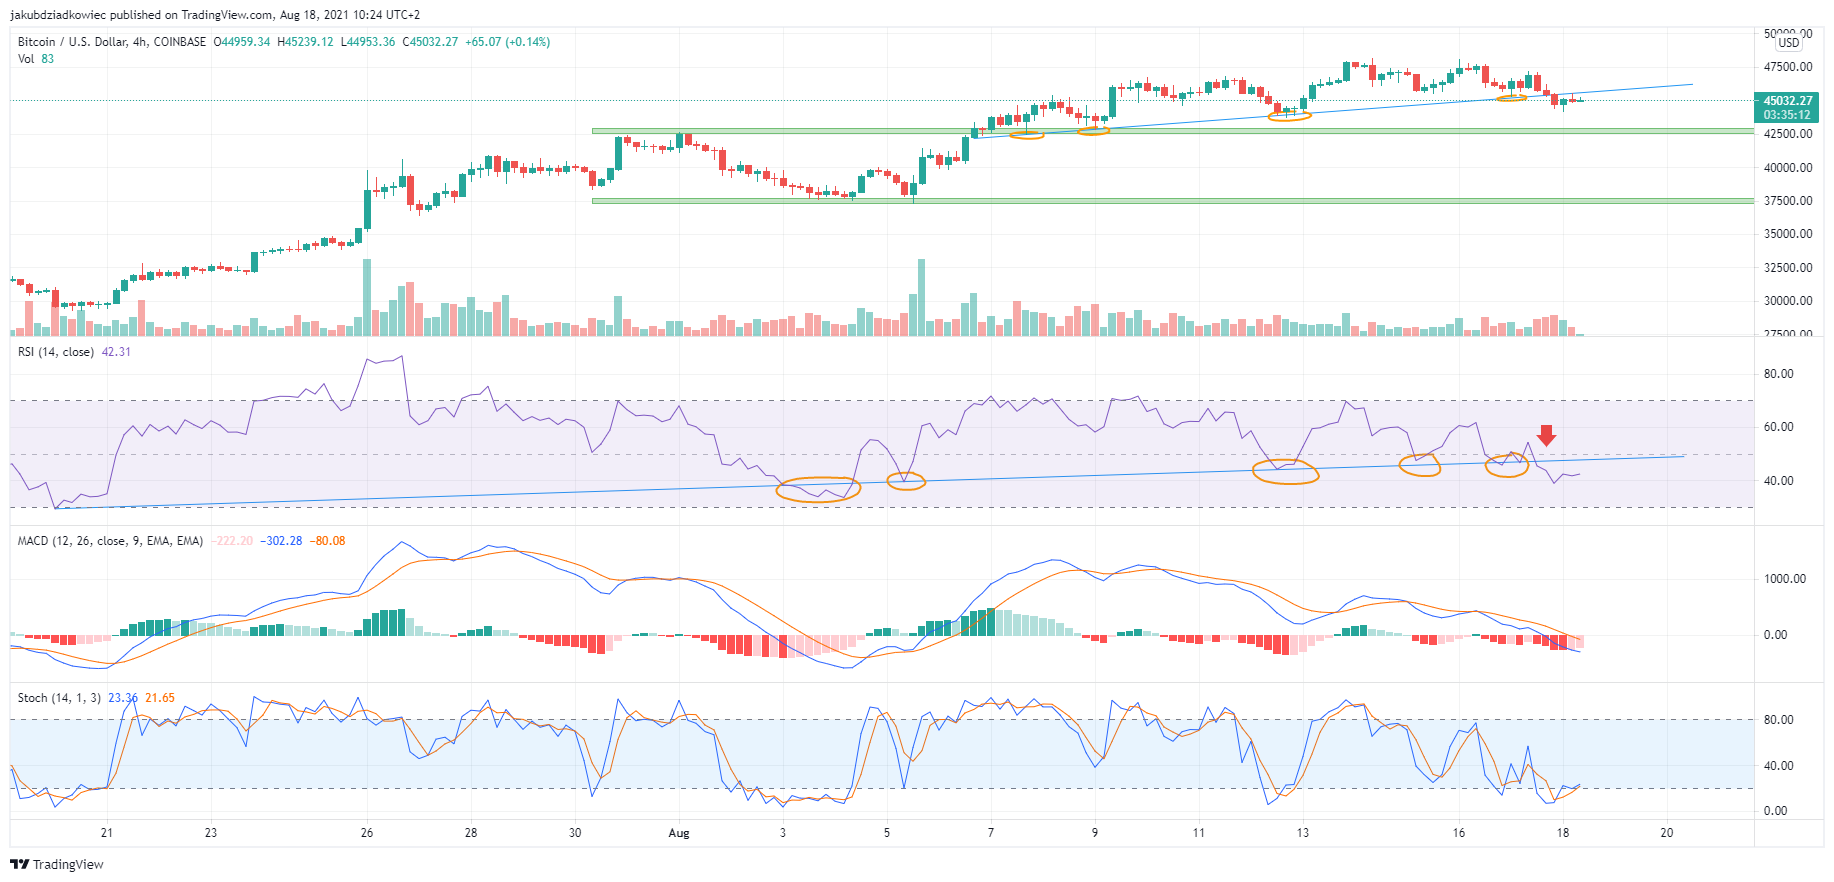
The breakdown from the short-term support line is further confirmed by the corresponding decline in the RSI. The indicator moved up respecting the rising support line in place from the macro low at $28,800. Yesterday, it broke below this support line (red arrow), confirming the trend reversal.
Moreover, the MACD signal line entered negative territory. Similarly, the Stochastic oscillator is in the bearish territory at the 20-line. If BTC fails to reclaim the rising support line, the $42,600 area is again the nearest support target.
For BeInCrypto’s previous Bitcoin (BTC) analysis, click here.


