


Bitcoin (BTC) is at risk of breaking down from a short-term diagonal and horizontal support area, which could cause a sharp drop.
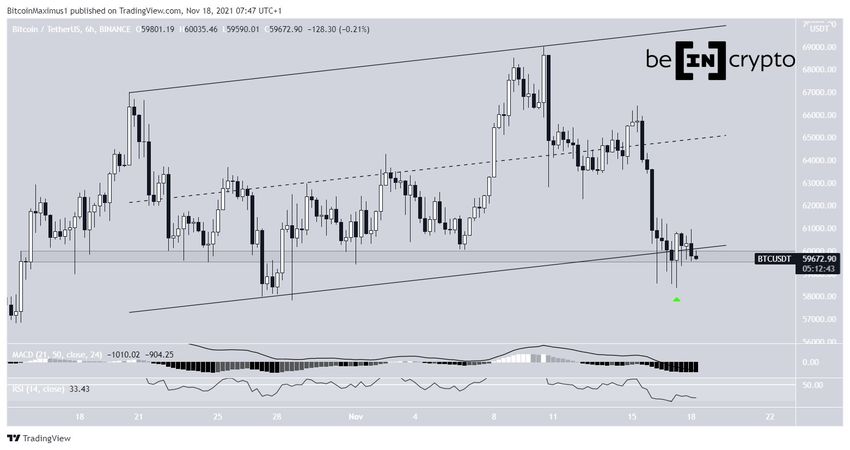
BTC has been trading inside an ascending parallel channel since Oct 20. It was recently rejected by the resistance line of this channel on Nov 10 and began a downward move. This led to a low of $58,373 on Nov 17. The low was made right at the $59,700 horizontal support area.
It’s not yet clear if BTC has broken down from the channel or if it’s still lingering on its support line, which currently coincides with the $59,700 support.
The candlestick on Nov 17 (green icon) looks extremely bullish since it negated the entire previous six-hour decrease and then some. Furthermore, it transpired right at the $59,700 horizontal support area, increasing its significance.
However, technical indicators are bearish as both the MACD and RSI are falling. The MACD uses moving averages (MA) to determine the direction of the trend and the fact that it’s currently negative signifies a bearish trend. Similarly, the RSI, which is a momentum indicator, is below 50 and at risk of falling below 30, also signs of a bearish trend.
Therefore, the six-hour time frame offers ambiguous signs.
Short-term movement
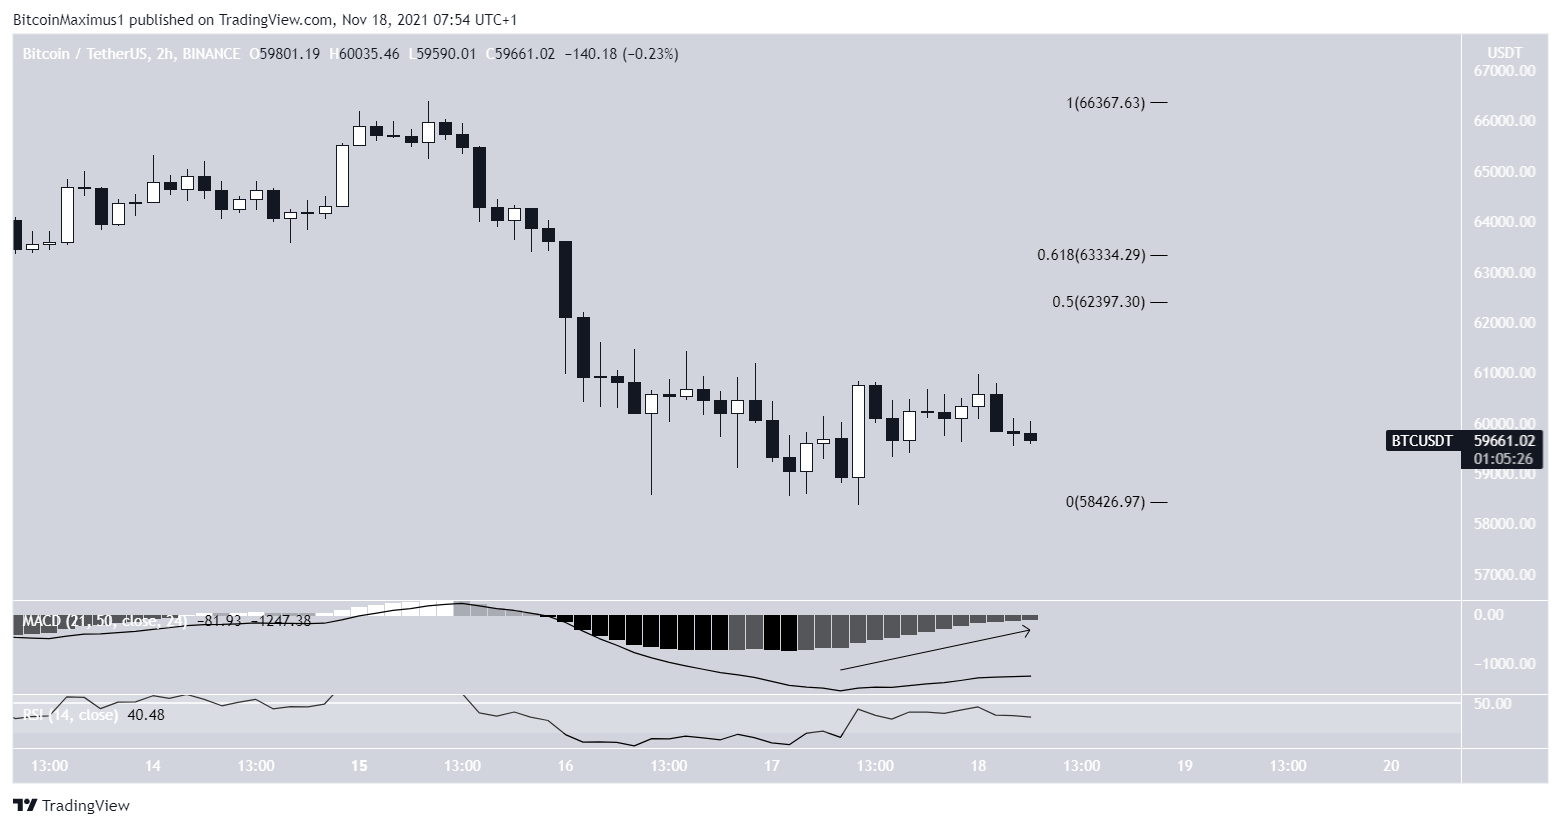
The two-hour chart offers a slightly more bullish outlook, due to the MACD and RSI readings.
Both are moving upwards, and the MACD is close to crossing into positive territory while the RSI is just below 50.
If a short-term upward move transpires, the closest resistance area would be found between $62,400 and $63,300. These targets are the 0.5-0.618 Fib retracement resistance area.
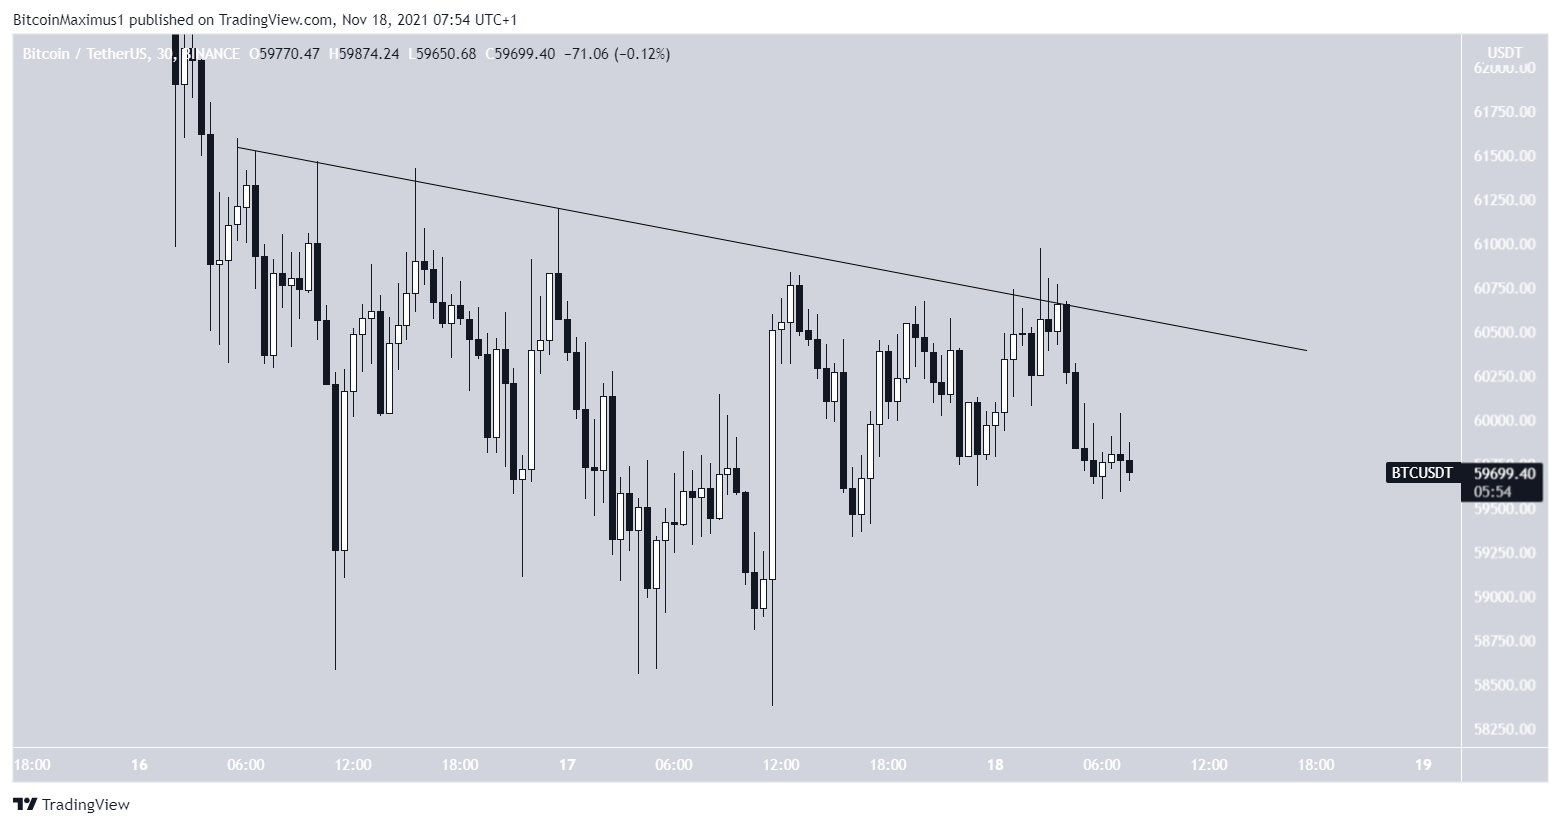
The short-term three-minute chart shows that BTC is still following a descending resistance line.
In order for a potential upward move to begin, it first has to break out above this line.
What if BTC breaks down?
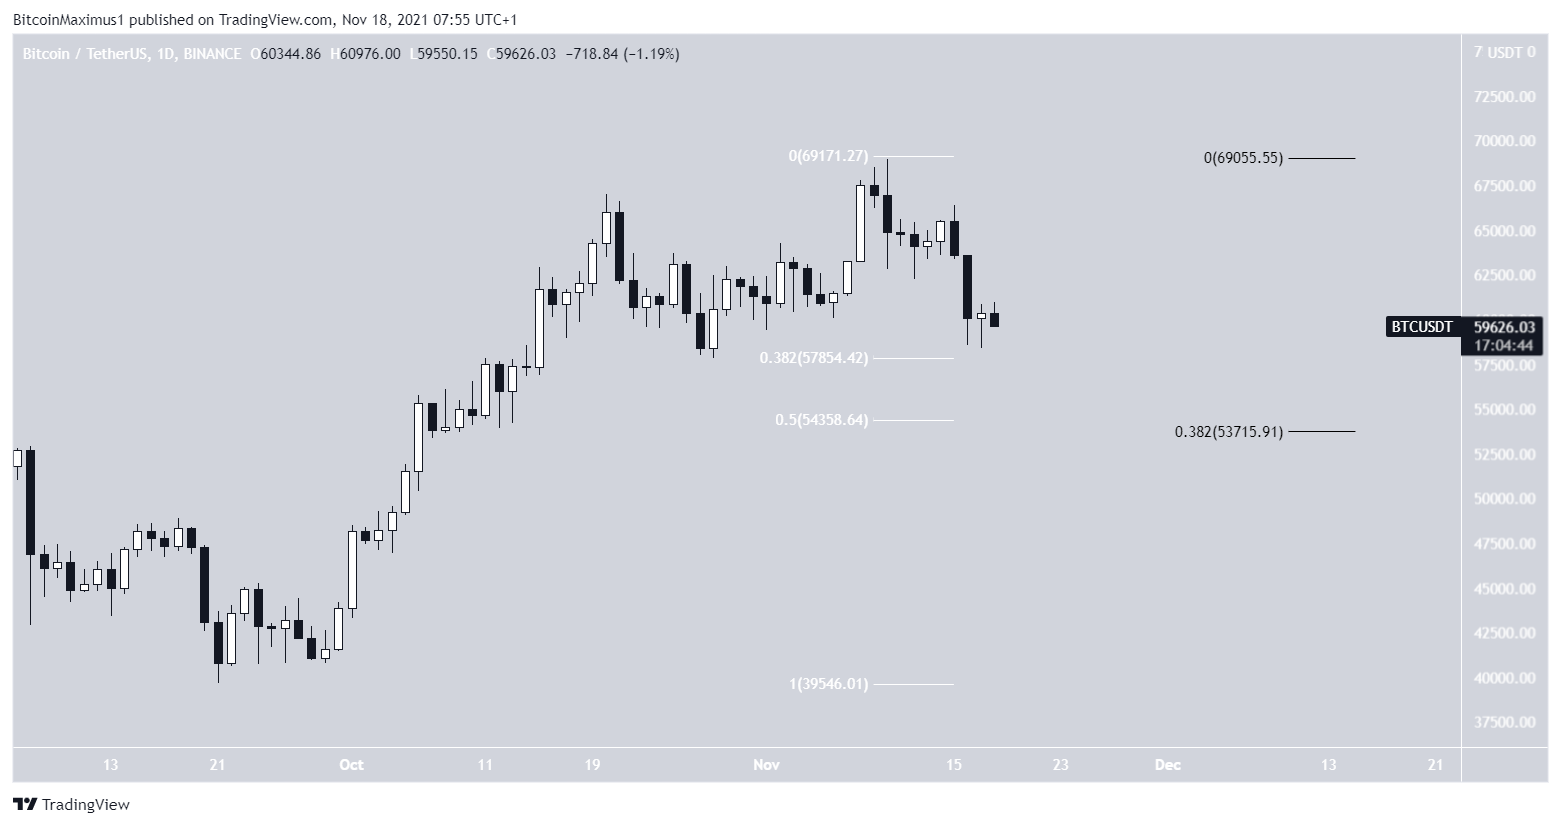
The daily chart shows that BTC is trading just above the 0.382 Fib retracement support level at $57,850.
If a breakdown were to occur, the next closest support area would be between $53,700-$54,300. This would be the 0.382 (black) long-term Fib retracement support and the 0.5 (white) short-term such support.
Following this, BTC would be expected to resume its upward trend.
For BeInCrypto’s previous Bitcoin (BTC) analysis, click here.


