
On May 13, bitcoin (BTC) bounced above the $47,800 support area, putting a temporary end to the downward movement that began the day prior.
While it’s still trading above support, there are no clear bullish reversal signs in place.
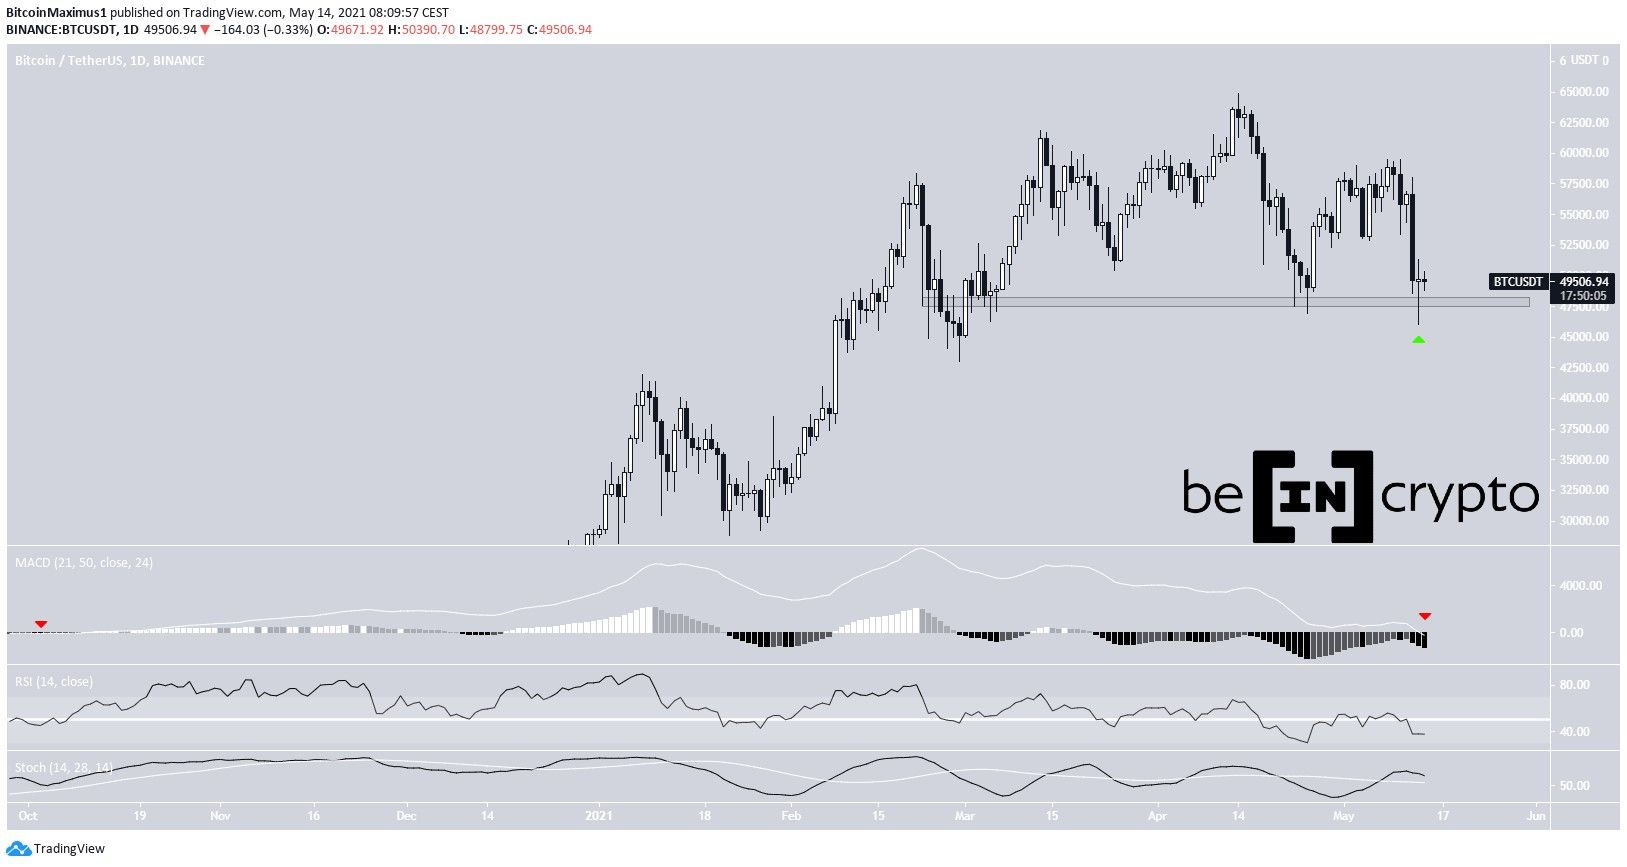
BTC bounces at support
BTC decreased significantly on May 12, reaching a low of $48,600. The decrease continued the next day, taking the price all the way to a low of $46,000.
However, BTC has bounced back since, creating a doji candlestick above the $47,800 support area. BTC hasn’t closed below this level since March. This candlestick also had a bullish close.
Technical indicators are neutral. While the Stochastic oscillator has made a bullish cross, the RSI has crossed below 50.
In addition, the MACD has crossed into negative territory for the first time since October 2020 (red arrows).
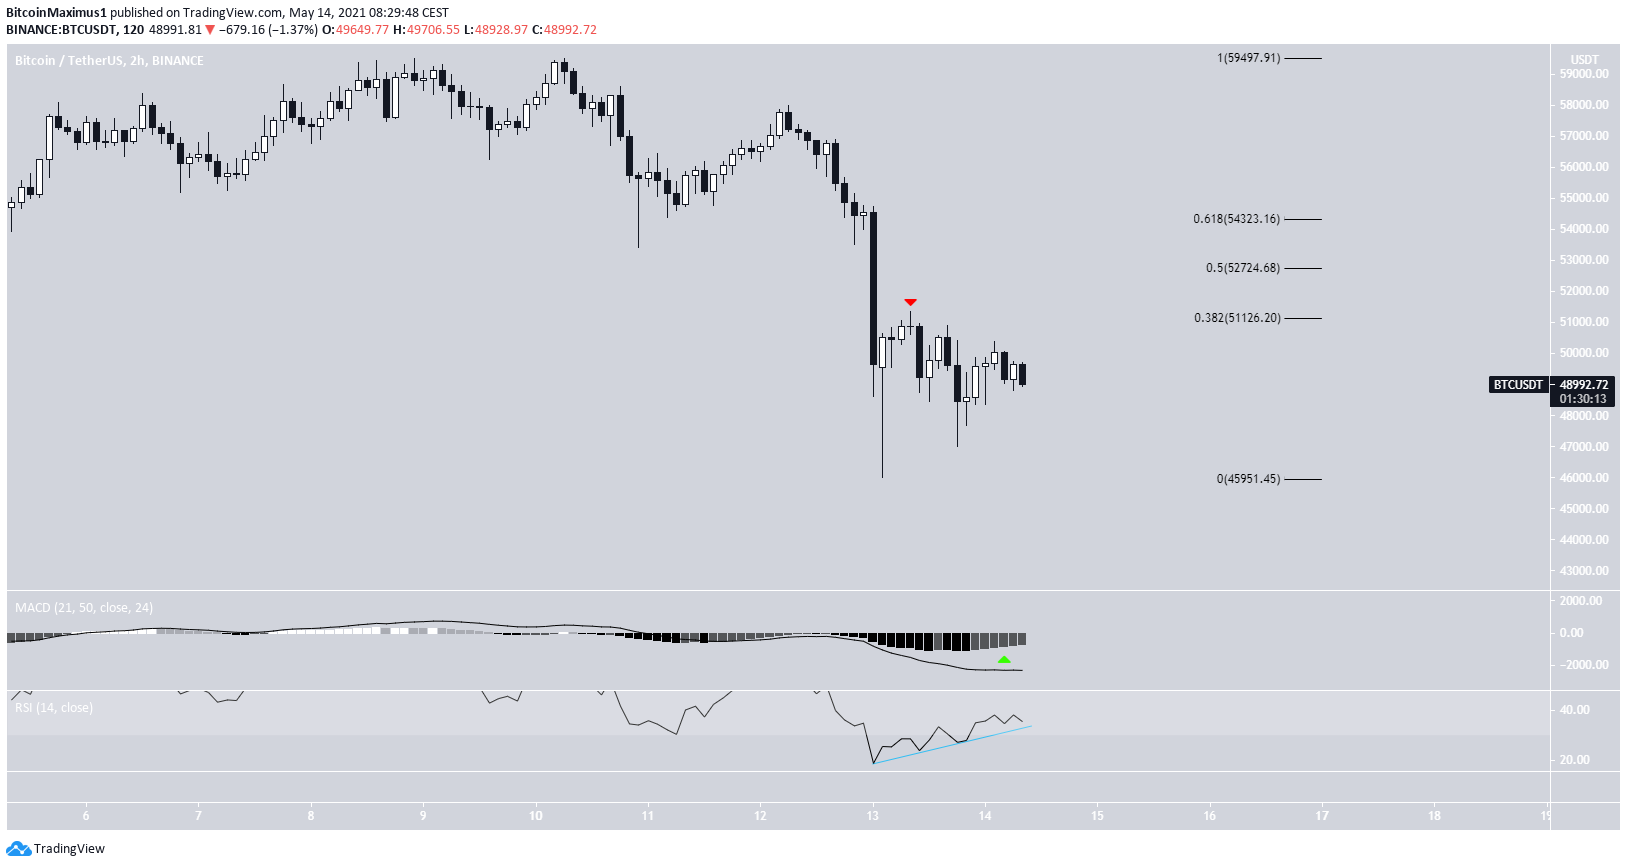
Short-term movement
The two-hour chart shows that BTC was rejected by the $51,125 resistance area, which is the 0.382 Fib retracement resistance level.
Despite the rejection, technical indicators are turning bullish. The MACD has given a bullish reversal signal while the RSI has generated a bullish divergence and has crossed above the 30-line.
The next resistance area is found at $52,725, created by the 0.5 Fib retracement level.
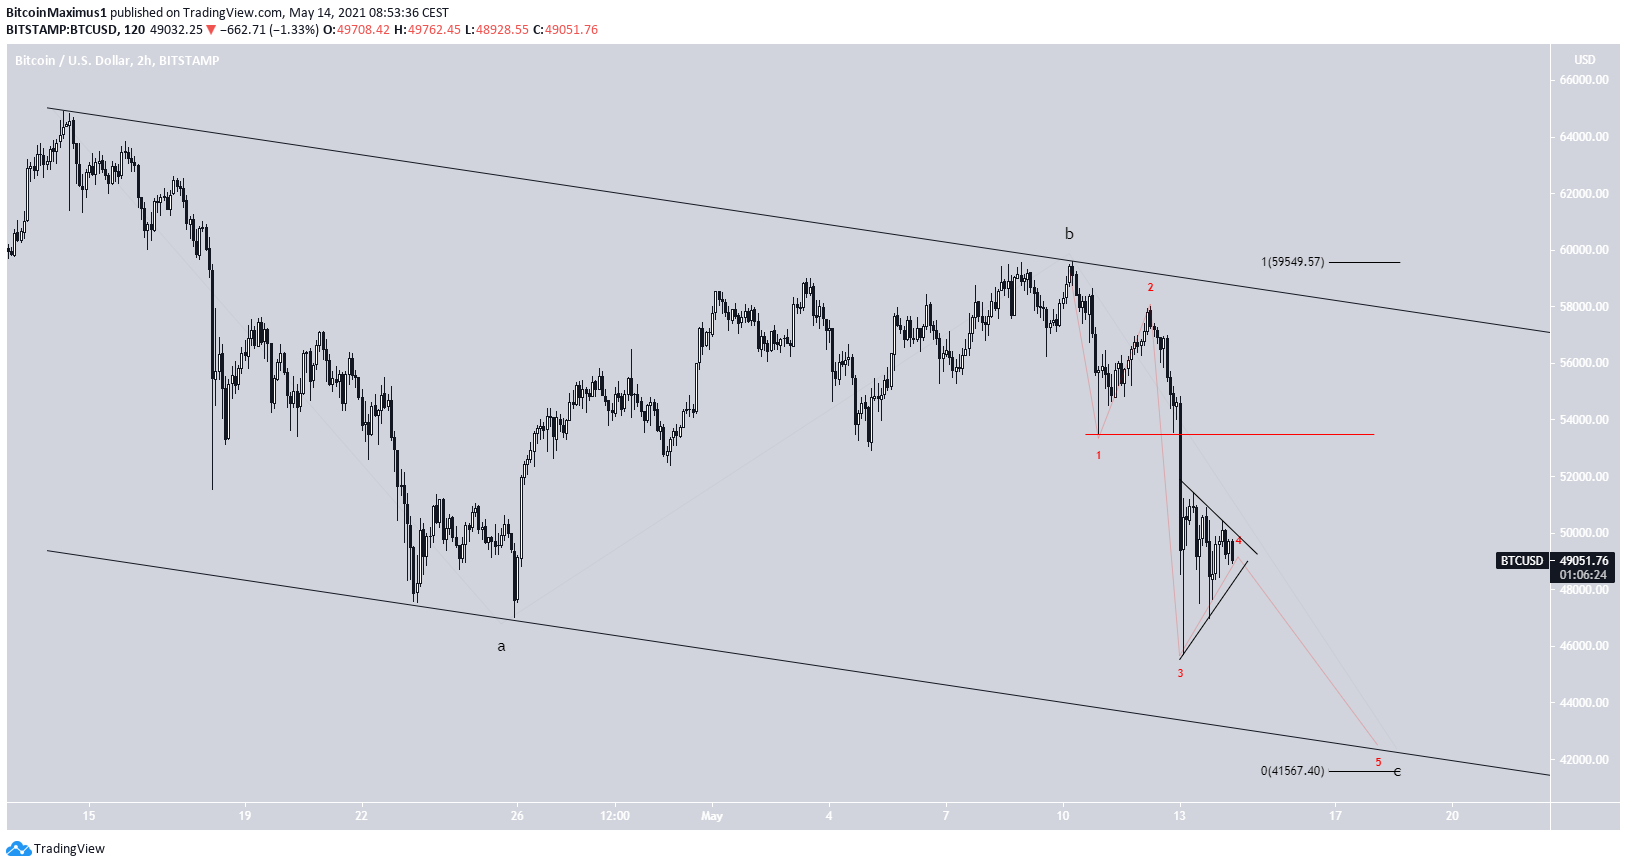
BTC wave count
The wave count indicates that BTC is in the C wave of an A-B-C corrective structure.
A target of $41,560 would give waves A:C a 1:1 ratio. In addition, it would take the price to the support line of the descending channel.
The sub-wave count is shown in red. It suggests that the price is in sub-wave four, which has developed into a symmetrical triangle. A breakdown from this pattern would likely confirm that the price is heading towards the support line of the channel.
On the other hand, an increase above the sub-wave 1 low of $53,500 (red line) would invalidate this possibility.
For the longer-term count, click here.
Conclusion
Despite being at support, BTC has not shown any bullish reversal signs. Bitcoin could likely fall to $41,560 before resuming its upward movement.
For BeInCrypto’s previous bitcoin (BTC) analysis, click here.
