
On Aug 16, Bitcoin (BTC) created a bearish engulfing candlestick and broke down from an ascending support line in the process.
BTC is in the process of validating the line as resistance, after which it could resume its descent towards the closest support area.
BTC continues descent
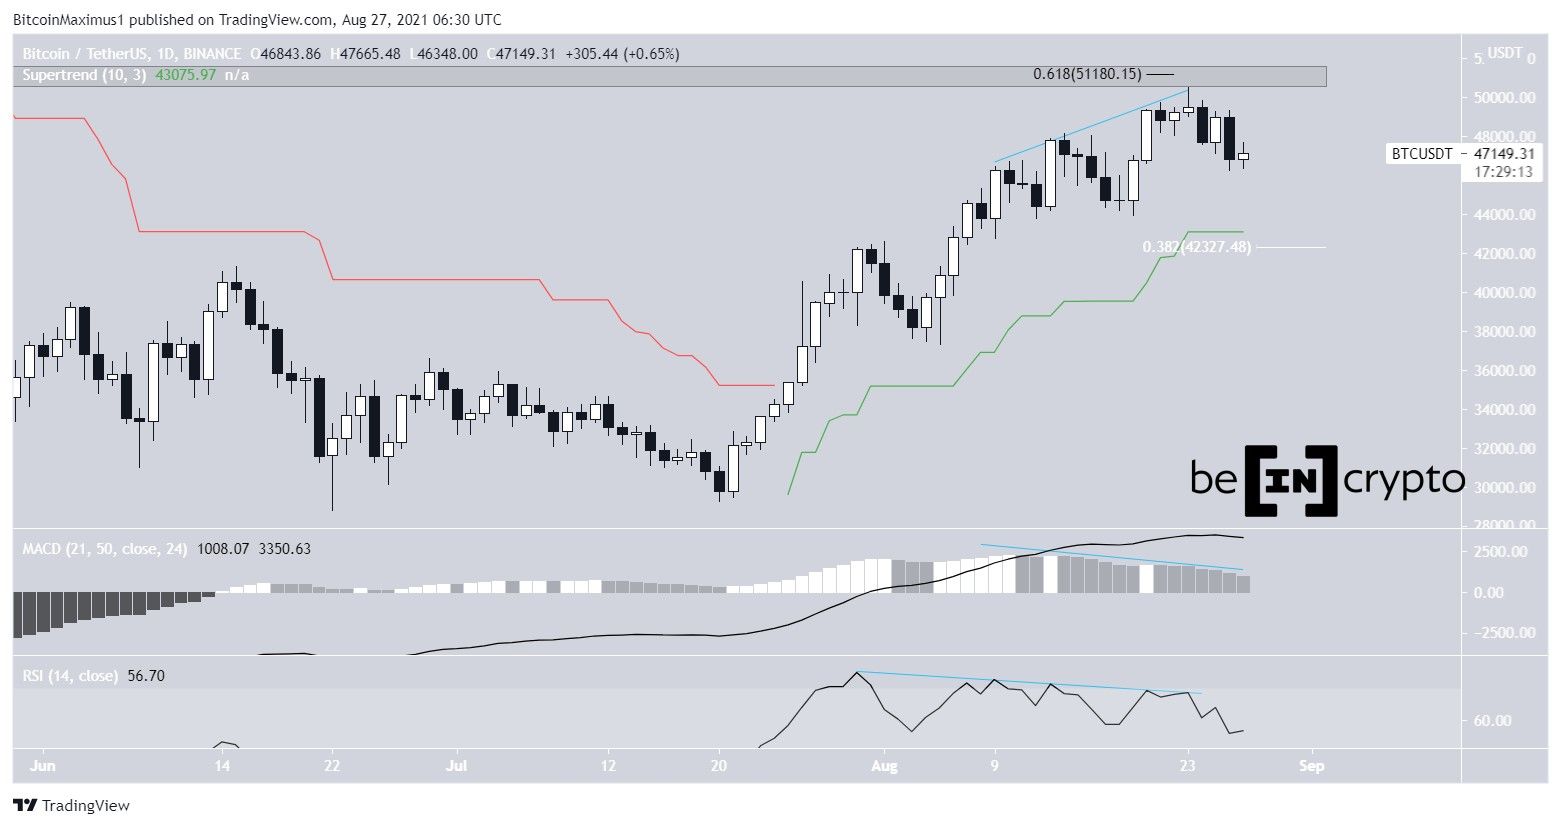
BTC has been decreasing since it reached a high of $50,500 on Aug 23. The high was very close to the 0.618 Fib retracement resistance level (black) at $51,200. In addition to this, the downward move was preceded by bearish divergences in both the RSI and the MACD.
The main support area is found at $42,400. This is the 0.382 Fib retracement support level (white) and coincides with the supertrend support line (green).
Breakdown from support
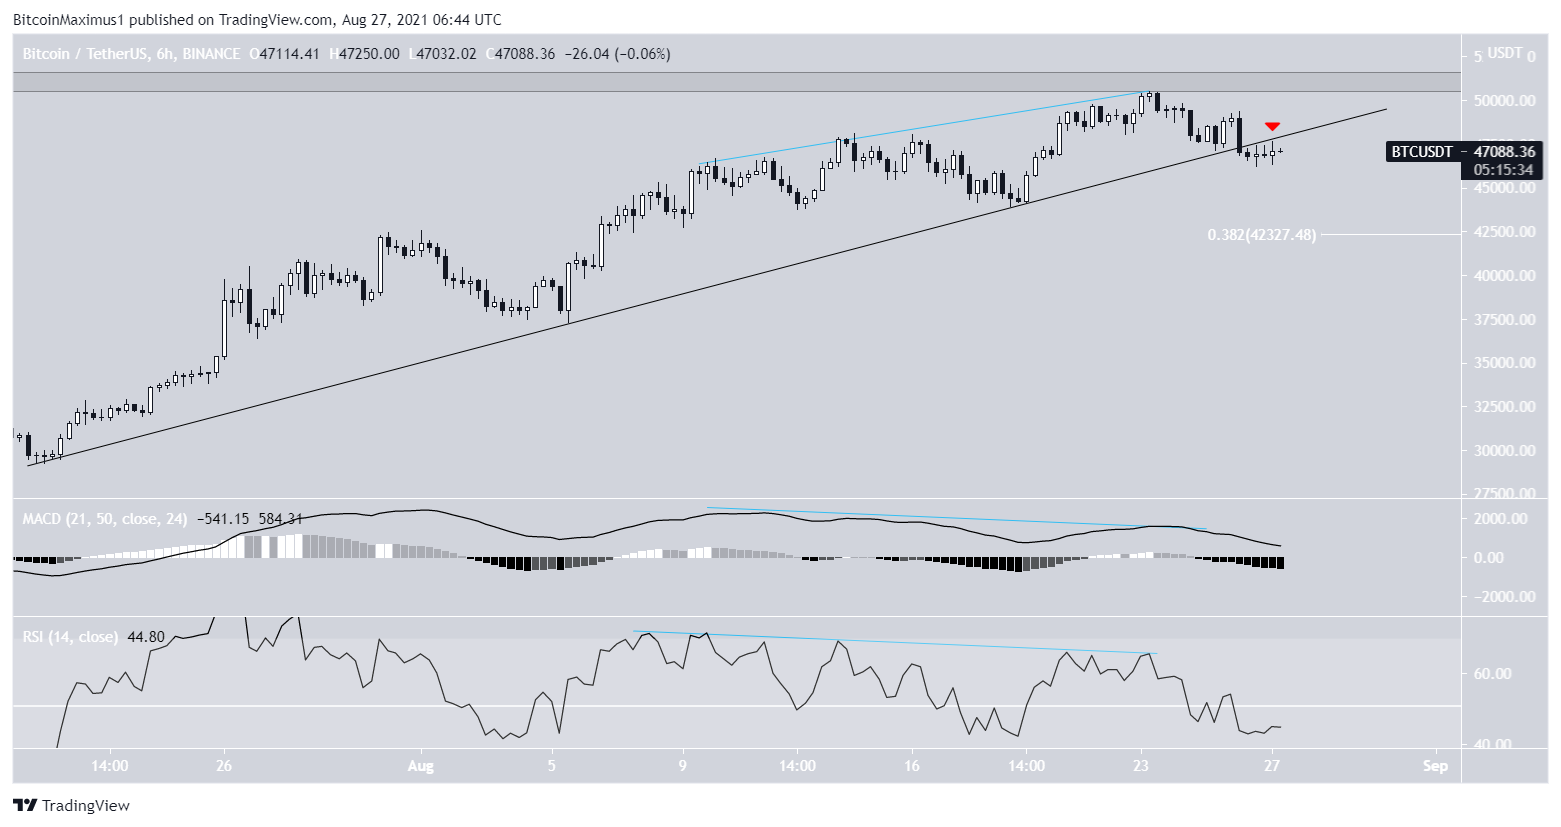
The six-hour chart aligns with the readings from the daily time frame. The ongoing decrease was preceded by bearish divergence in both the RSI and MACD.
Furthermore, a breakdown from an ascending support line transpired on Aug 26. Currently, BTC is in the process of validating the line as resistance (red icon).
Unless it manages to reclaim it, it’s likely that it will continue decreasing at least until it reaches the aforementioned support area at $42,400.
Neither the RSI nor the MACD has shown any bullish reversal signs, thus a continued decrease is likely.
Future movement
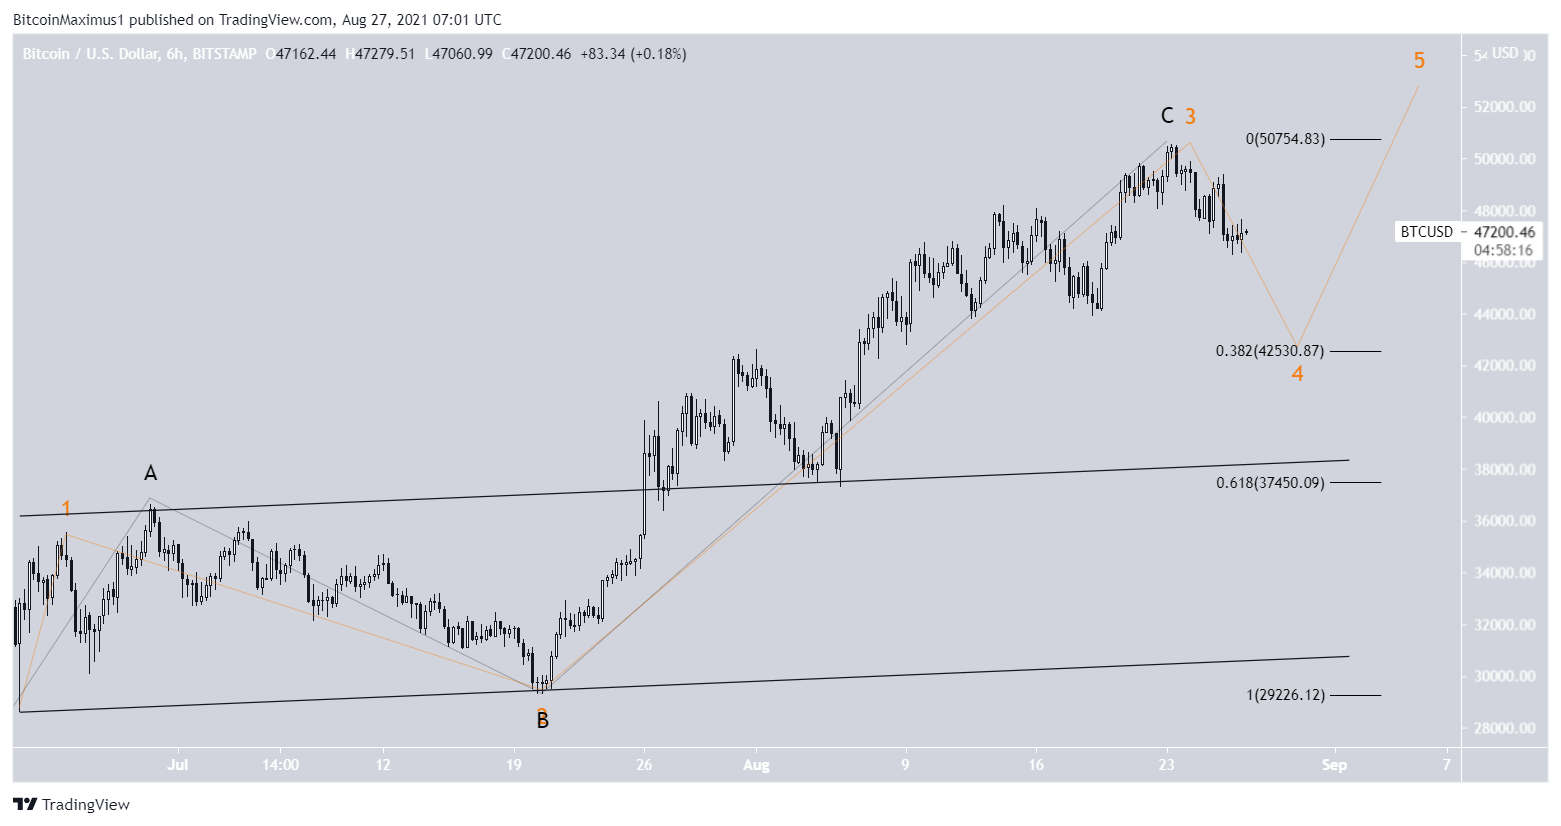
While the direction of the longer-term trend is not yet clear, both the bullish and bearish wave counts suggest a short-term decrease is expected.
If the completed upward movement was part of wave three of a bullish impulse (orange), we would expect a sharp wave four because of the concept of alternation.
If the movement is a completed A-B-C corrective structure (black) a downward move towards new lows could follow. In any case, a decrease towards at least the 0.382 Fib retracement support level is likely.
Currently, the possibility that the increase was an A-B-C structure and BTC will eventually see a lower low remains more likely.
For BeInCrypto’s previous Bitcoin (BTC) analysis, click here.
