


Bitcoin (BTC) is currently trading inside a short-term corrective pattern and could potentially break down from it.
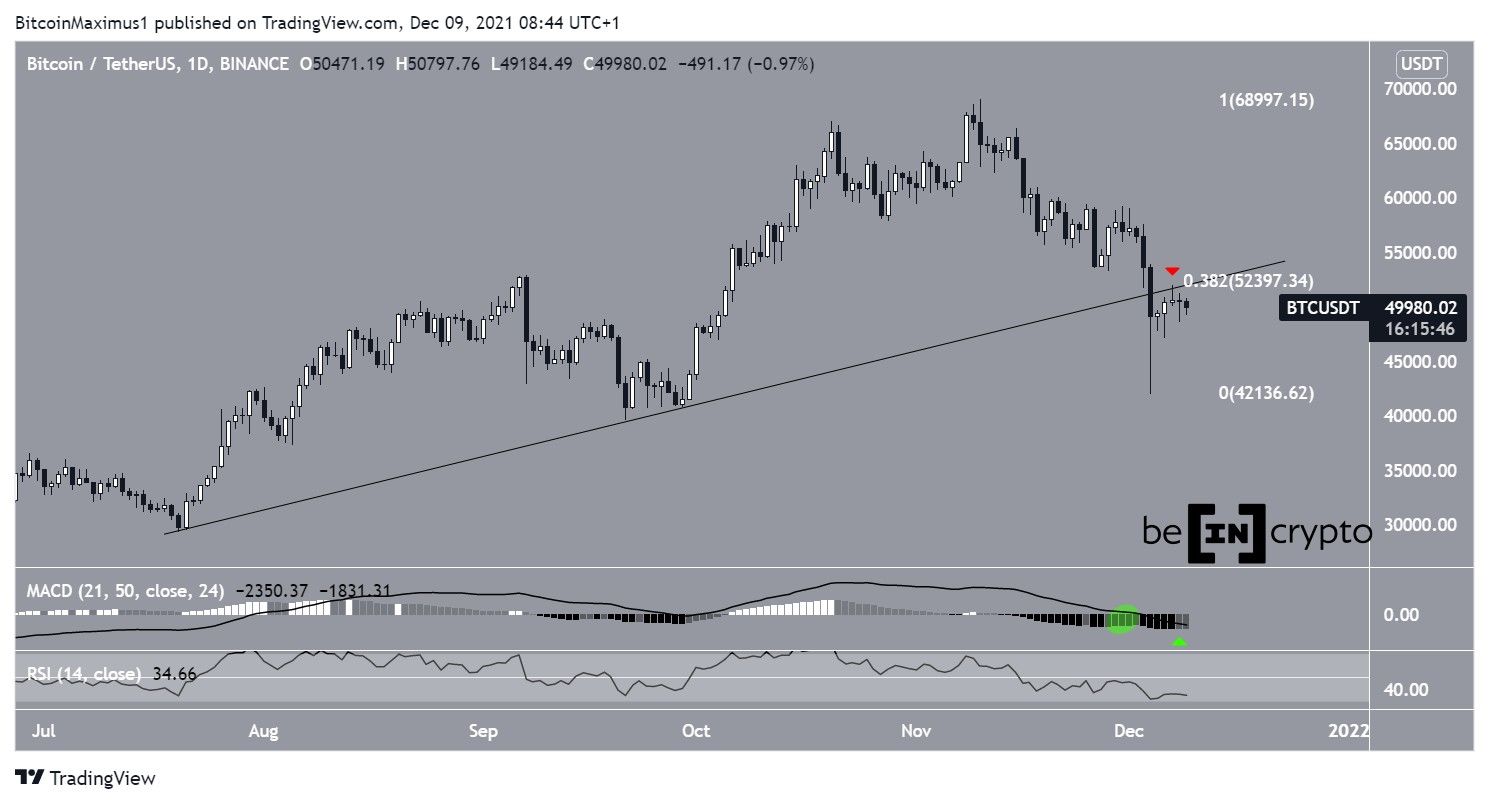
BTC has been mostly moving to the upside since rebounding on Dec 4, right after the price had reached a local low of $42,000. The upward move led to a high of $51,936 on Dec 7.
However, the upward movement served to validate the previous ascending support line as resistance (red icon). Since then, BTC has been falling. The rejection also coincided with the $52,400 resistance area, which is the 0.382 Fib retracement resistance level. Therefore, it’s a crucial resistance area that could cause further rejections.
In addition to this, technical indicators are still bearish.
The MACD, which is created by short and long-term moving averages (MA), is negative and falling. This means that the short-term MA is slower than the long-term average. Yesterday, it finally created a higher momentum bar (green icon), which is a sign that the MA has begun to gain steam. However, it remains to be seen if this will be a false signal (green circle), similar to what occurred between Nov 29 and Dec 2.
The RSI, which is a momentum indicator, is decreasing and is below 50. This is considered a sign of a bearish trend.
Short-term BTC channel
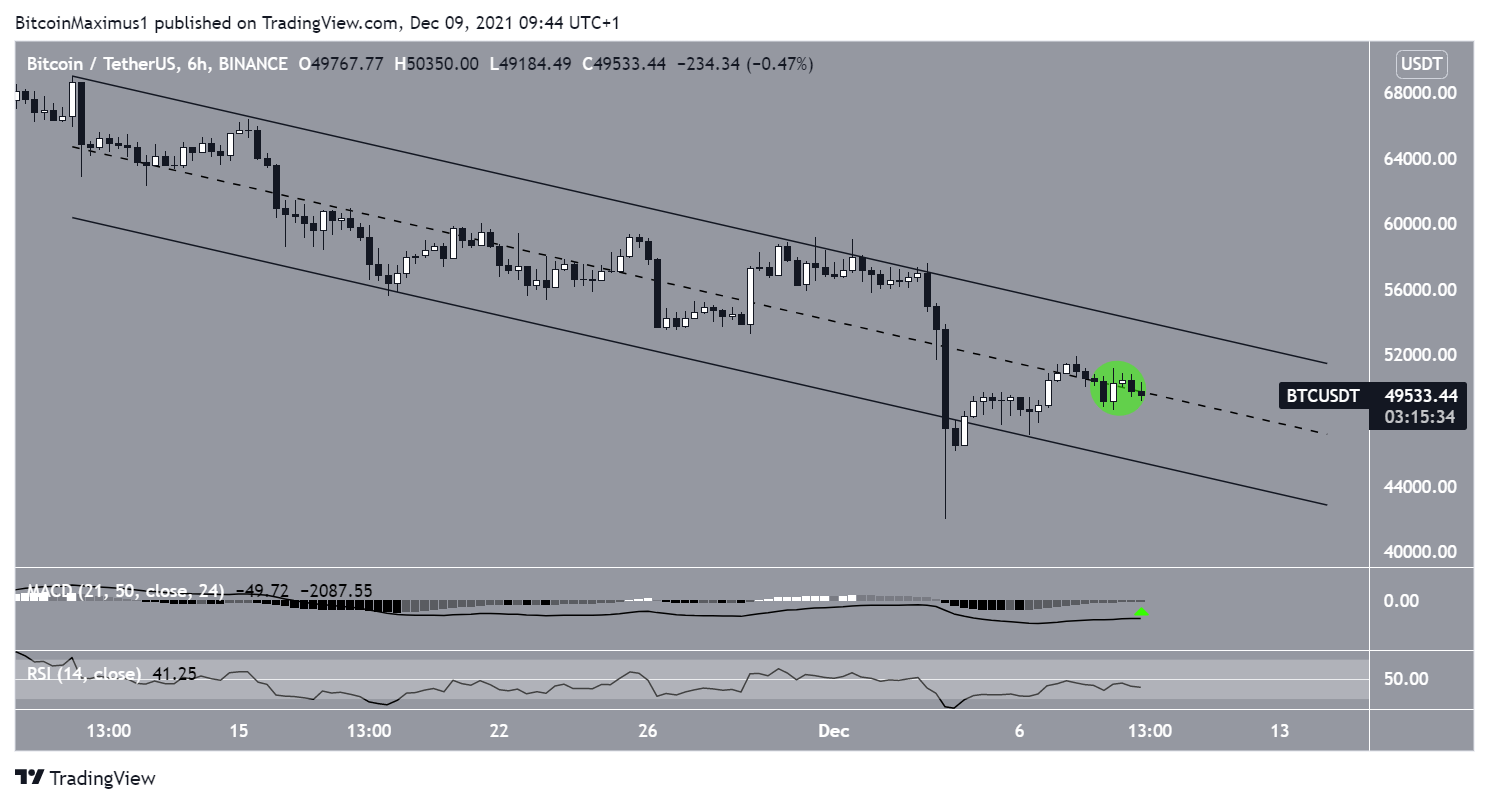
The six-hour chart shows that BTC is trading inside a descending parallel channel since the Nov 10 all-time high price.
These types of channels are often considered to contain corrective patterns, meaning that a breakout from it would be expected.
However, BTC is still trading right at the midline of the channel (green circle). In order for the possibility of a breakout to gain legitimacy, it would have to reclaim this line.
Unlike the daily time frame, both the MACD and RSI are increasing. However, the former is still negative and the latter is below 50.
Ongoing bounce
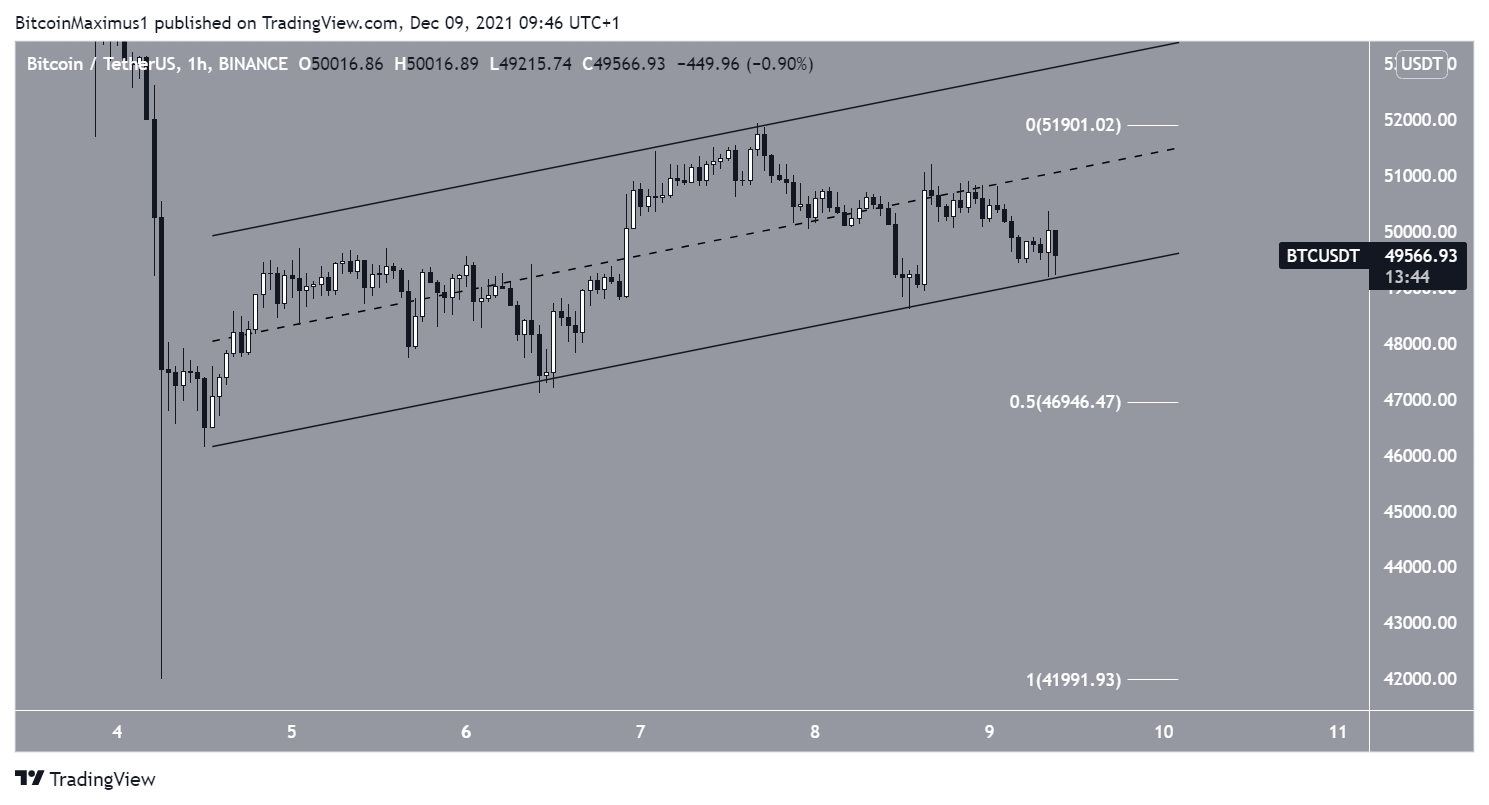
Finally, the one-hour chart suggests that BTC will break down in the short term.
The main reason for this is that it’s trading in the lower portion of an ascending parallel channel. Furthermore, it has touched its support line for the third time.
If a breakdown occurs, the main support area would be found at $46,950. This is the 0.5 Fib retracement support level and is a suitable area for the creation of a higher low.
For BeInCrypto’s previous Bitcoin (BTC) analysis, click here.


