


Bitcoin (BTC) moved incrementally last week, opening and closing near the same price of $35,700.
Technical indicators and the price action are providing mixed signs. However, the wave count is leaning bearish.
Bitcoin consolidates
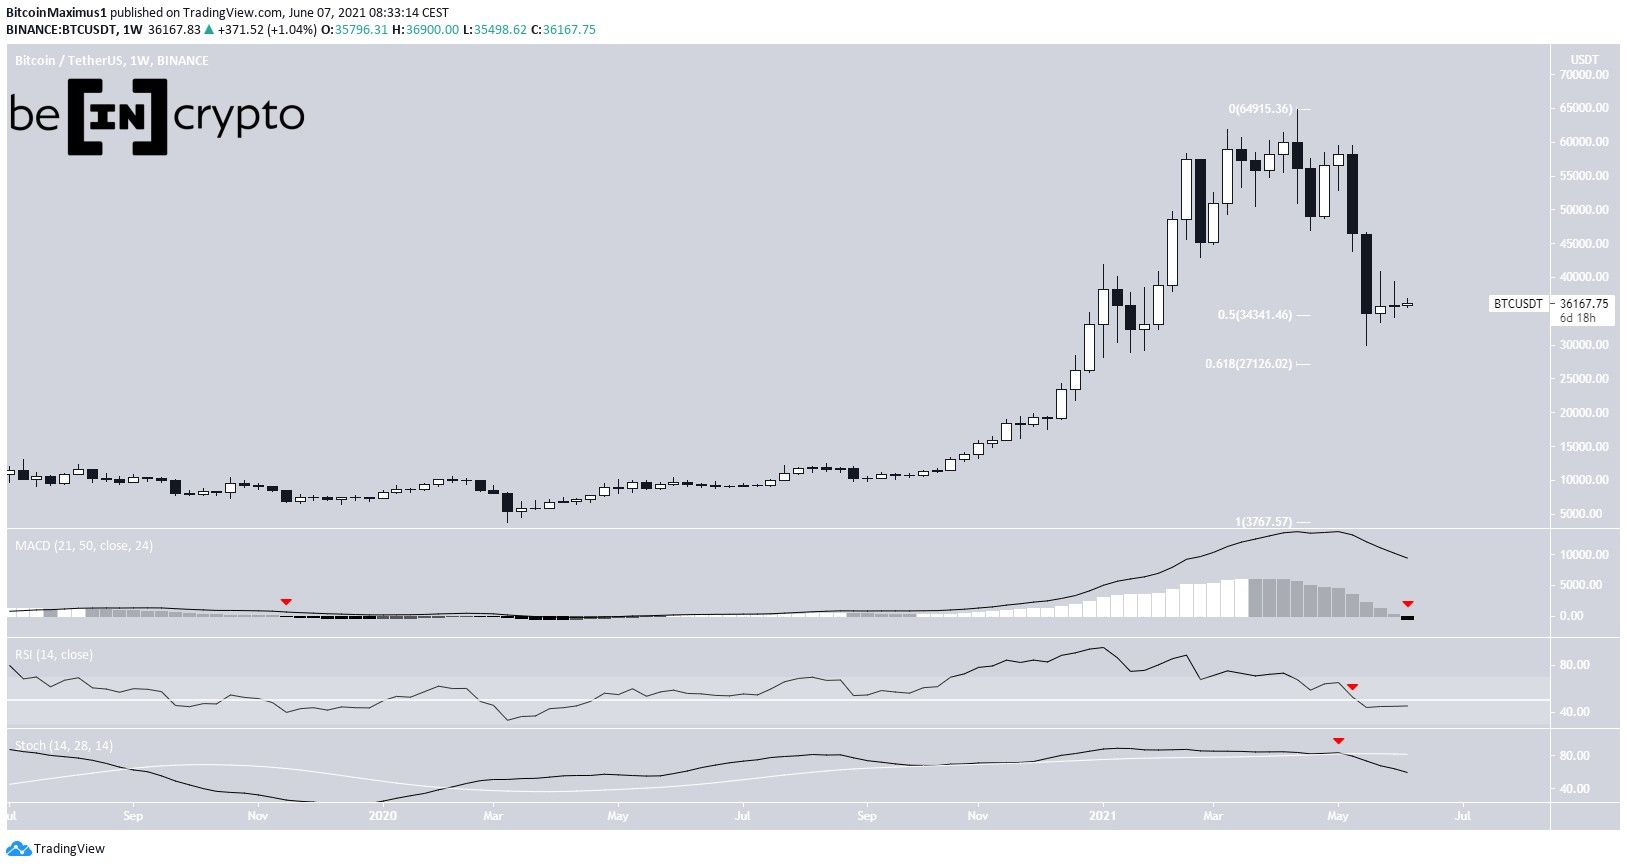
Bitcoin experienced some volatility last week, moving from a low of $34,153 to a high of $39,476. However, both the opening and close prices were near $35,700, creating a doji candle in the weekly time frame.
Technical indicators in the weekly time frame are bearish. The MACD has fallen into negative territory for the first time since November 2019. The RSI has also just crossed below 50 and the Stochastic oscillator has made a bearish cross (red icons).
Currently, BTC is trading at the 0.5 Fib retracement support level at $34,340. The next support is at $27,125, which is the 0.618 Fib retracement support level.
Future movement
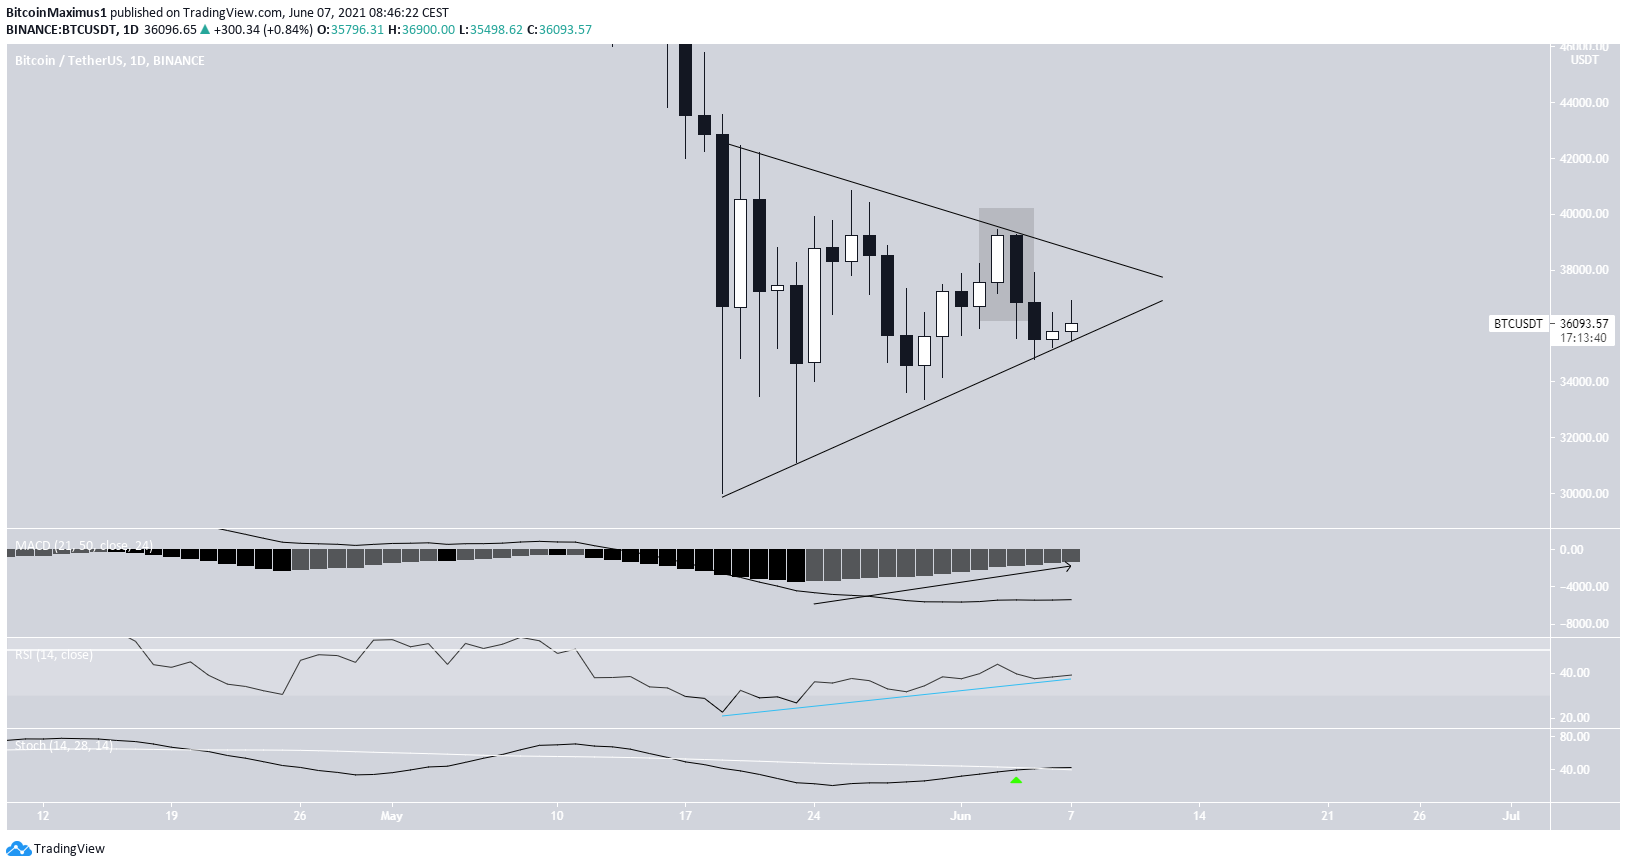
Since the May 19 bottom, BTC has been trading inside a symmetrical triangle. It’s currently at the support line of this triangle, which is normally considered a neutral pattern. It was rejected by the resistance line on June 4 and created a bearish engulfing candlestick the next day.
Unlike the weekly chart, technical indicators are bullish. The Stochastic oscillator has made a bullish cross (green icon), and both the MACD and RSI are increasing.
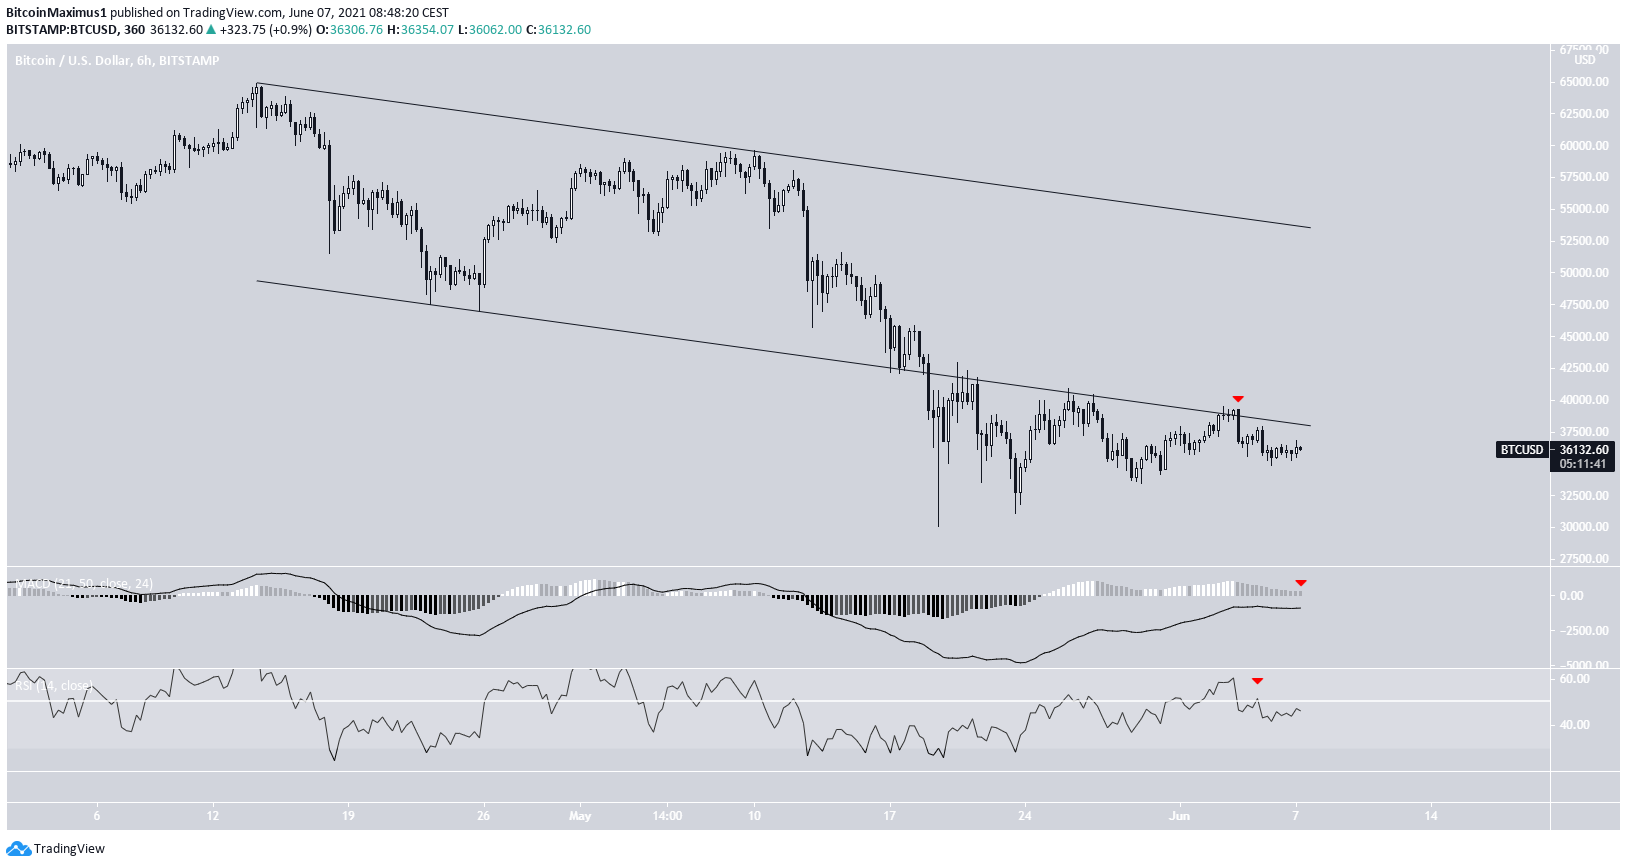
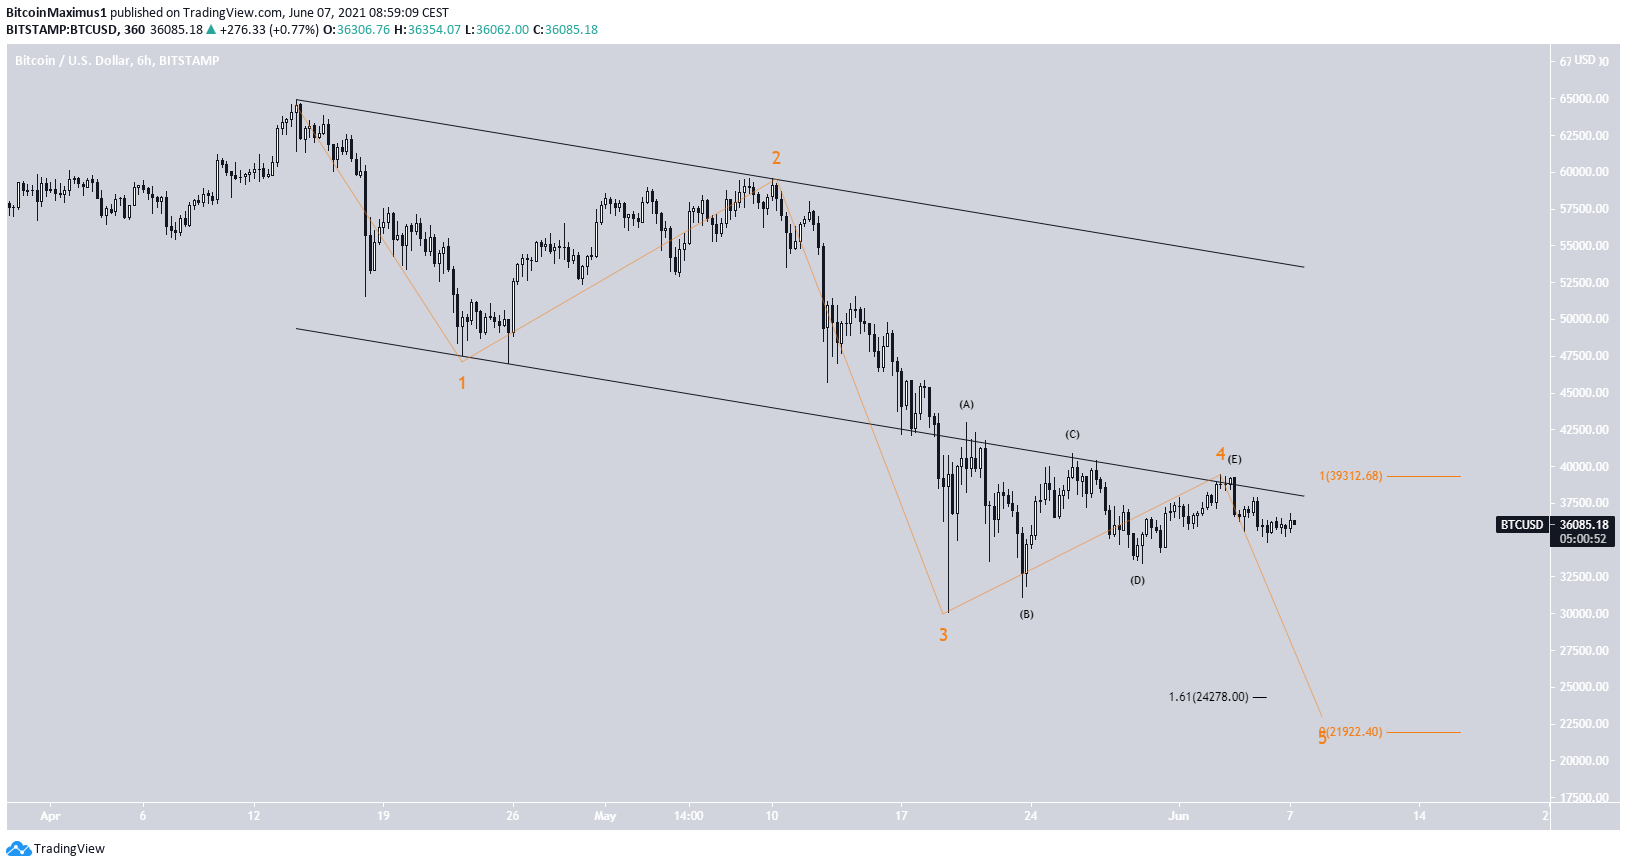
The six-hour chart is again bearish. On June 4, the support line of a parallel descending channel acted as resistance. It rejected BTC, creating the previously outlined bearish engulfing candlestick.
Until it reclaims the line, the trend cannot be considered bullish.
Wave count
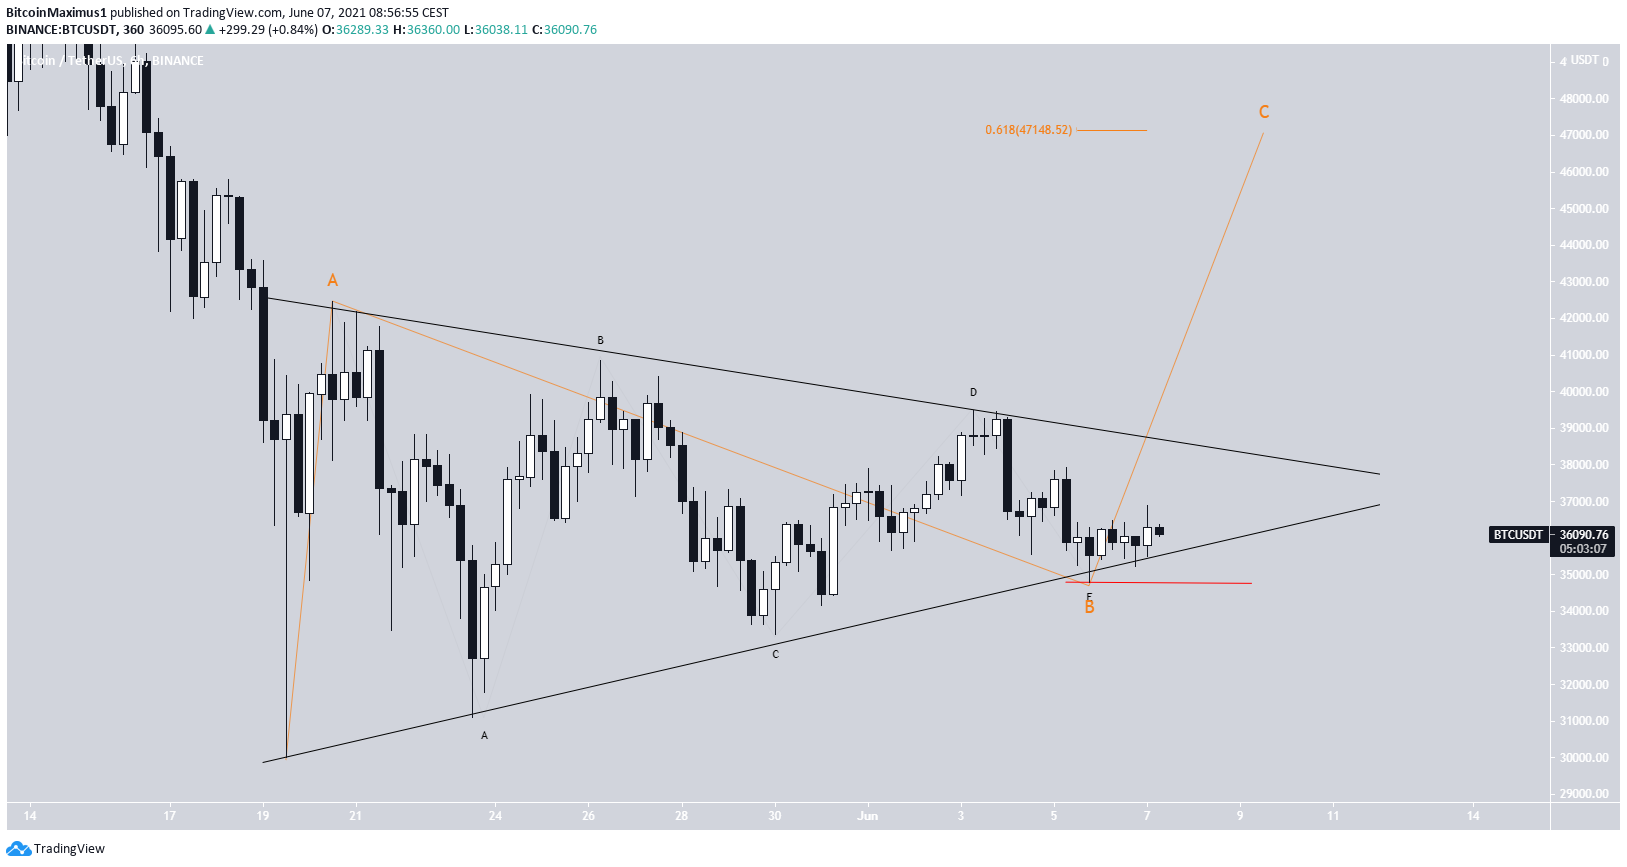
The wave count is not entirely clear. The bullish scenario indicates that the entire movement inside the triangle was part of the B wave. If so, BTC could soon see an upward move toward $48,000.
A decrease below the $34,800 low (red line) would invalidate this scenario.
In this case, the bearish count would indicate that the entire triangle is part of wave four of a bearish impulse. A potential target for the bottom of the downward movement would be found between $24,278 and $21,922. These targets are found using an external retracement and Fib projection.
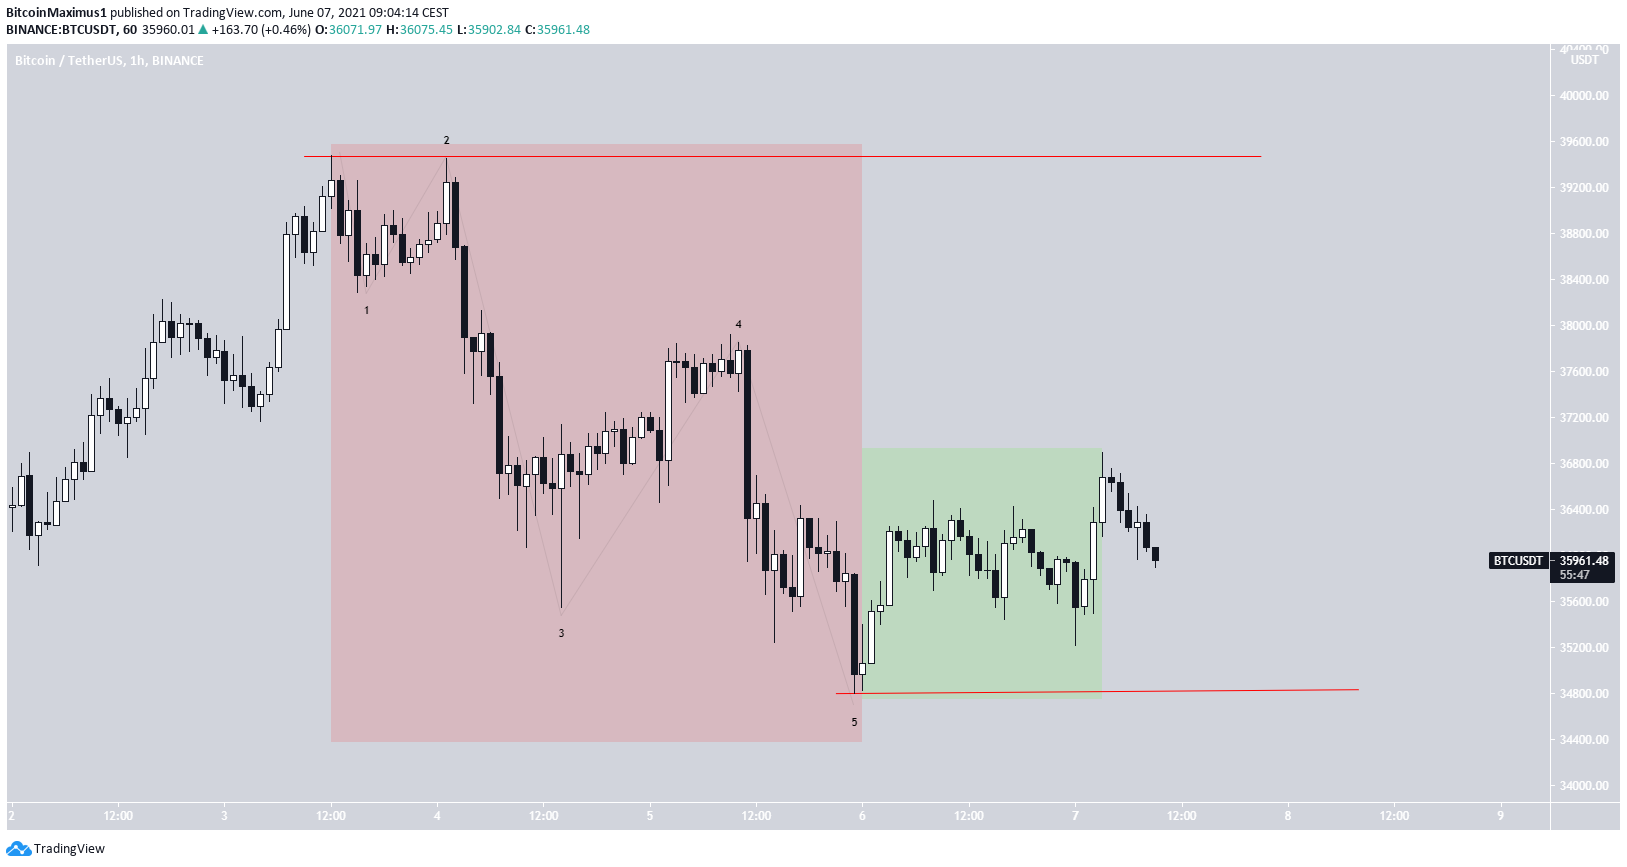
The movement since the bearish engulfing candlestick looks like the beginning of a bearish impulse (highlighted in red). Conversely, the movement of the lows (highlighted in green) looks corrective. This indicates that the bearish possibility is more likely.
In any case, a decrease below the $34,800 low (red line) would confirm that the bearish count is playing out, while an increase above the $39,474 high (red line) would confirm that the bullish count is in play.
For the longer-term wave count, click here.
For BeInCrypto’s previous bitcoin (BTC) analysis, click here.


