

Bitcoin (BTC) attempted to move upwards on Sept 27 but was rejected by the $44,000 resistance area.
While BTC is still trading inside the upper portion of a descending parallel channel, the price action is lacking bullish signals.
BTC gets rejected
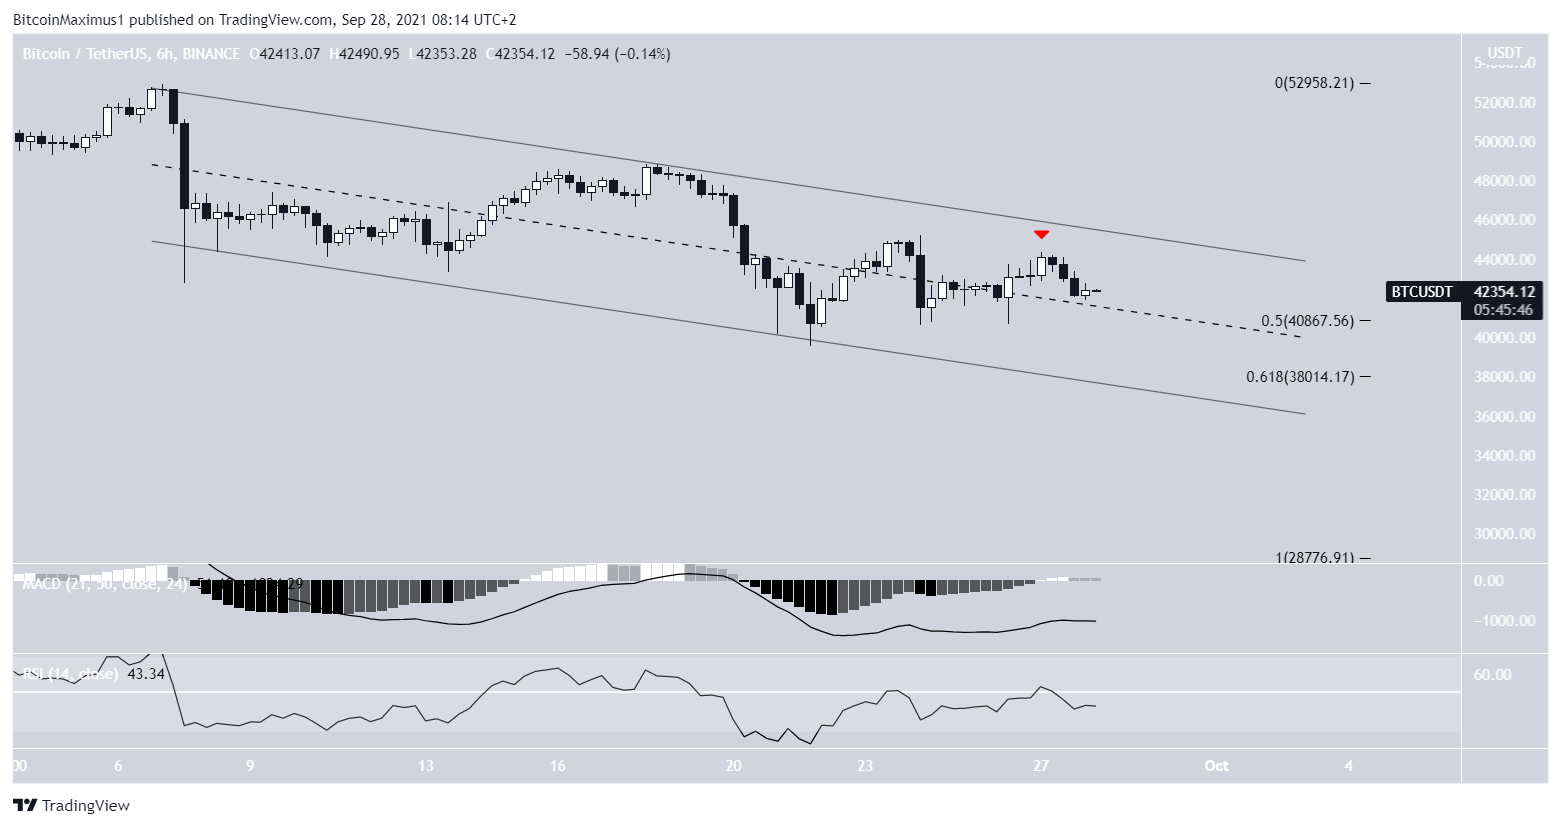
On Sept 27, BTC made an attempt at moving above the $44,000 area but was promptly rejected (red icon). The area had acted as support in August and the beginning of September but turned to resistance after the breakdown on Sept 20. The rejection created an upper wick and a bearish candlestick.
Besides trading below resistance, technical indicators for BTC have turned bearish as both the RSI and MACD are decreasing. The MACD has just crossed into negative territory while the RSI is below 50.
If BTC were to continue moving downwards, the next closest support area would be found at $38,000.

Current channel
The six-hour chart shows a descending parallel channel, which usually contains corrective structures.
Currently, BTC is trading inside its upper portion. Furthermore, it’s trading just above the 0.5 Fib retracement support level.
Despite being above a confluence of support levels, technical indicators are bearish/undecided. The MACD is negative and has lost its strength while the RSI has just fallen below 50.
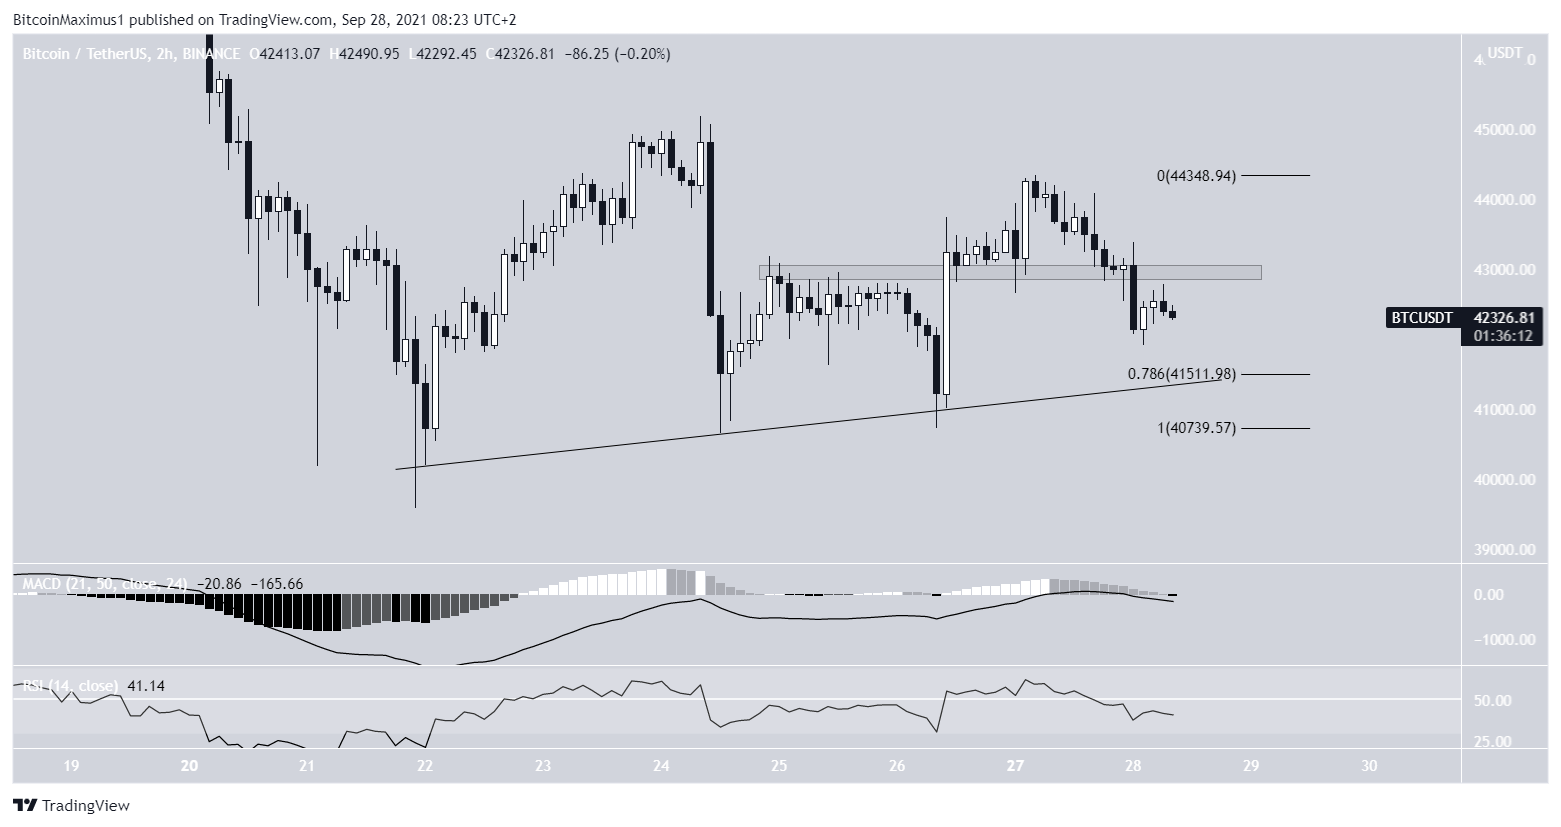
The two-hour chart shows that BTC is following an ascending support line and has made three higher lows since Sept 21. While this can be seen as a bullish structure, the price action is not bullish.
The previous resistance area at $43,000 that was expected to act as support did not. On the contrary, BTC fell right through it. Furthermore, both the MACD and RSI have turned bearish.
While there is very strong support at $41,500, created by the 0.786 Fib retracement support level and the ascending support line, the price action does not seem bullish.
Wave count
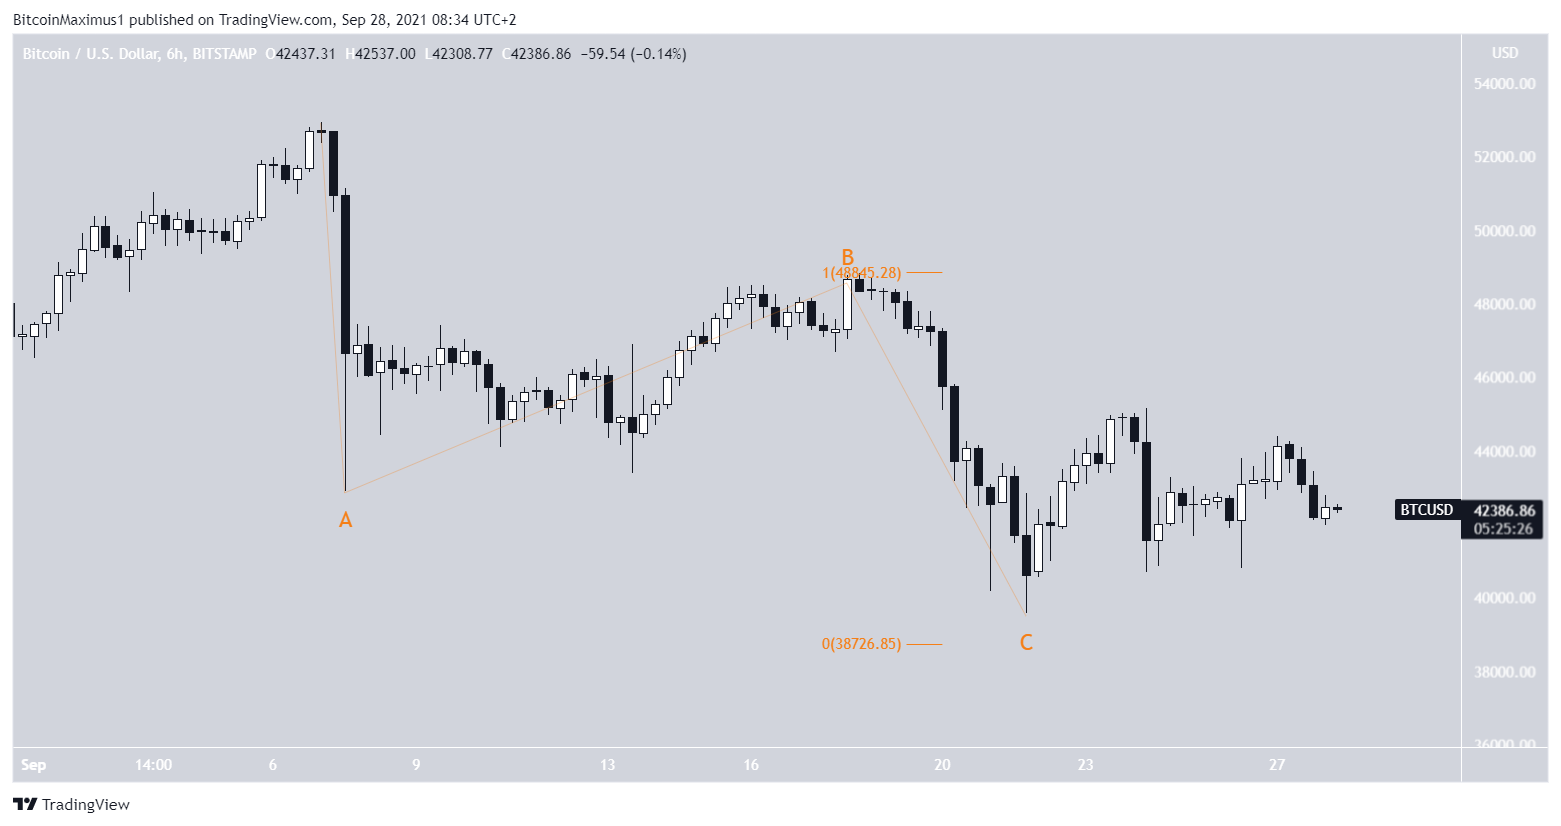
The most likely wave count still indicates that the decrease from Sept 7 to Sept 21 was part of an A-B-C corrective structure, in which waves A:C had an exact 1:1 ratio. This is also supported by the presence of the descending parallel channel.
However, the movement since the low does not seem impulsive, casting some doubt on the possibility of this being the correct count.
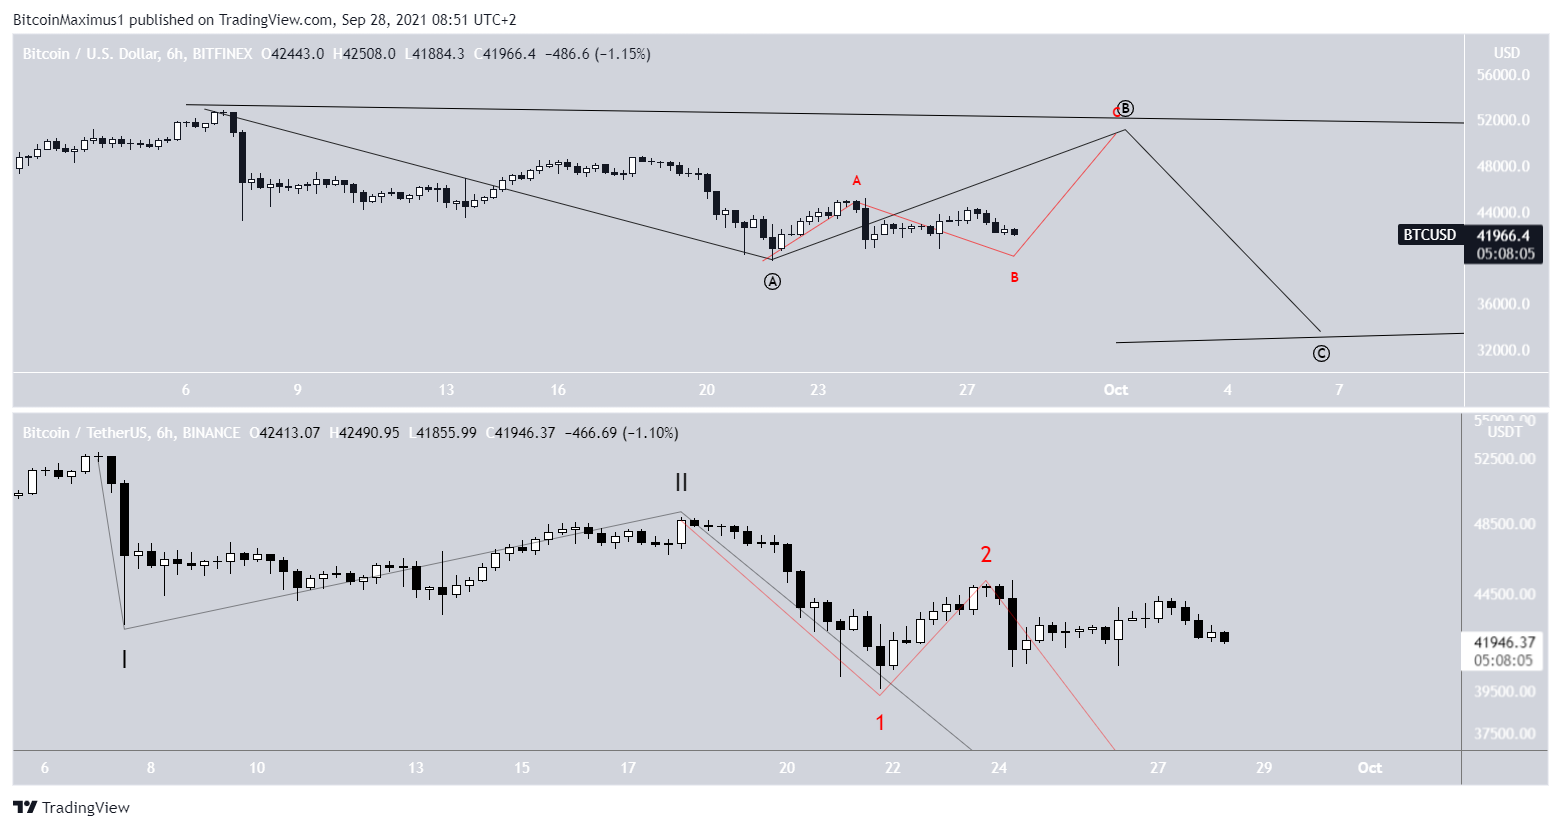
Alternative counts could see the movement as a flat A-B-C corrective structure (upper image), or in the more bearish case a 1/2-/1-2 wave structure (lower image).
At the current time, the correct count cannot be determined.
For BeInCrypto’s previous Bitcoin (BTC) analysis, click here.
Disclaimer
In line with the Trust Project guidelines, this price analysis article is for informational purposes only and should not be considered financial or investment advice. BeInCrypto is committed to accurate, unbiased reporting, but market conditions are subject to change without notice. Always conduct your own research and consult with a professional before making any financial decisions. Please note that our Terms and Conditions, Privacy Policy, and Disclaimers have been updated.
