


Bitcoin (BTC) has been moving downward since reaching a new all-time high of $67,000 on Oct 20. It’s possible that a local top has been reached, and BTC could drop back in the short term before resuming its upward movement.
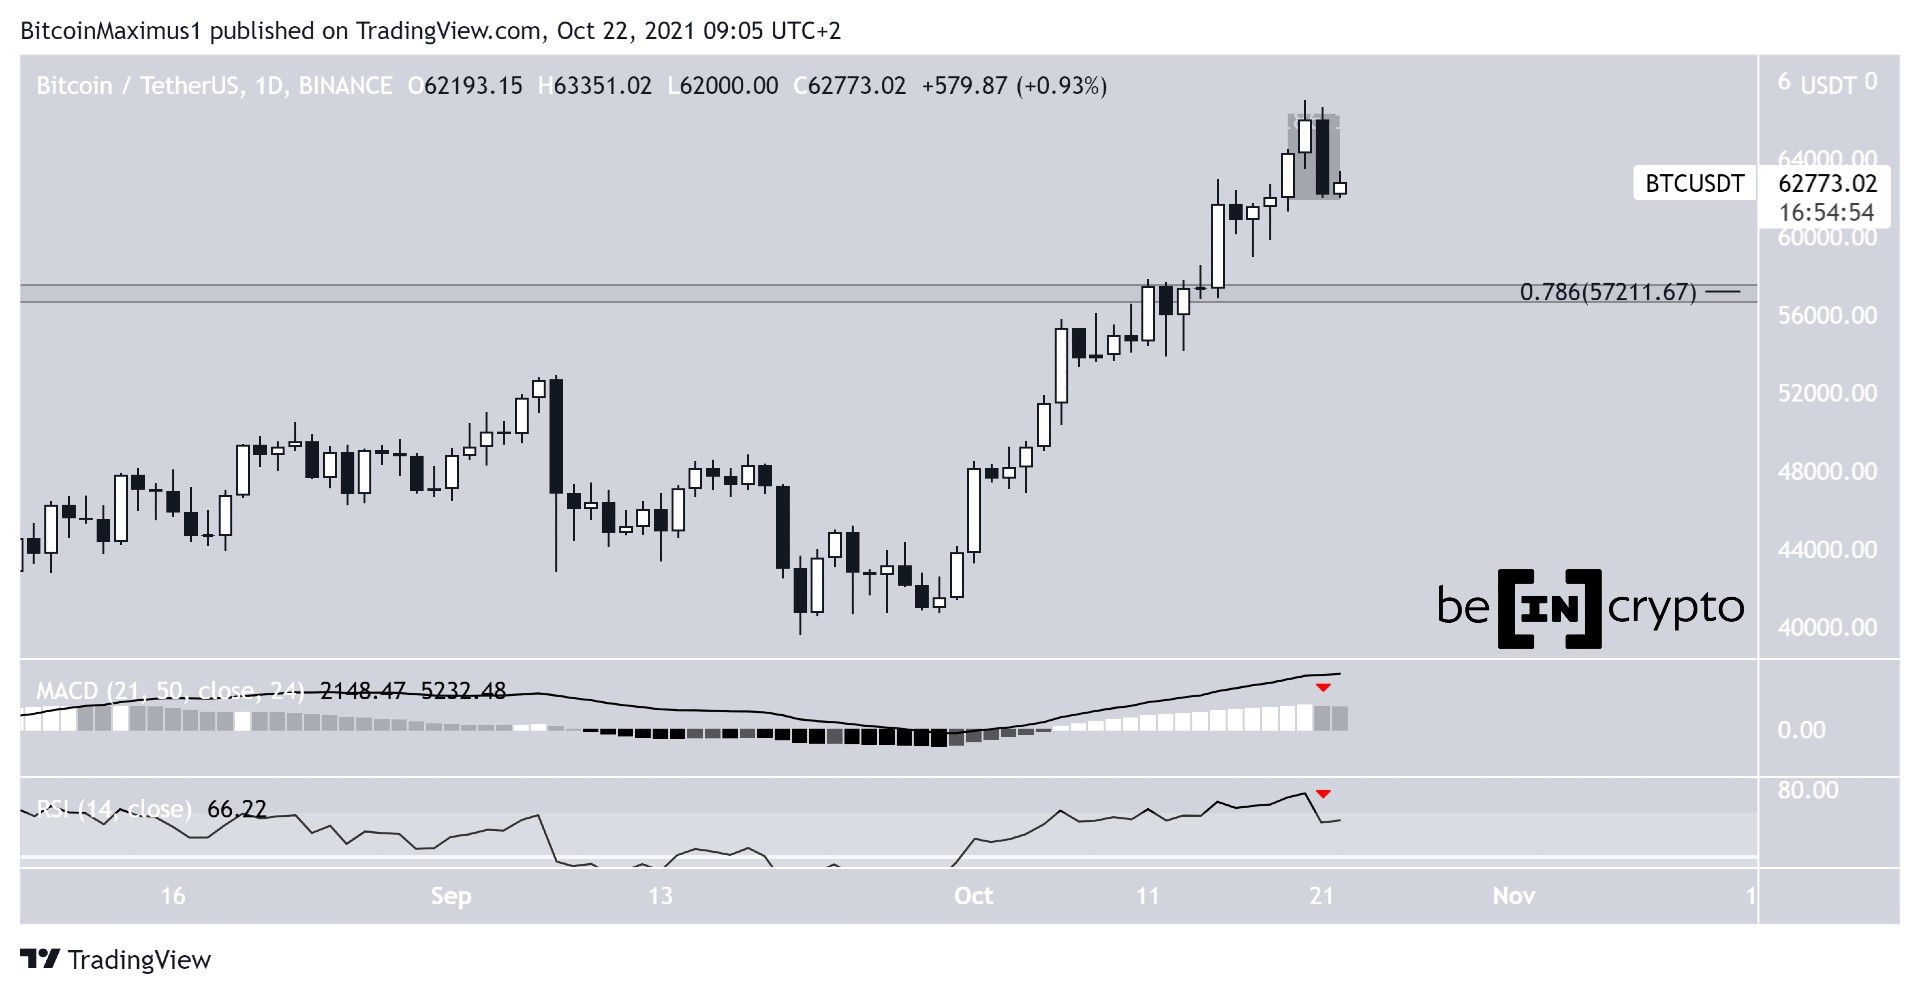
Bitcoin decreased considerably on Oct 21, falling from a high of $66,639 to a low of $62,000. This created a bearish engulfing candlestick, meaning that the upward movement from two days ago was completely negated.
While technical indicators in the daily time frame are bullish, they are showing considerable signs of weakness.
The MACD, which is created by a short and long-term moving average (MA), has created one lower momentum bar. The overall indicator is still positive, showing that the short-term trend is moving faster than the long-term trend. However, the lower momentum bar is a sign that the short-term trend is losing strength.
Furthermore, the RSI, which is a momentum indicator, has fallen below 70. The drop below 70 is a sign that momentum is weakening, though it’s still above 50, indicating that momentum is still bullish.
The closest major support area is found at $57,200. This is the previous resistance area created by the 0.786 Fib retracement resistance level.
Ongoing BTC drop
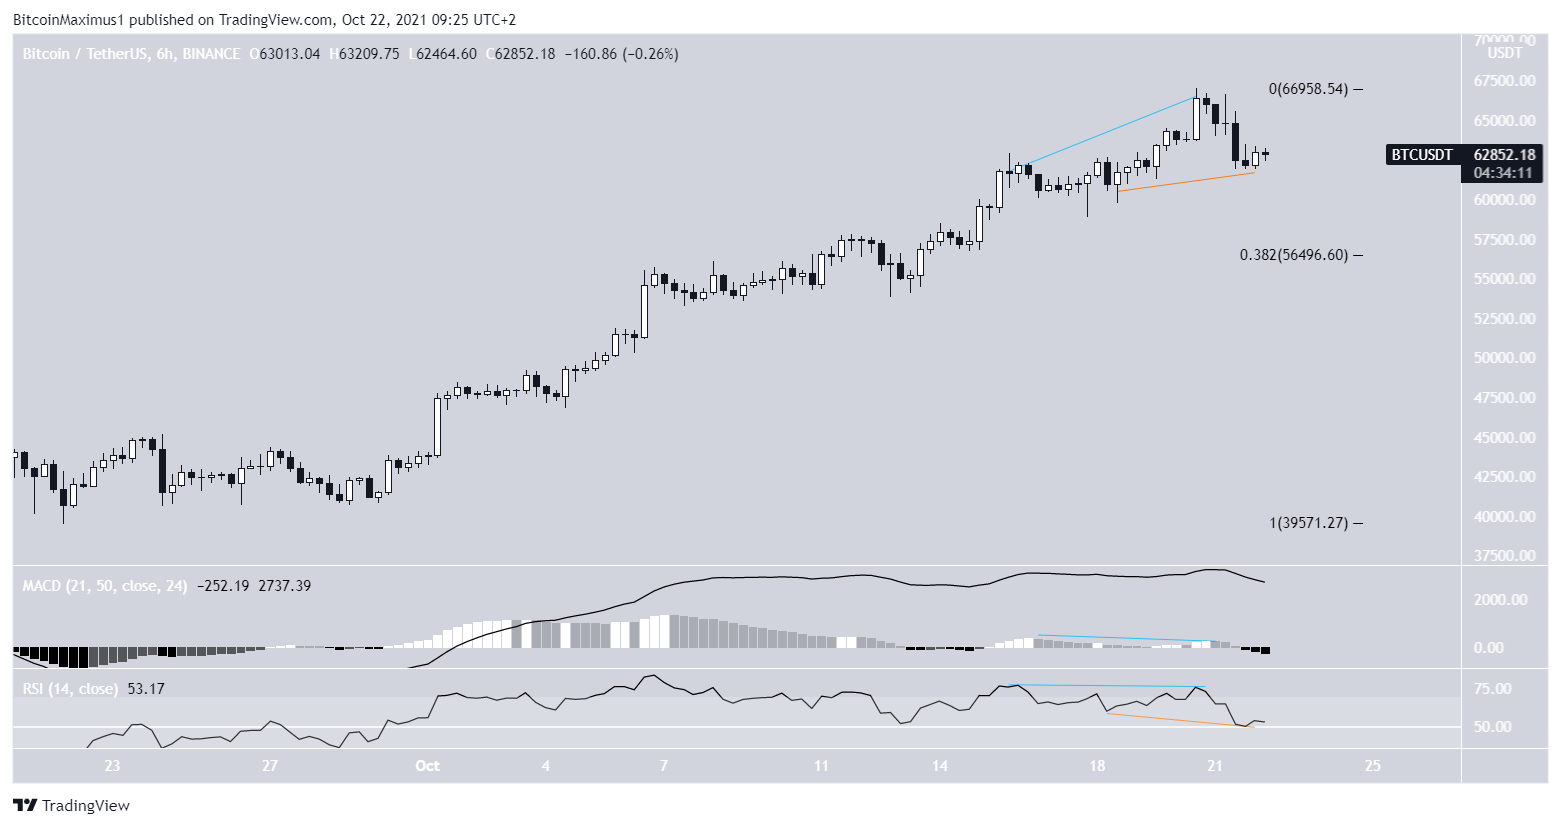
The six-hour chart shows that the downward move was preceded by bearish divergences in both the RSI and MACD (blue). This is a sign that the price increase was not accompanied by an increase in buying power and often precedes downward movements.
However, since then, the RSI has generated a hidden bullish divergence (orange). It remains to be seen if this divergence will be invalidated with another price decrease or if it will cause another rally.
The 0.382 Fib retracement level of the entire upward movement is found at $56,500, very close to the previously outlined support area at $57,200, strengthening its significance.
Wave count
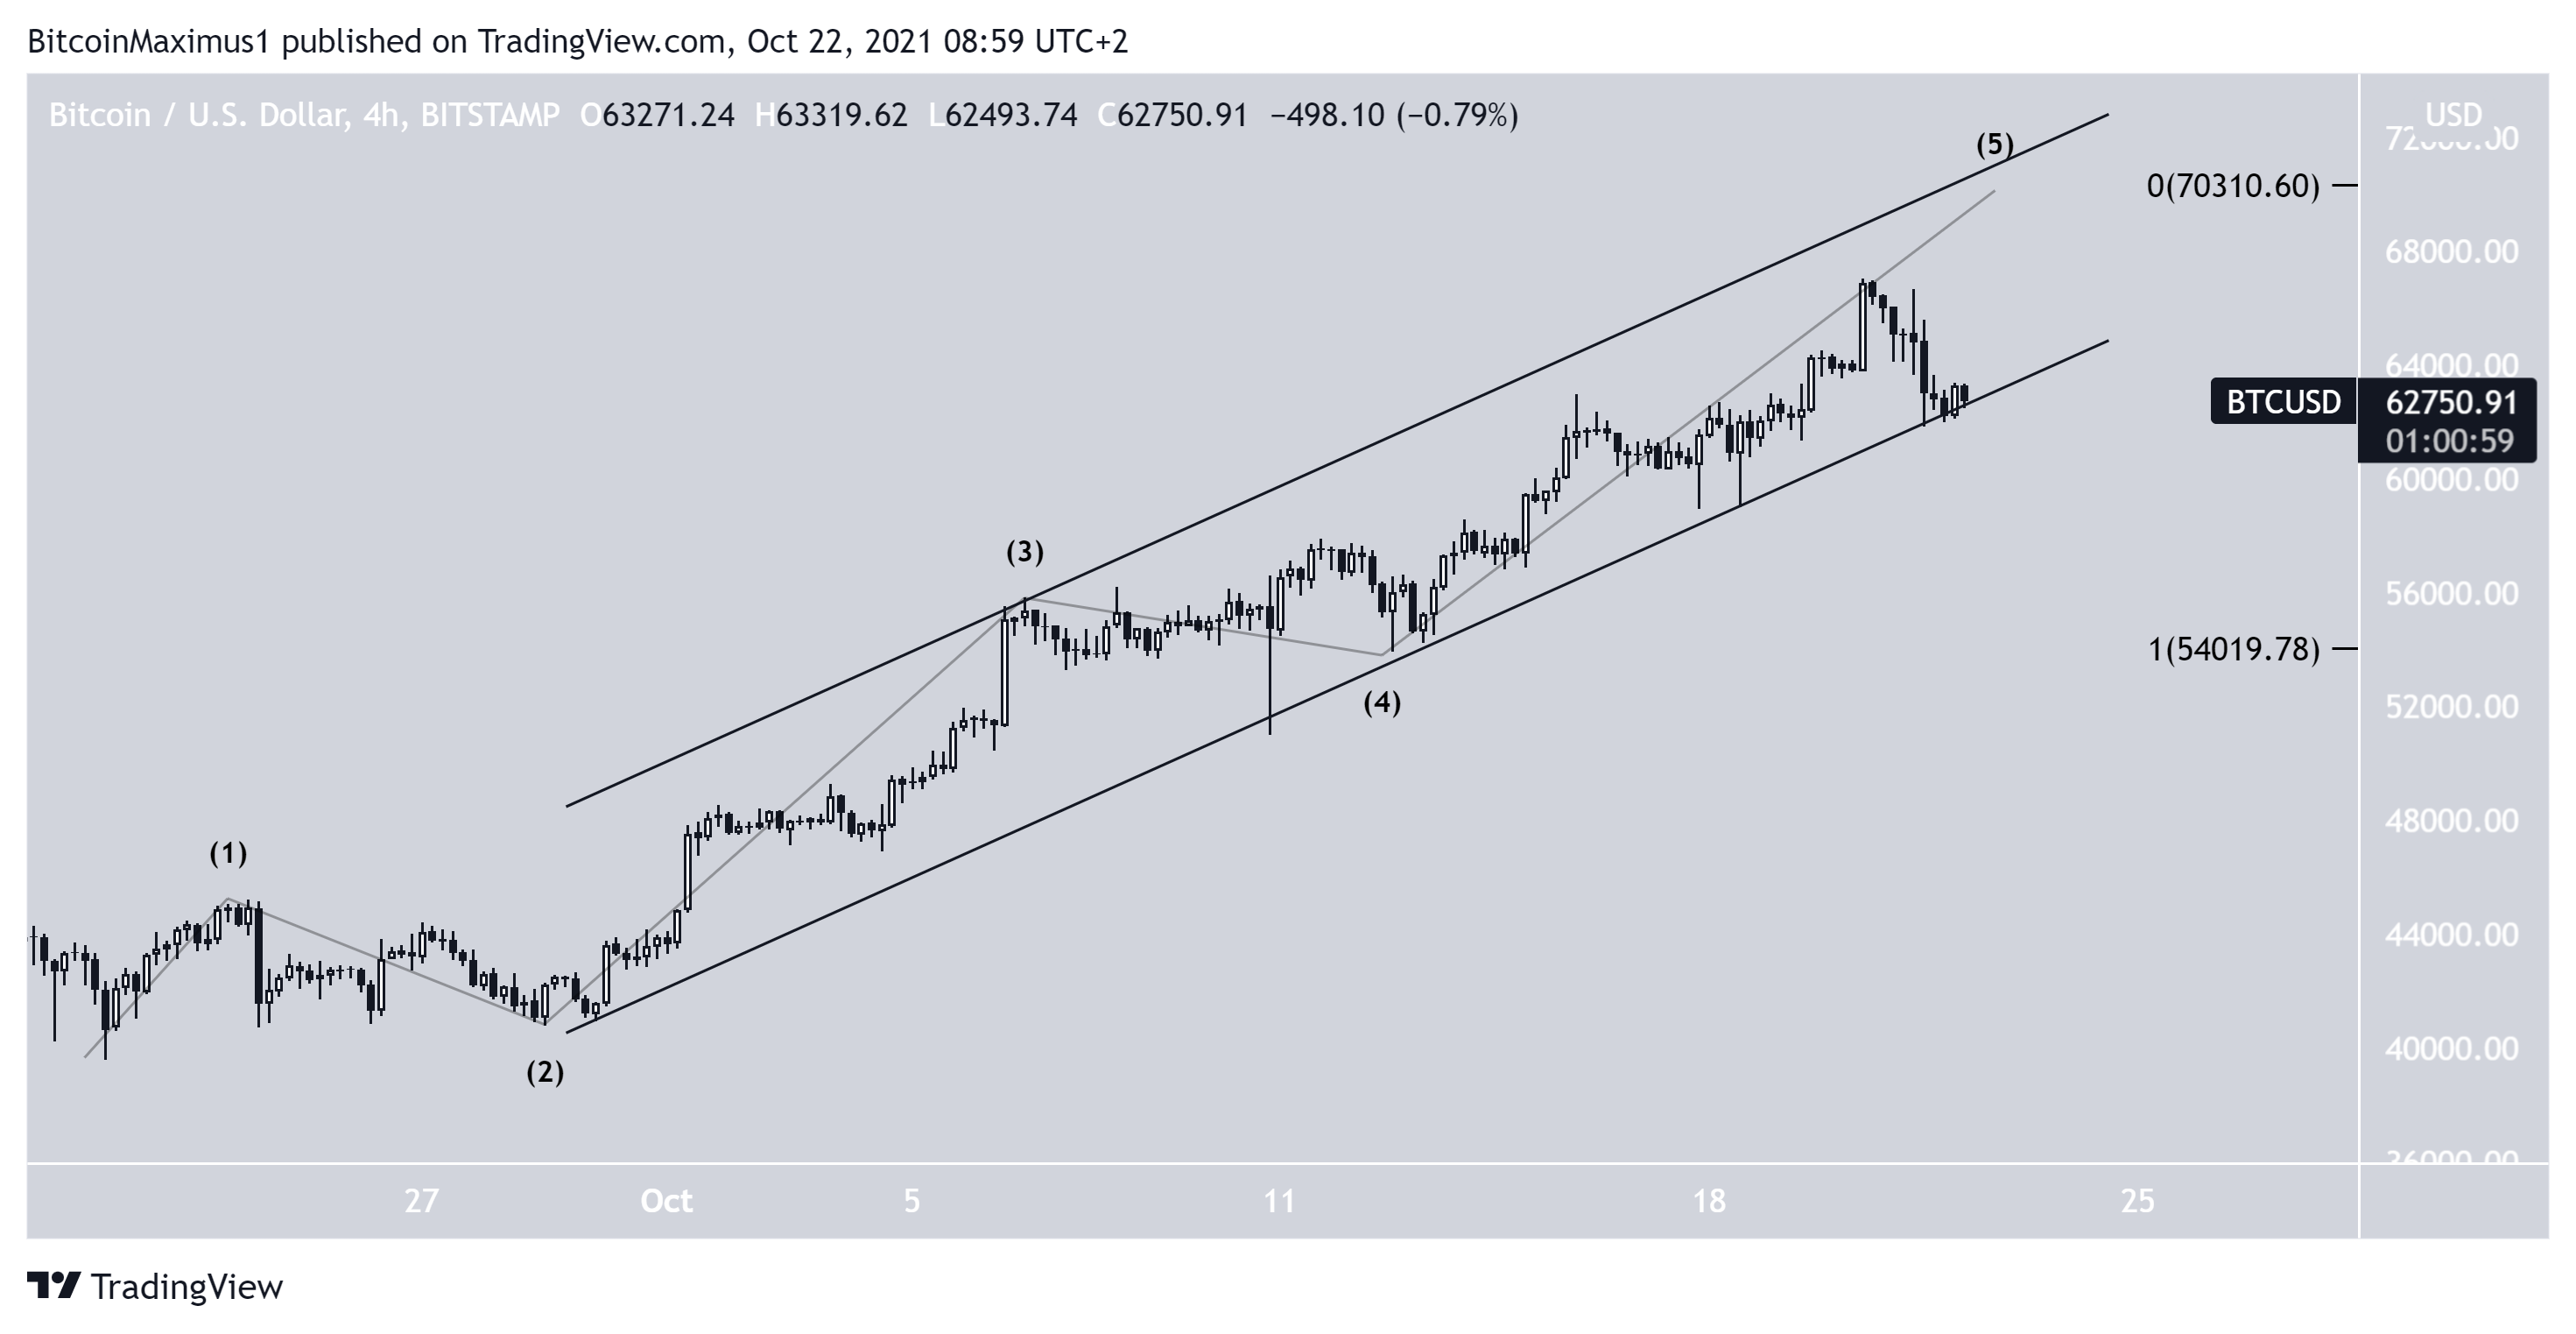
The wave count suggests that BTC has potentially completed wave five of a bullish impulse (black). This means that this portion of the upward movement has come to an end. The completion of this impulse would be confirmed by a breakdown from the ascending parallel channel.
The channel is created by connecting the lows of waves two and four. Breaking down below this level would be a strong sign that the upward move has ended.
If this occurs, BTC would be expected to drop towards the $57,200 support area. If the price rebounds, it could increase to $70,000 before dropping.
In any case, BTC is likely approaching the local top of its upward movement. Following this, the long-term wave count suggests BTC will eventually move above $100,000.
For BeInCrypto’s previous Bitcoin (BTC) analysis, click here.


