


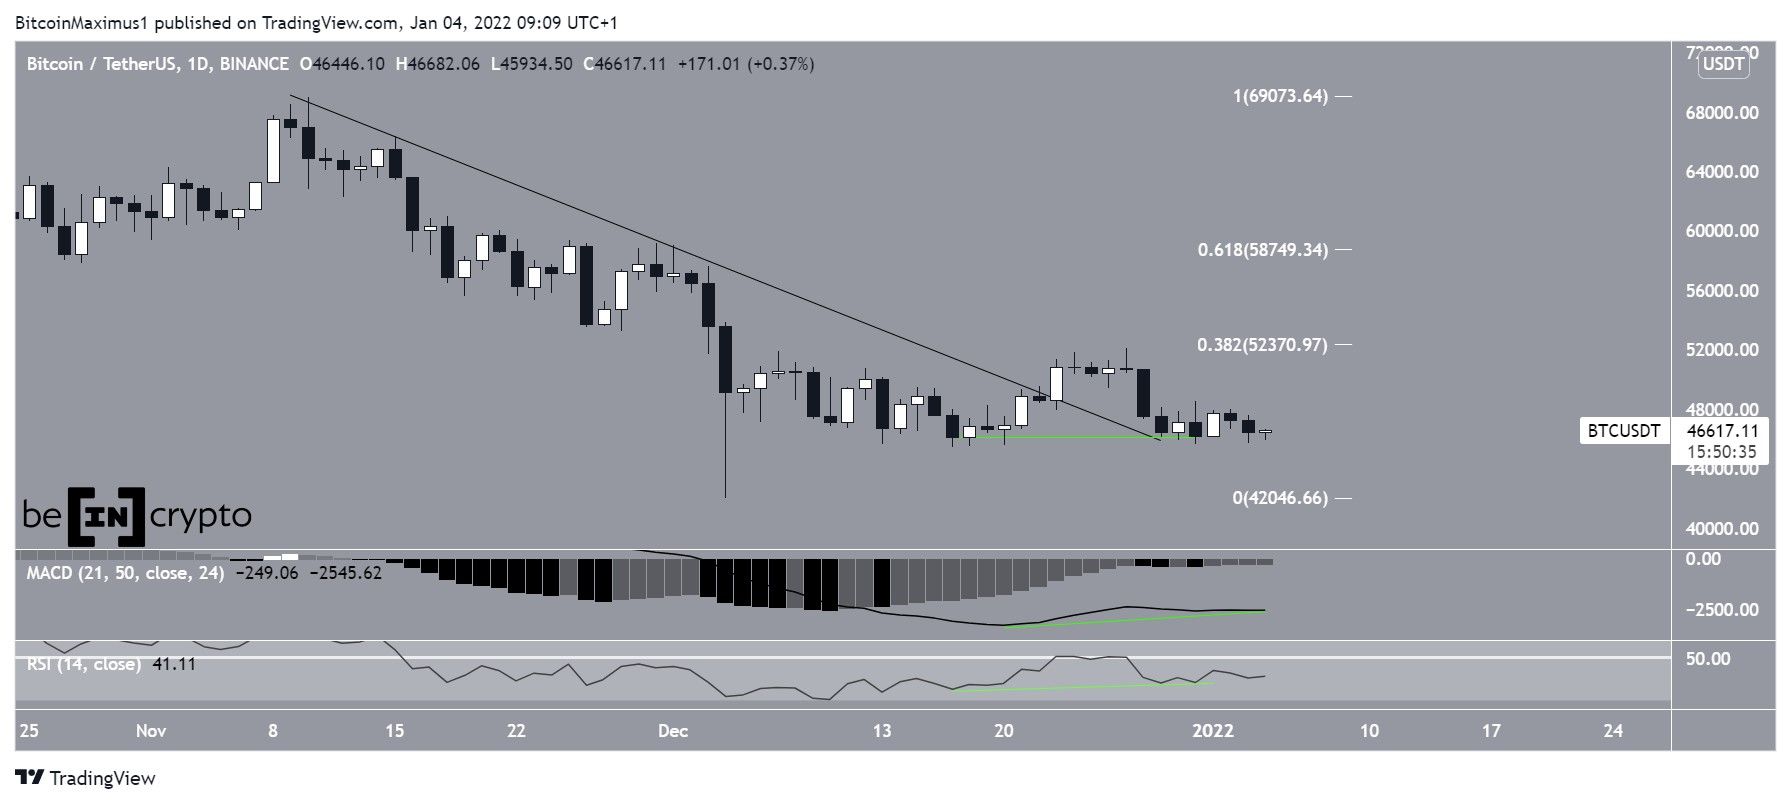
Bitcoin (BTC) is trading inside the range of its December lows but is showing strong signs of a potential bullish reversal.
On Dec 23, BTC broke out from a descending resistance line that had previously been in place since the Nov 10 all-time high price. This indicates that the previous correction is now complete.
Following this, it fell back to pre-breakout levels close to $46,000. This potentially created a double bottom, which is often considered to be a bullish reversal pattern.
In addition to this, both the MACD and RSI have generated significant bullish divergences. This is a type of bullish occurrence in which the price decrease is not accompanied by a similar decrease in selling momentum.
Previously, this divergence has been a catalyst for very significant upward moves.
The closest resistance range is found between $52,400 and $58,750, created by the 0.382-0.618 Fib retracement resistance levels.
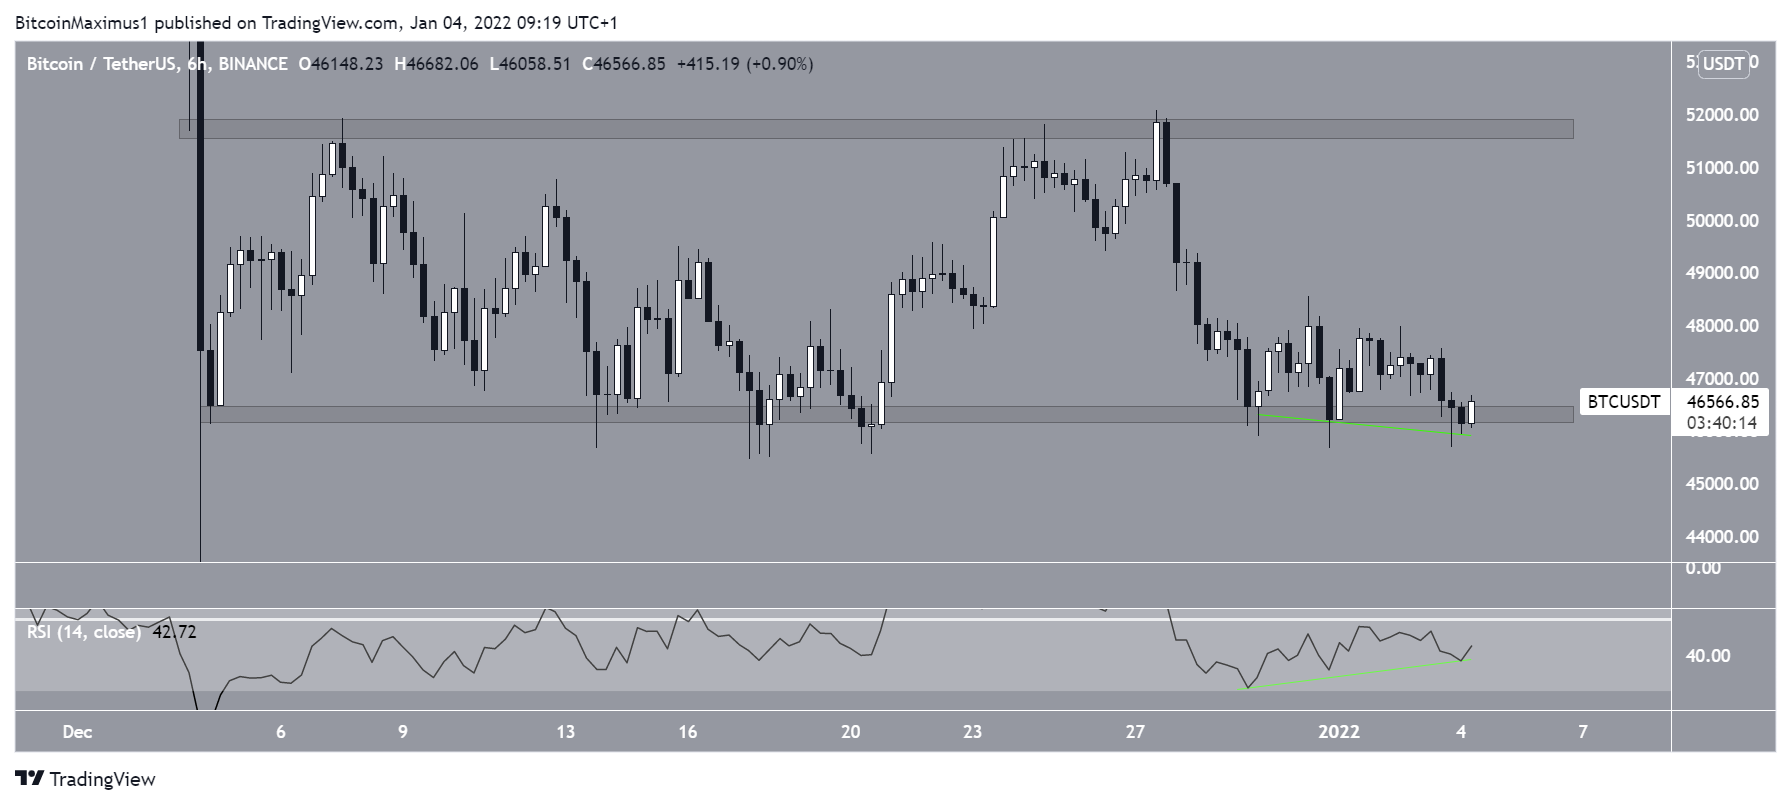
Short-term BTC range
The six-hour chart shows that since the beginning of December, BTC has been trading in a range between $46,300 and $51,800. It was recently rejected by the resistance area on Dec 27 and has been moving downwards since.
Since Dec 30, BTC has been trading inside the support level of the range. Similar to the daily time frame, there is a significant bullish divergence developing in the RSI. As a result, an upward move towards the midline of the range and potentially the range highs is expected.
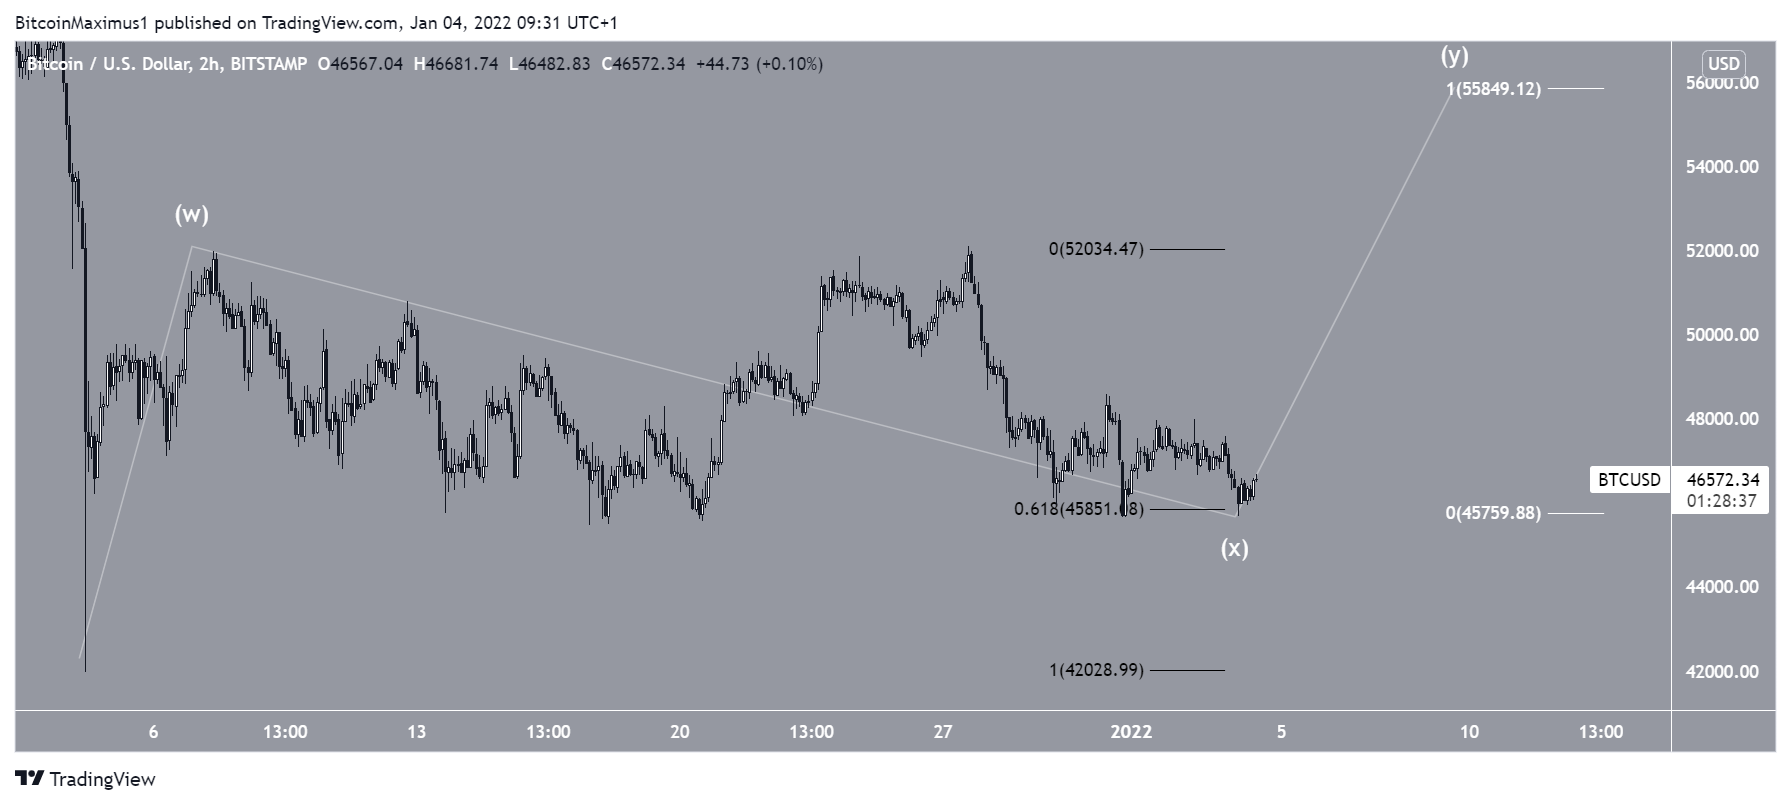
Wave count
The most likely wave count suggests that BTC is still mired in a corrective pattern. It’s currently trading just above the 0.618 Fib retracement support level, which is likely to help boost the price back up.
If waves W:Y have a 1:1 ratio, which is common in such structures, BTC could reach a local high of $55,850. This high would be made inside the previously outlined resistance levels.
For BeInCrypto’s previous Bitcoin (BTC) analysis, click here.


