
Bitcoin (BTC) is trading above a crucial Fib support level and has generated several bullish signs.
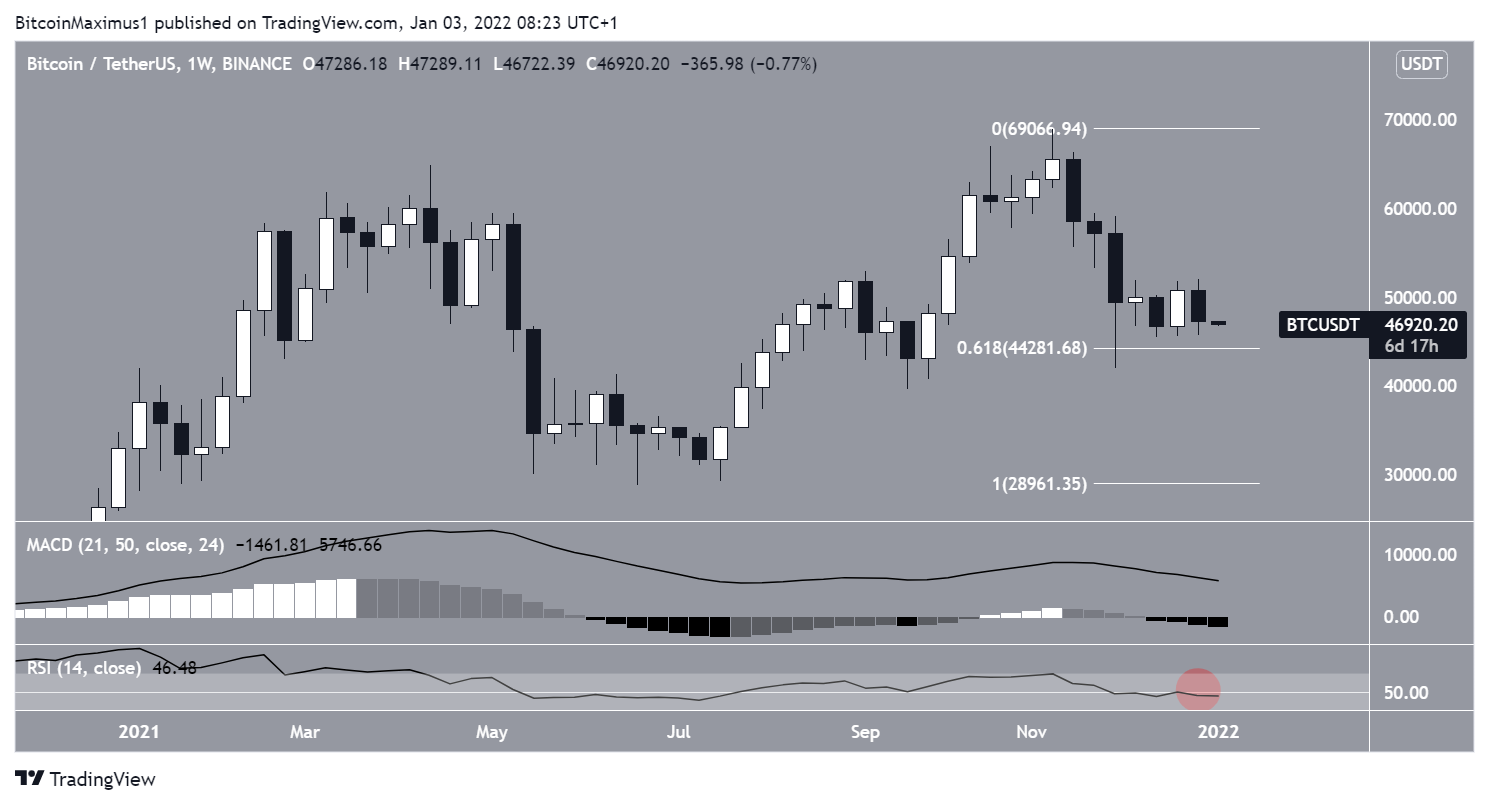
BTC decreased considerably during the week of Dec 27-Jan 2, falling to a low of $45,678 in the process. However, it rebounded after and managed to close at $47,286. This was crucial because the previous bullish engulfing candlestick was not invalidated.
Currently, BTC is trading just above the 0.618 Fib retracement support level located at $44,300.
However, technical indicators paint a neutral picture.
The RSI, which is a momentum indicator, is right at the 50-line (red circle). This is a sign of a neutral trend. A decisive movement either above or below this line is required in order for the direction of the trend to become clear.
Similarly, the MACD, which is created by short and long-term moving averages (MA), is falling but is still positive.
Bullish divergences
The daily chart for BTC provides a much more bullish outlook. The main reason for this is the multiple bullish divergences present in both the RSI and MACD.
The main resistance area is found at $52,400, but there is also a stronger resistance level found at $58,750. This is both a horizontal resistance area and the 0.618 Fib retracement resistance level.
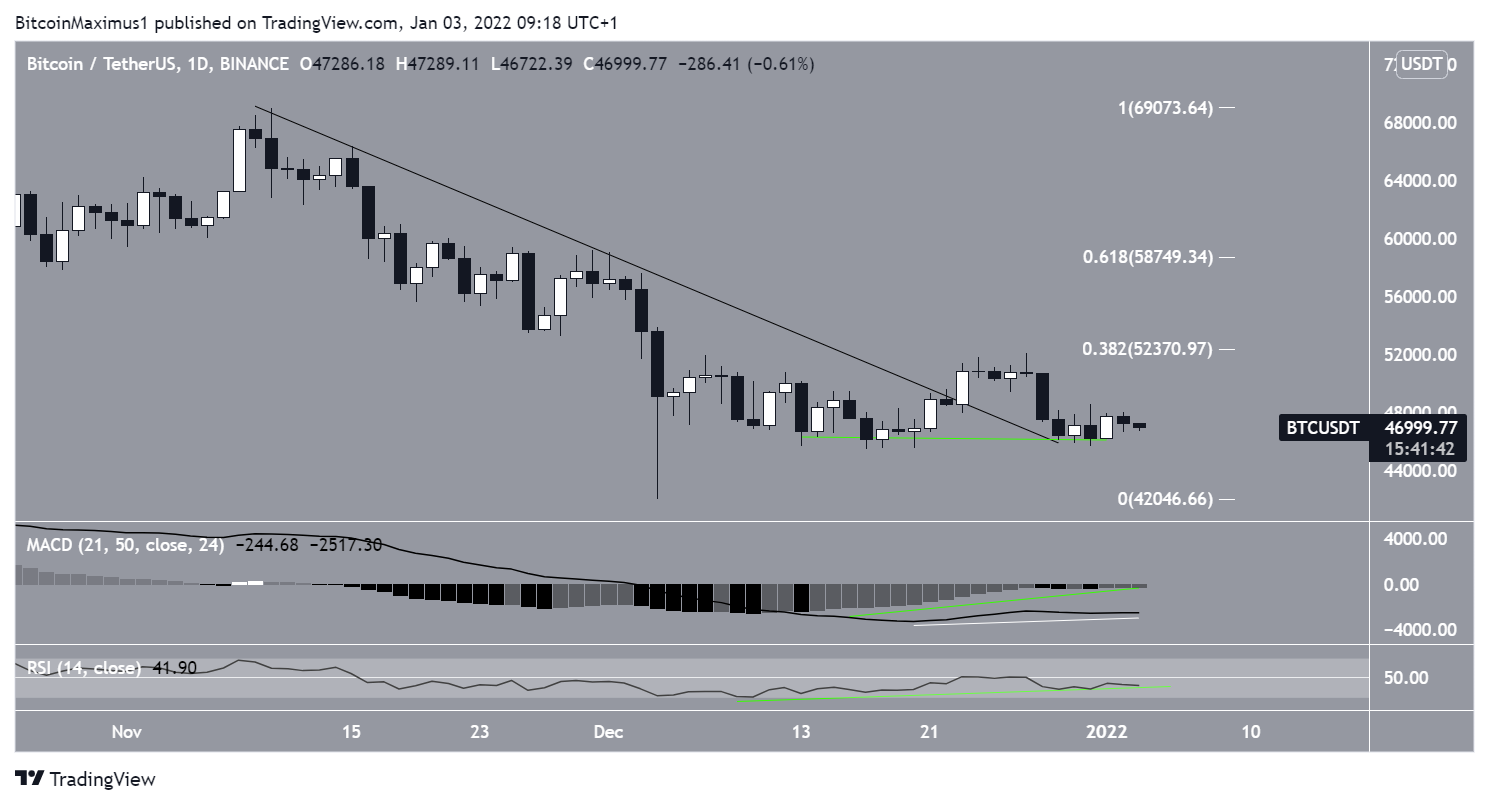
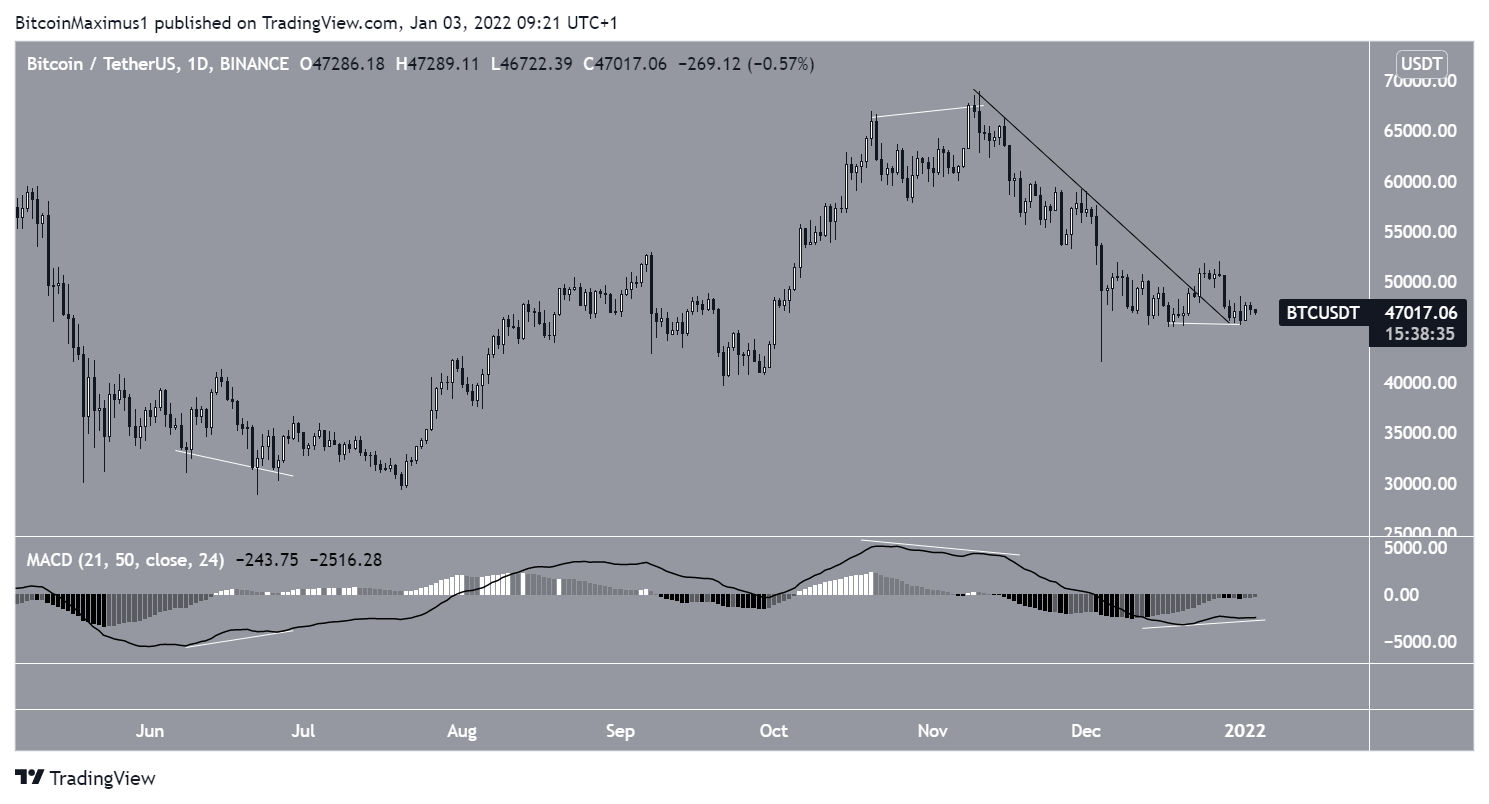
As for the indicator readings, the divergence in the MACD line is especially crucial. The previous two times this transpired, a significant movement followed.
Relative to the current reading, the previous divergences were more pronounced. Therefore, it’s possible that BTC continues developing the divergence before eventually initiating a strong upward move.
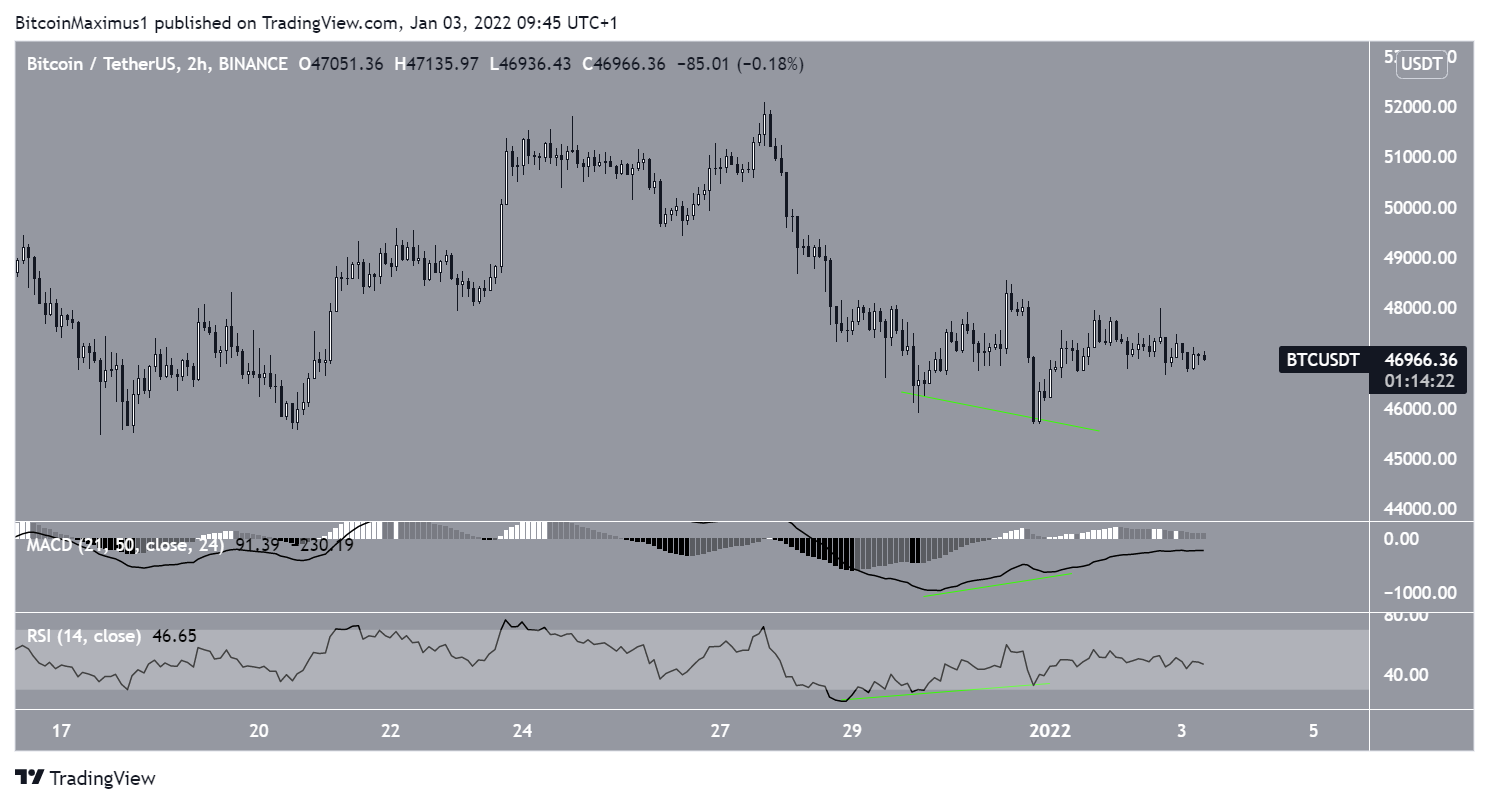
Short-term BTC movement
Similar to the daily time frame, there are bullish divergences in both the two-hour MACD and RSI. This is a sign that an upward move towards the previously outlined resistance levels is likely.
For BeInCrypto’s previous Bitcoin (BTC) analysis, click here.
