


Bitcoin (BTC) is still consolidating below $40,000 and has not shown any decisive signs that would determine the direction of its trend.
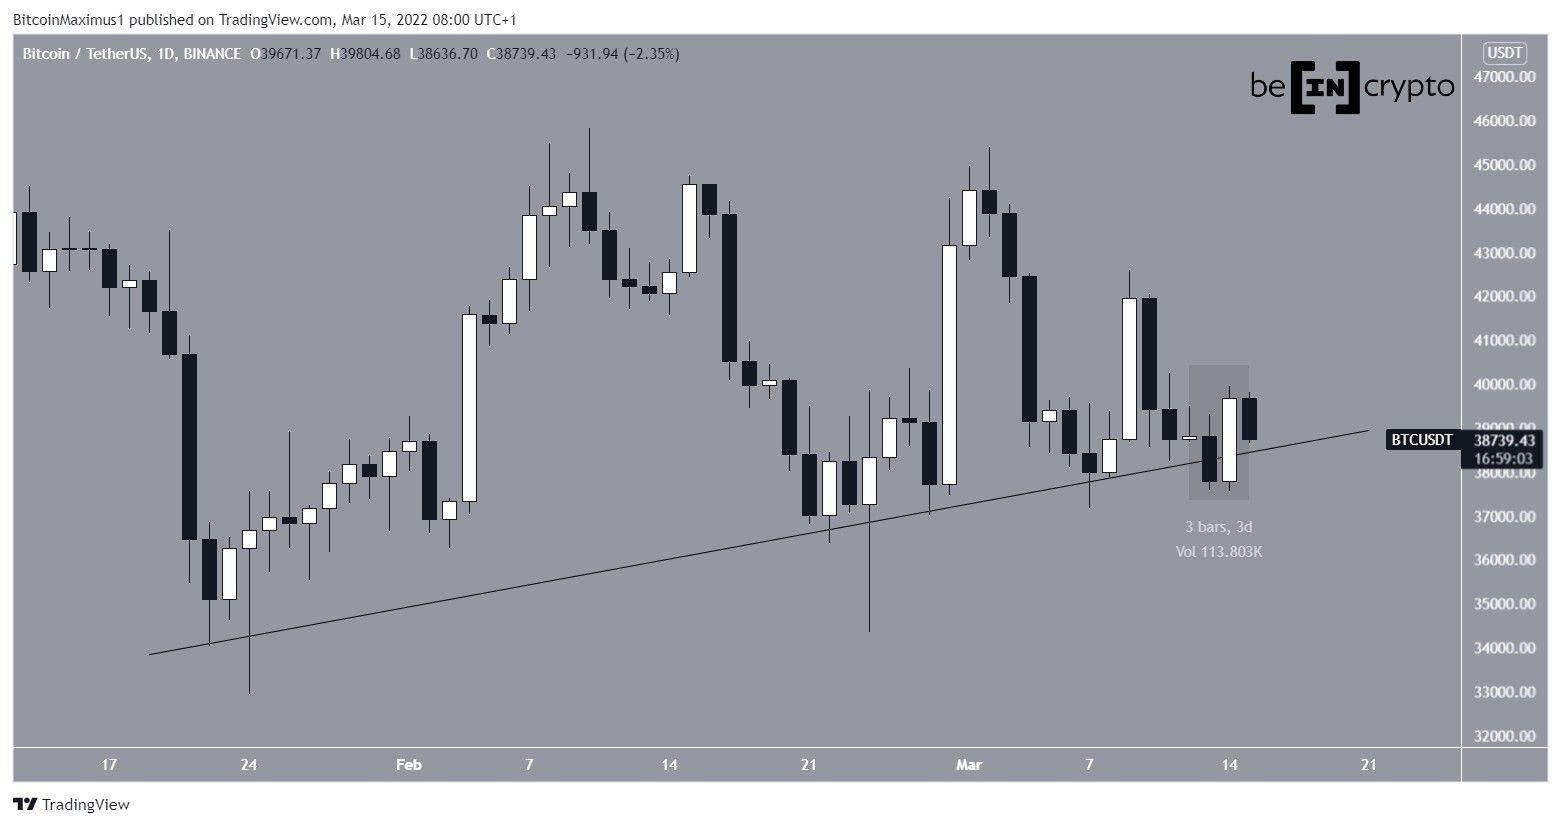
Bitcoin has been following an ascending support line since Jan. 22. So far, the line has been validated numerous times. The price seemingly broke down from the line on March 13 but reclaimed it by creating a bullish engulfing candlestick the next day (highlighted).
The bullish engulfing candlestick is a bullish pattern in which the entire previous day’s decrease is negated with a large bullish candlestick. Therefore, it bodes well for the possibility of future increases.
BTC bounces at support
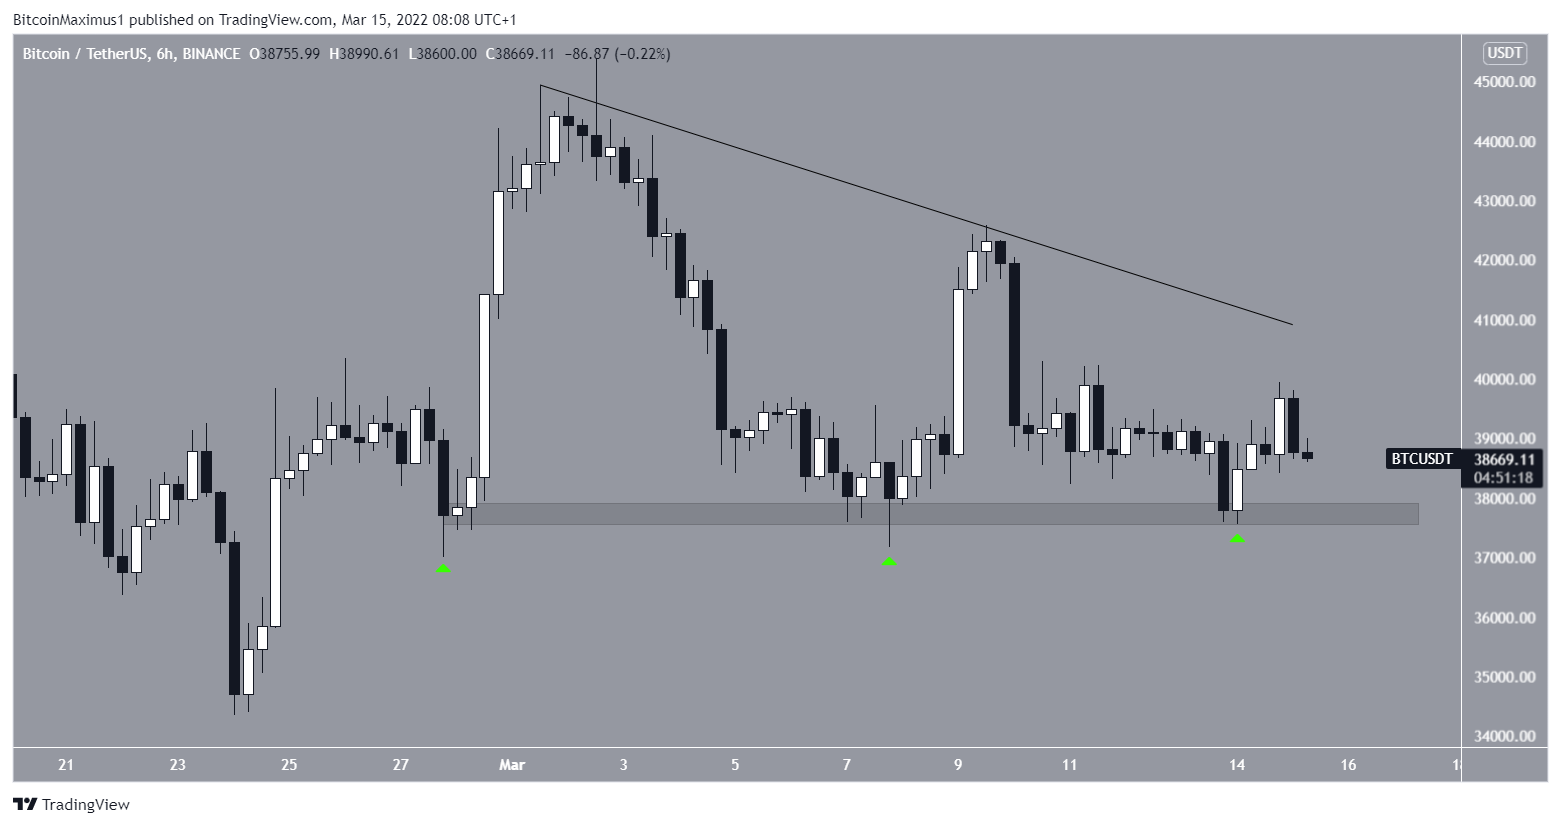
The six-hour chart shows that BTC has been trading above the $37,700 horizontal support area since Feb 28. So far, the area has been validated multiple times (green icons), most recently on March 14.
The price is also following a shorter-term descending resistance line that has been in place since March 1 and currently intersects the price near $40,500.
Whether BTC breaks down from the horizontal support area or breaks out above the resistance line will likely determine the direction of the next move.
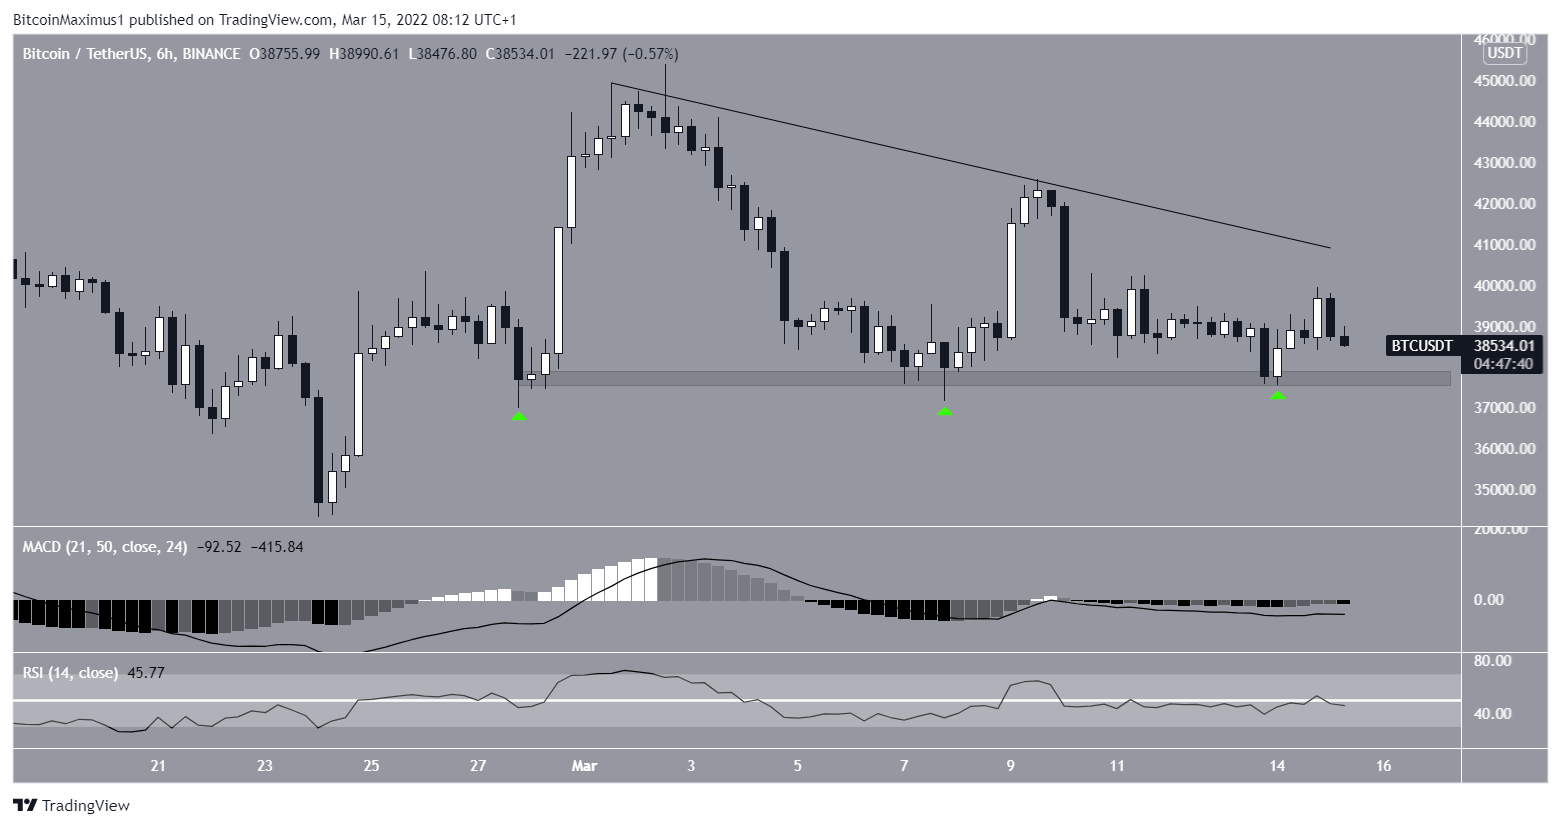
In the majority of time frames, technical indicators are neutral. This is especially evident in the RSI and MACD, which are close to 50 and 0, respectively. These readings are considered signs of a neutral trend.
Wave count analysis
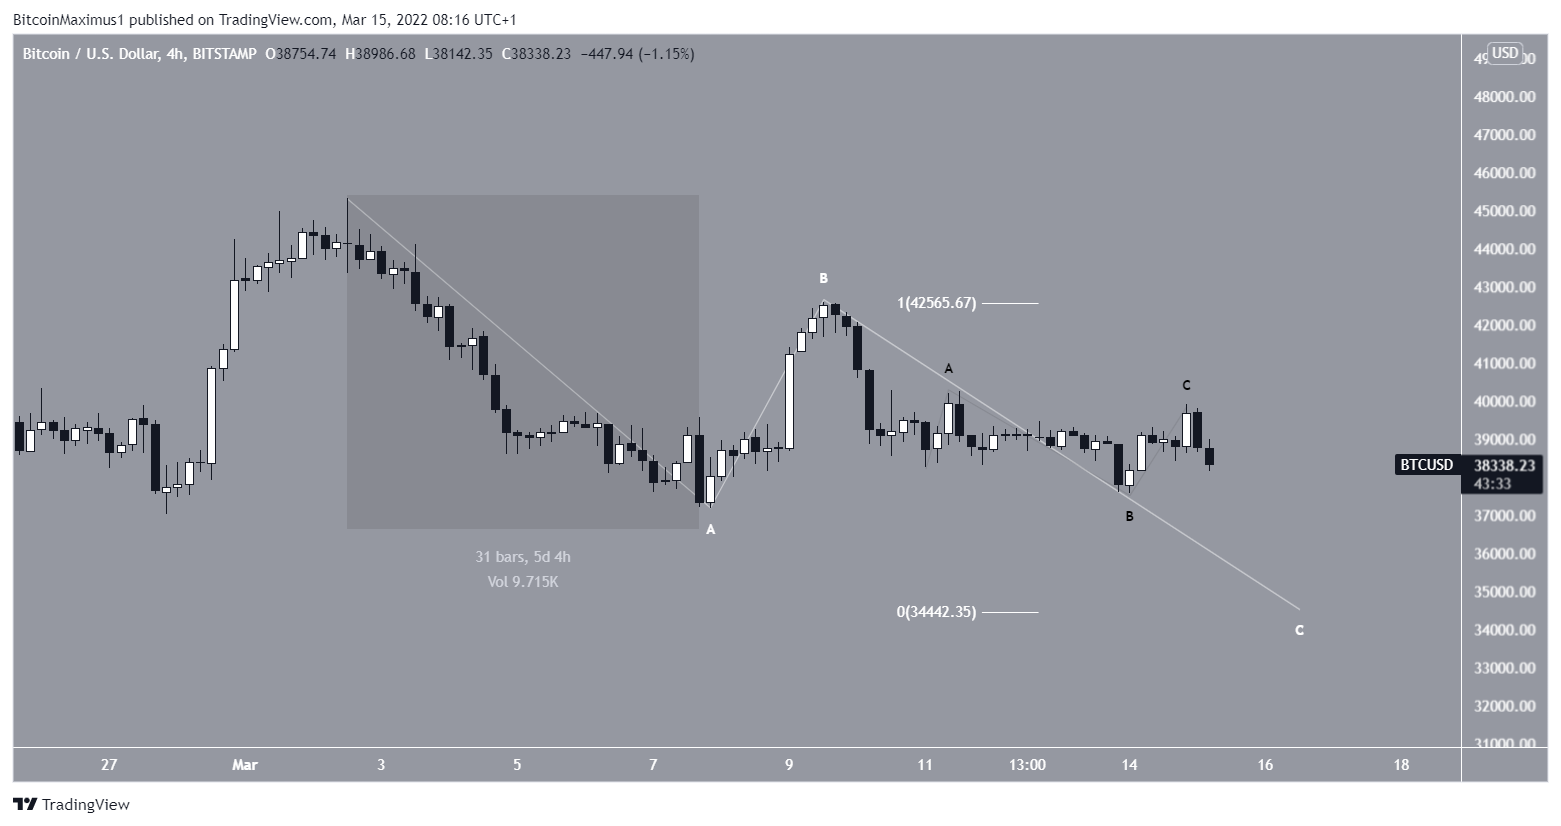
The most likely short-term wave count suggests that BTC has completed a running A-B-C corrective structure.
If so, it has now begun a new downward move that will take it towards its February lows close to $34,000.
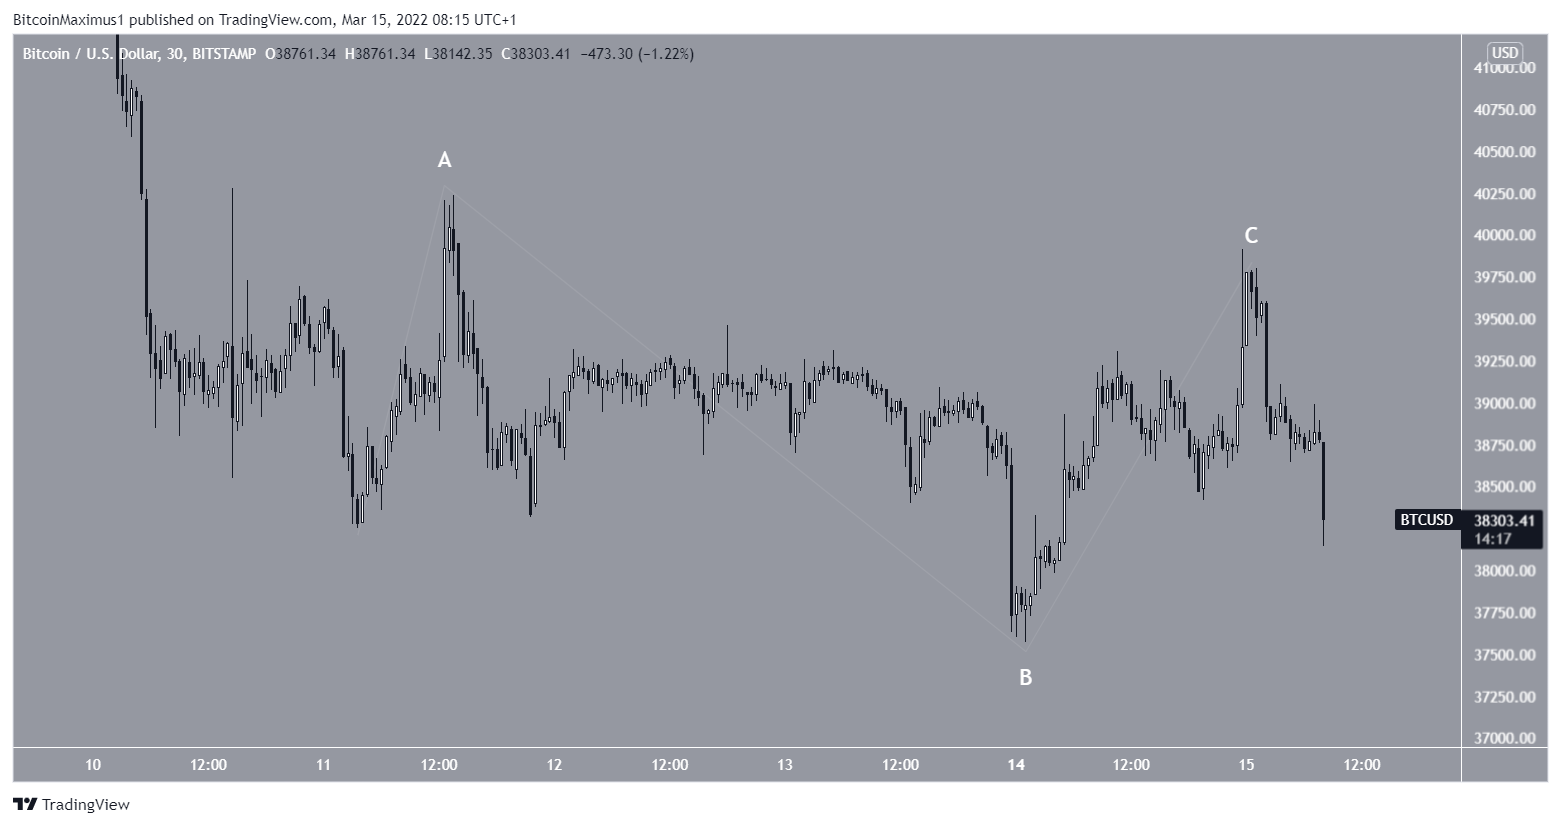
A downward move that takes the price to $34,400 would also give the longer-term waves A and C a 1:1 ratio, which is very common in such structures.
The longer-term wave count still remains unclear.
For BeInCrypto’s previous Bitcoin (BTC) analysis, click here


