

Bitcoin (BTC) has reached the $45,800-$47,000 Fib support area. If the relief rally is to resume, it’s crucial that it creates a higher low inside this area.
BTC has been falling since Dec 7, when it reached a high of $51,936 (red icon). The high was made very close to the 0.382 Fib retracement resistance level at $52,400. Furthermore, it validated the previous ascending support line that BTC broke down from on Dec 4, as resistance.
On top of the rejection, technical indicators in the daily time frame are bearish.
The MACD, which is created by short and long-term moving averages (MA), is falling and is negative. This means that the short-term MA is moving slower than the long-term average. While the histogram created a higher momentum bar on Dec 6 (green icon), it has resumed its descent since.
The RSI, which is a momentum indicator, is also falling and is below 50. Readings below 50 are normally considered bearish.
Therefore, the readings from the daily time frame are bearish. These indicators were further accentuated by the bearish engulfing candlestick on Dec 9. This is a type of bearish candlestick in which the entire movement of the previous day is negated by a large bearish candlestick.

Short-term BTC breakdown
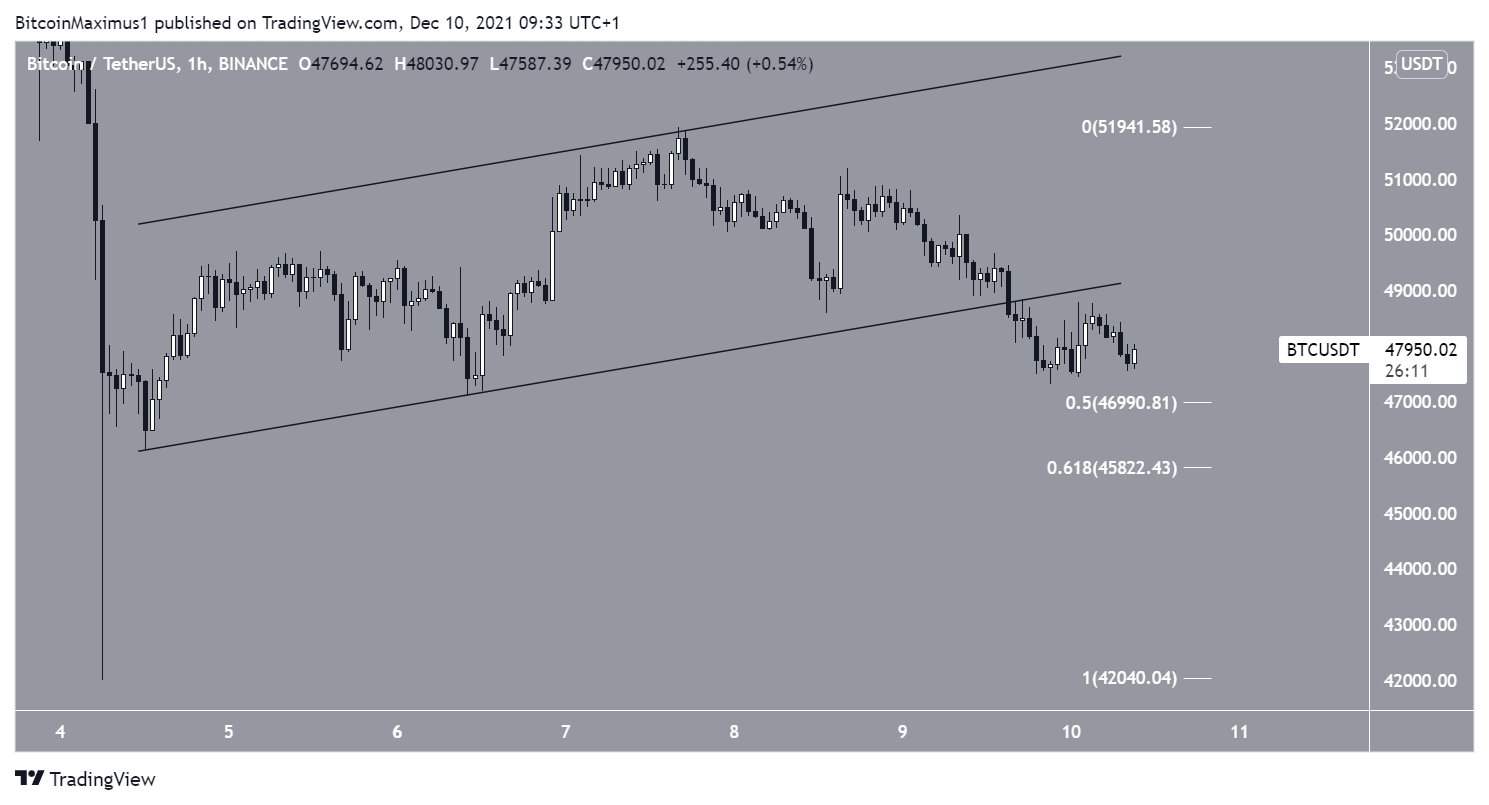
The hourly chart shows that BTC has broken down from an ascending parallel channel on Dec 9.
It continued to fall until it reached a low of $47,320, just above the 0.5 Fib retracement support level of $47,000.
It’s crucial that BTC creates a higher low inside the 0.5-0.618 Fib retracement support level between $45,800-$47,000 if it’s to reverse its trend.
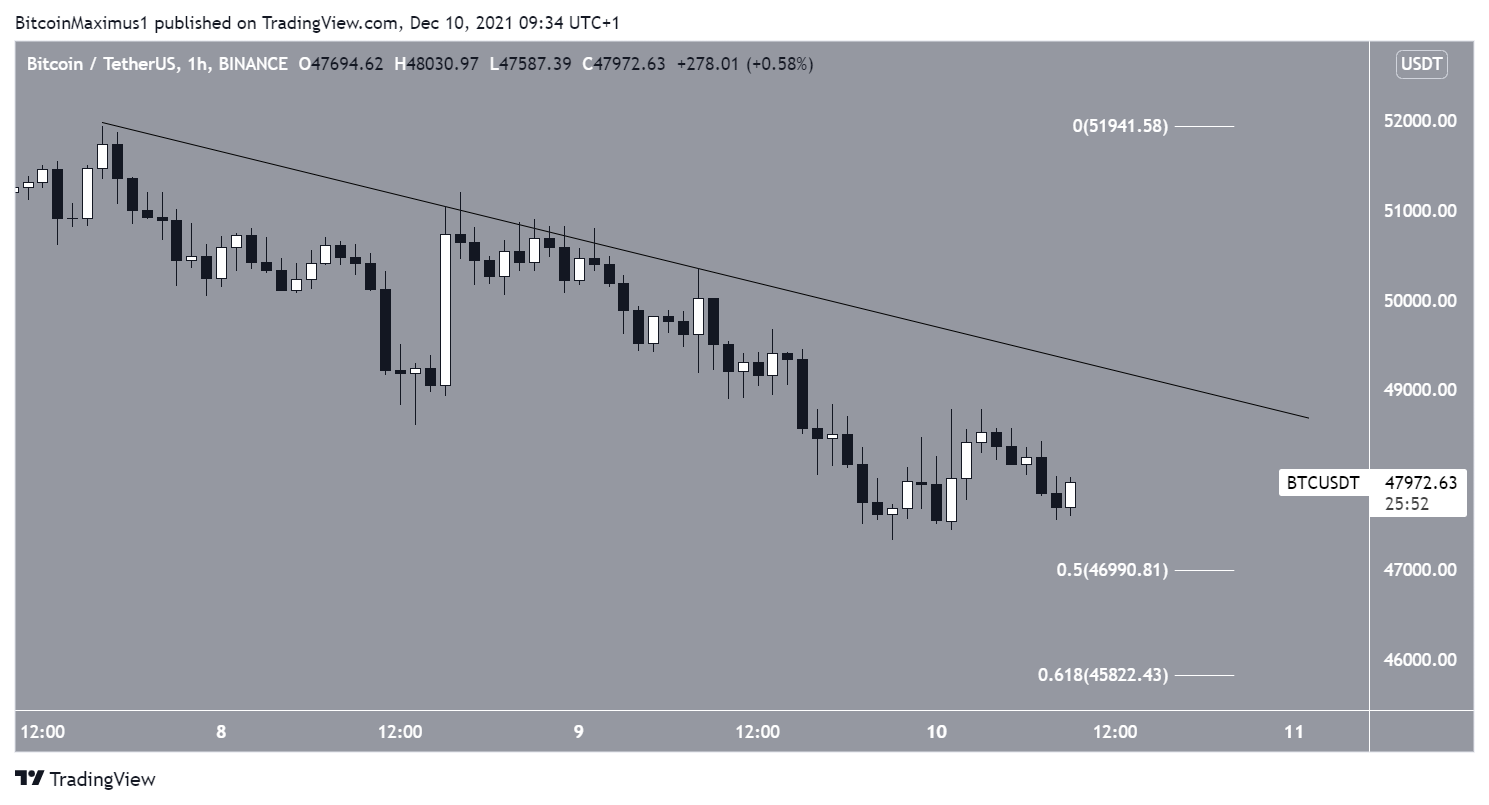
BTC has also been following underneath a descending resistance line since Dec 7, most recently being rejected by it on Dec 9.
Until it manages to break out, the short-term trend cannot be considered bullish.
Future movement
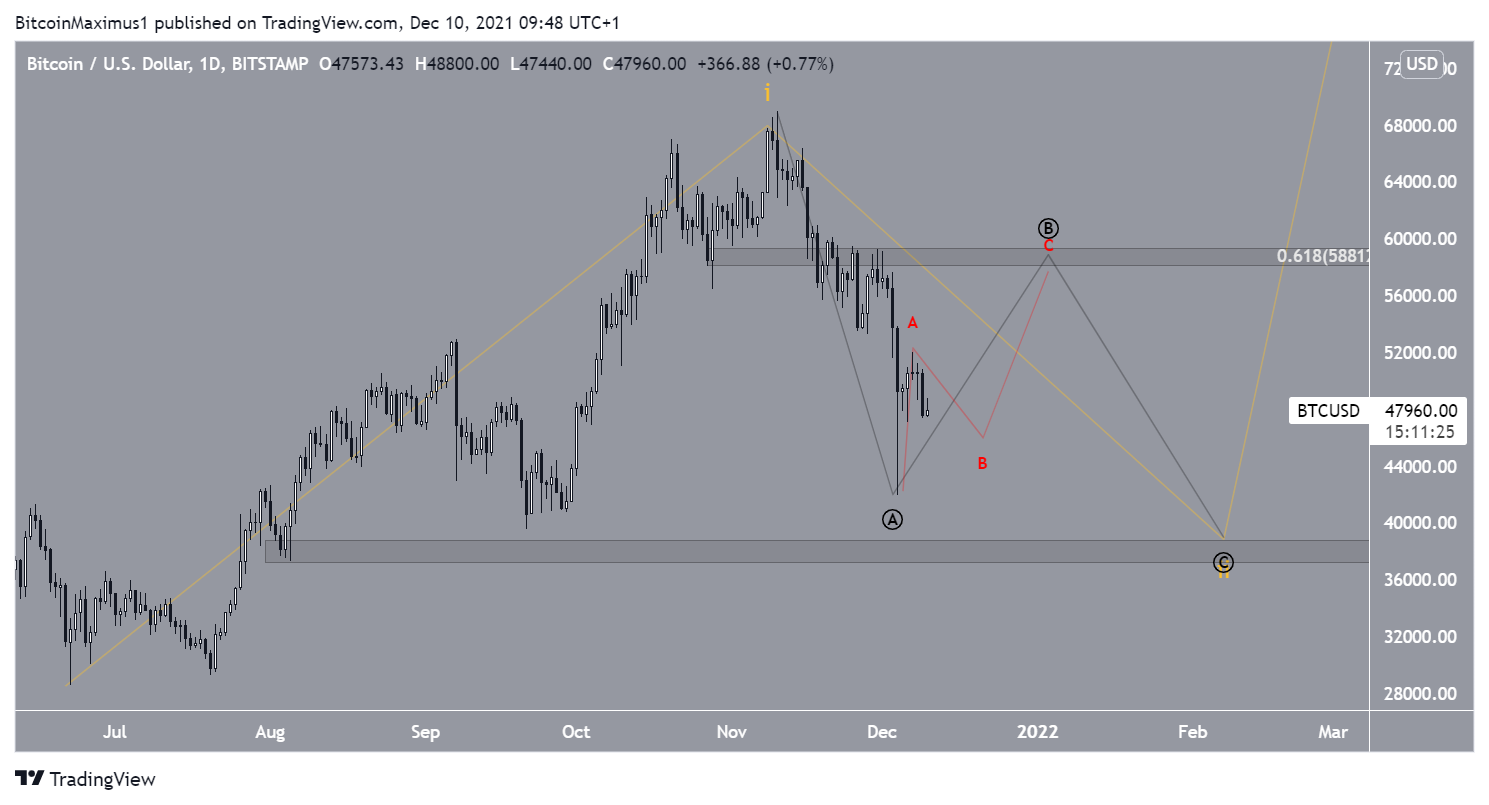
The most likely wave count indicates that the slight relief rally is part of sub-wave B (black), of a longer-term wave two. This could potentially take BTC back toward the $58,800 resistance area, which is the 0.618 Fib retracement resistance level.
The minor sub-wave count is given shown red.
For BeInCrypto’s previous Bitcoin (BTC) analysis, click here.
Disclaimer
In line with the Trust Project guidelines, this price analysis article is for informational purposes only and should not be considered financial or investment advice. BeInCrypto is committed to accurate, unbiased reporting, but market conditions are subject to change without notice. Always conduct your own research and consult with a professional before making any financial decisions. Please note that our Terms and Conditions, Privacy Policy, and Disclaimers have been updated.
