


Bitcoin (BTC) increased considerably on Oct 4, creating another bullish candlestick and moving definitively above the $47,800 resistance area.
There is some short-term weakness developing, which could lead to a drop prior to the continuation of the upward movement.
BTC moves above resistance
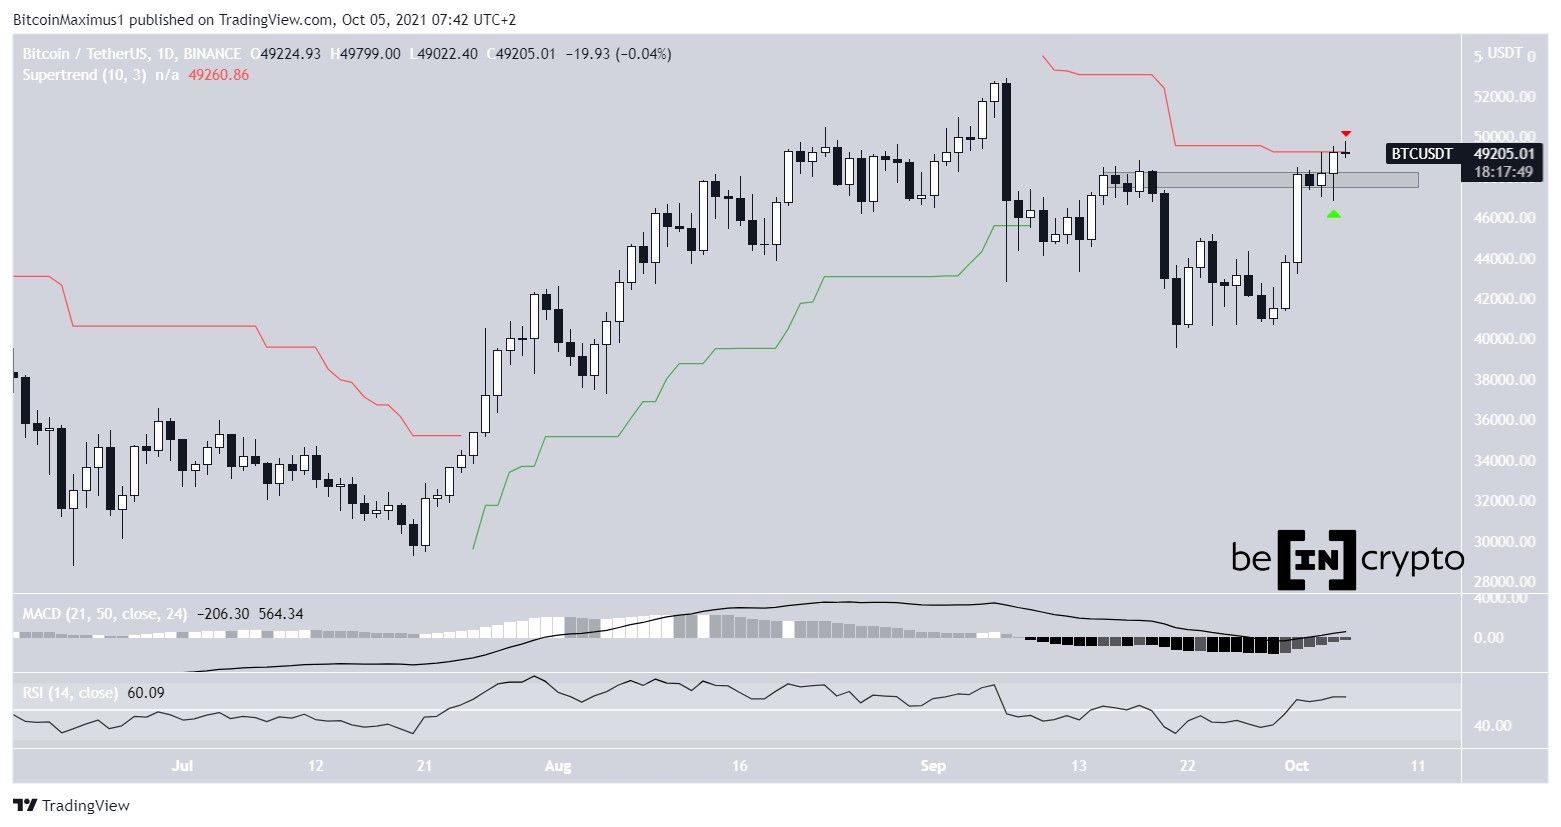
BTC continued its ongoing ascent on Oct 4 and bounced at the $47,800 resistance area, above which it had moved the day prior (green icon). Now, the area is expected to act as support.
Technical indicators in the daily time frame have turned bullish. The MACD is in positive territory and increasing and its histogram reading is almost positive.
Similarly, the RSI is moving upwards and has crossed above 50.
However, there is resistance from the Supertrend line, which is bearish (red icon). This is the final major resistance area that BTC has to clear before it can move toward new highs.
Future movement
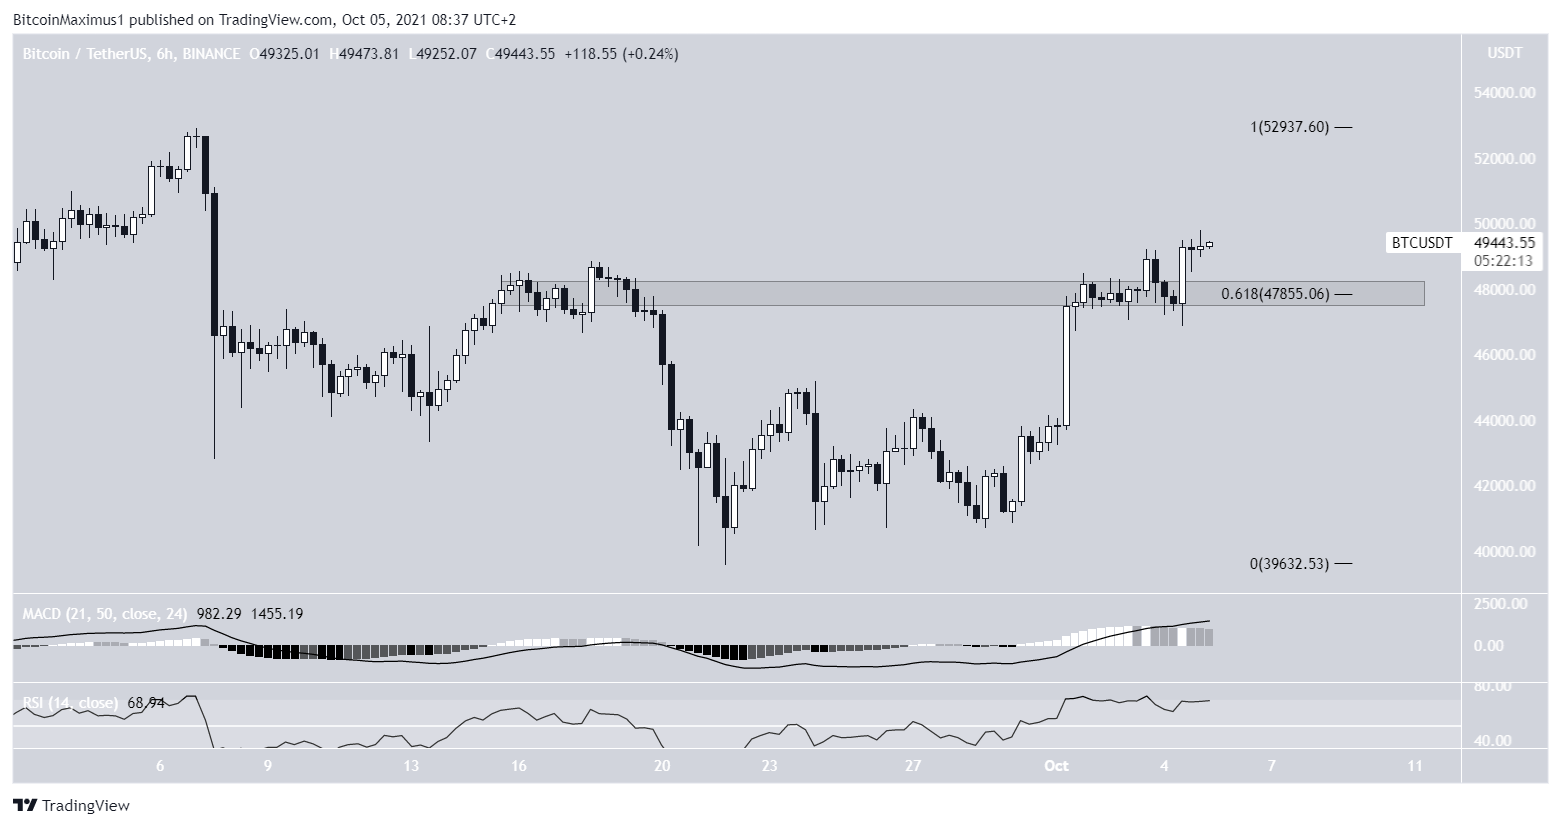
The six-hour chart more clearly shows that BTC has moved above the $47,800 area and validated it as support after.
While the MACD and RSI are showing some signs of weakness, neither has turned bearish yet.
The next closest resistance zone is found at the $52,950 highs from the month of September.
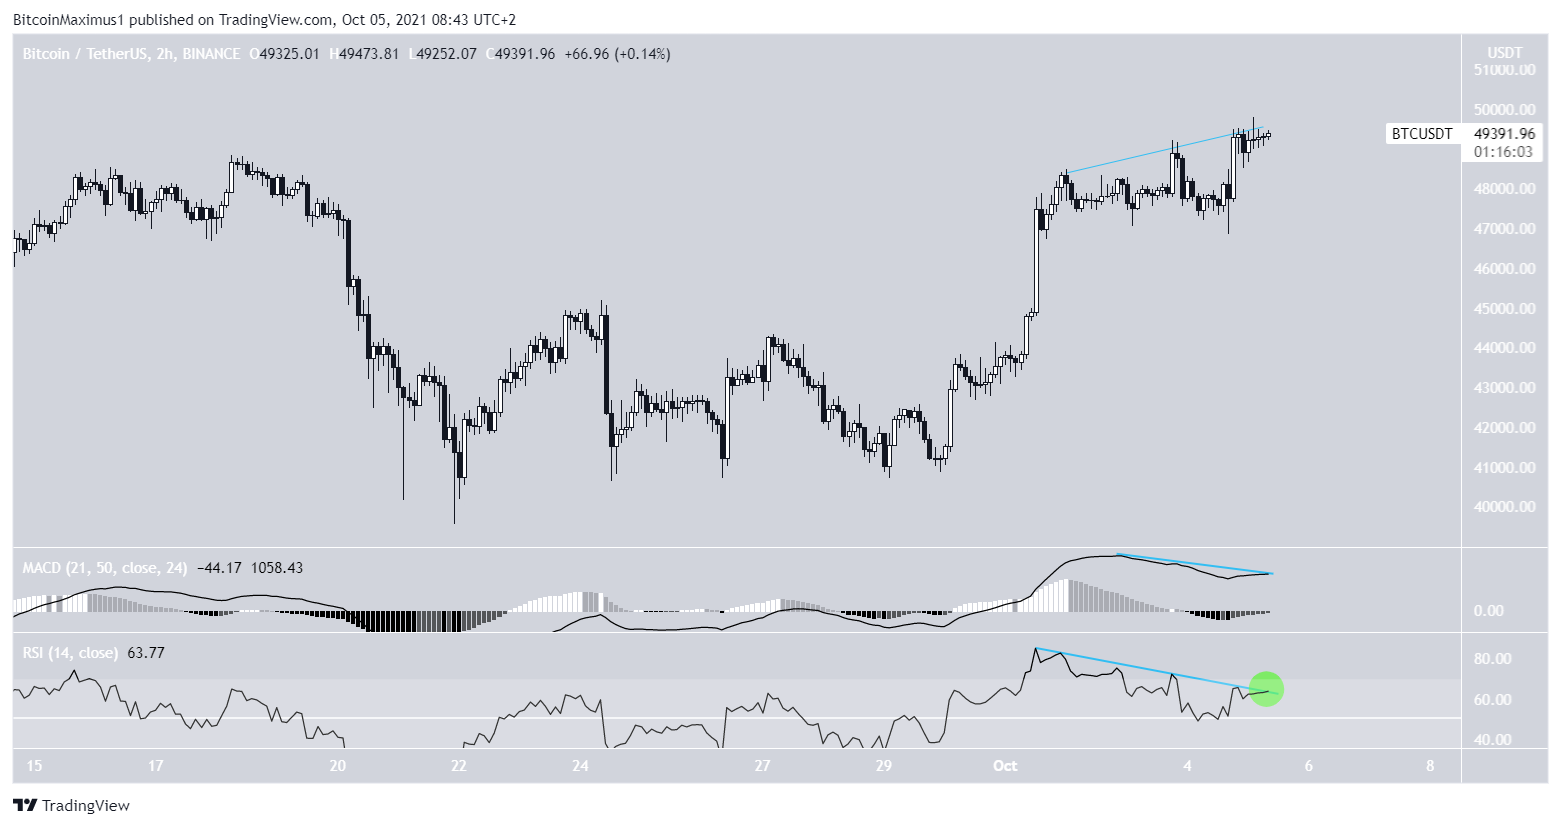
The two-hour chart shows some signs of weakness, such as bearish divergences developing in the MACD and RSI.
However, the latter could be in the process of breaking from its bearish divergence trendline. If it’s successful in doing so, BTC could likely continue its path toward new highs.
If not, a short-term decrease could follow.
Validating the breakout
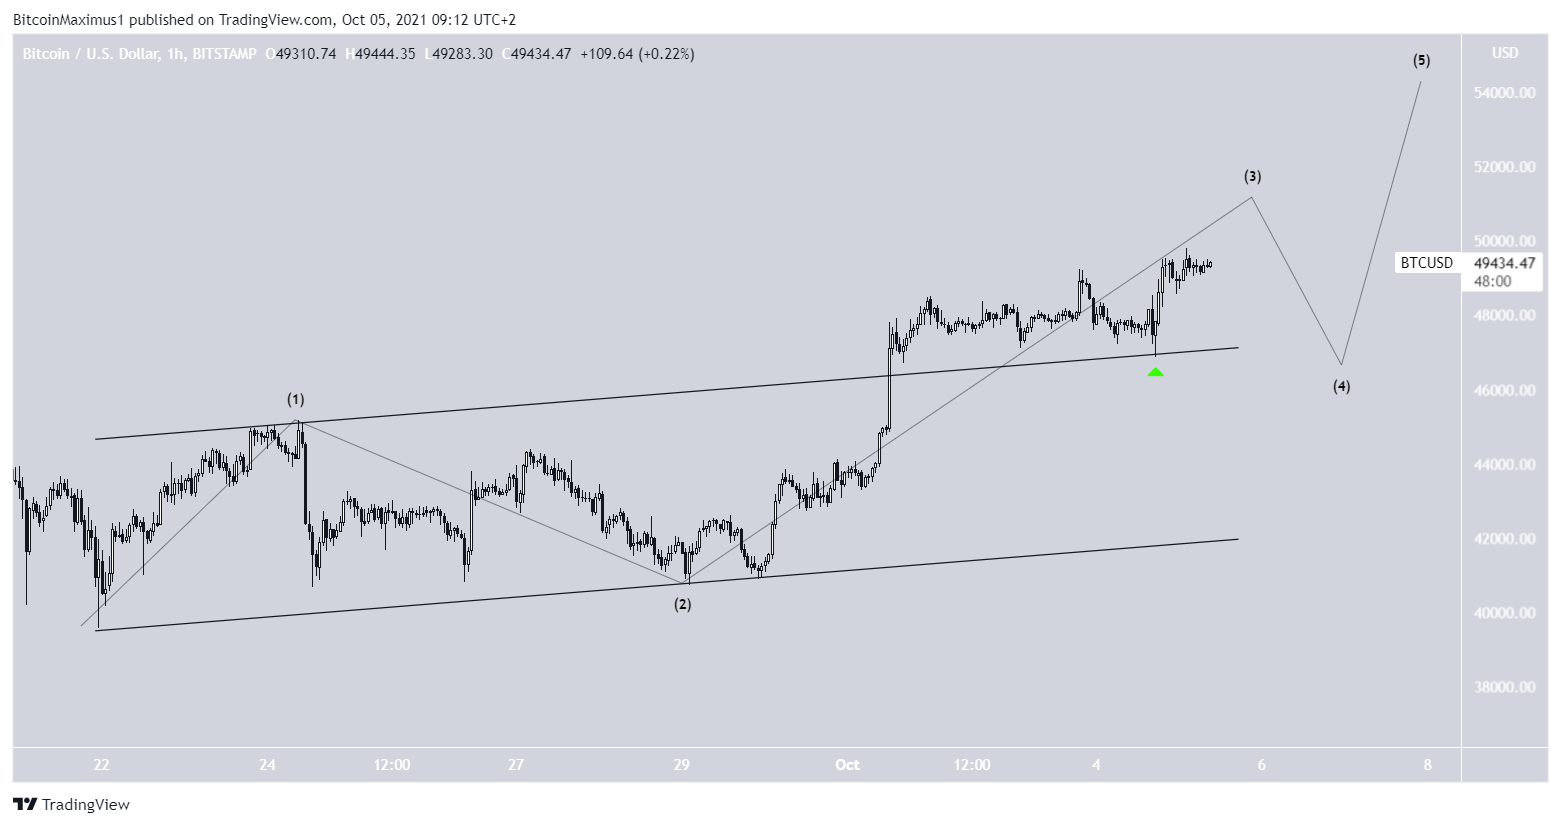
The two-hour chart shows that BTC has broken out from a short-term ascending parallel channel. This is a sign that a new bullish impulse has likely begun. The long-term wave count is also bullish.
After validating its resistance line as support (green icon), BTC resumed its upward movement.
However, the decrease seems too small to be part of wave four (black). Therefore, it is more likely that wave three has extended, and another drop will eventually follow prior to the continuation of the upward move.
For BeInCrypto’s previous Bitcoin (BTC) analysis, click here.


