


Bitcoin (BTC) has completed an A-B-C corrective structure after breaking out from a descending parallel channel.
It has likely begun a long-term bullish impulse that would take it to a new all-time high price.
BTC Count
The BTC movement following the April 14 all-time high price (highlighted) is a five wave bearish impulse (orange). However, it is not certain if it is the beginning of a new bearish impulse, or a completed C wave (white).
The most likely possibility indicates that it is a C wave. While this wave is considerably longer than wave A, it is still within the parameters of a valid impulse, since it is less than 2.61 the length of A.
Furthermore, the movement since the June 22 low resembles that which would ensue after a completed correction.
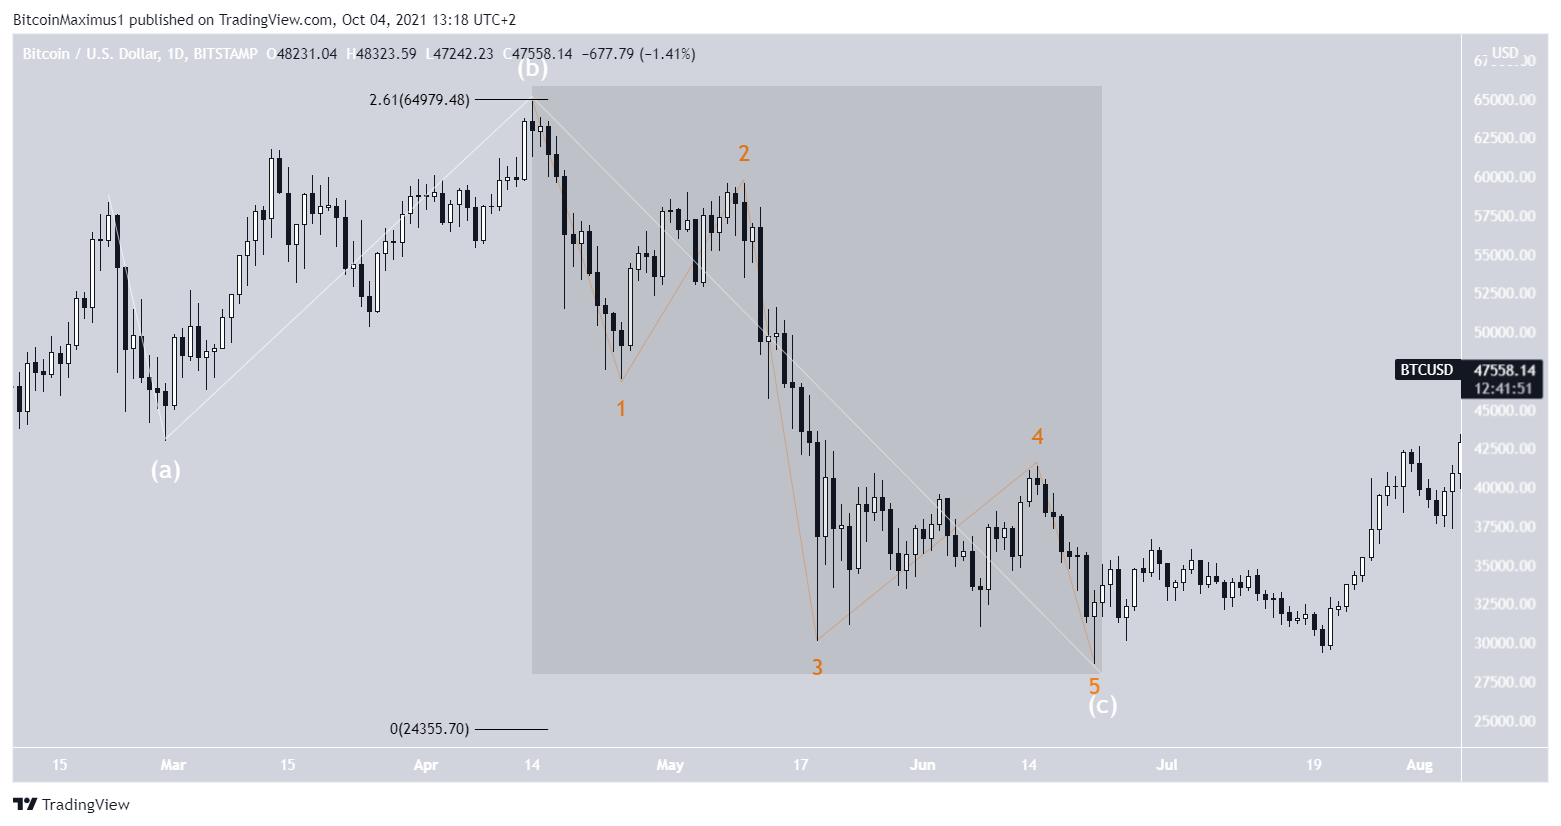
Therefore, it is possible that BTC has begun a new bullish impulse (white) which will take it towards a new all-time high price.
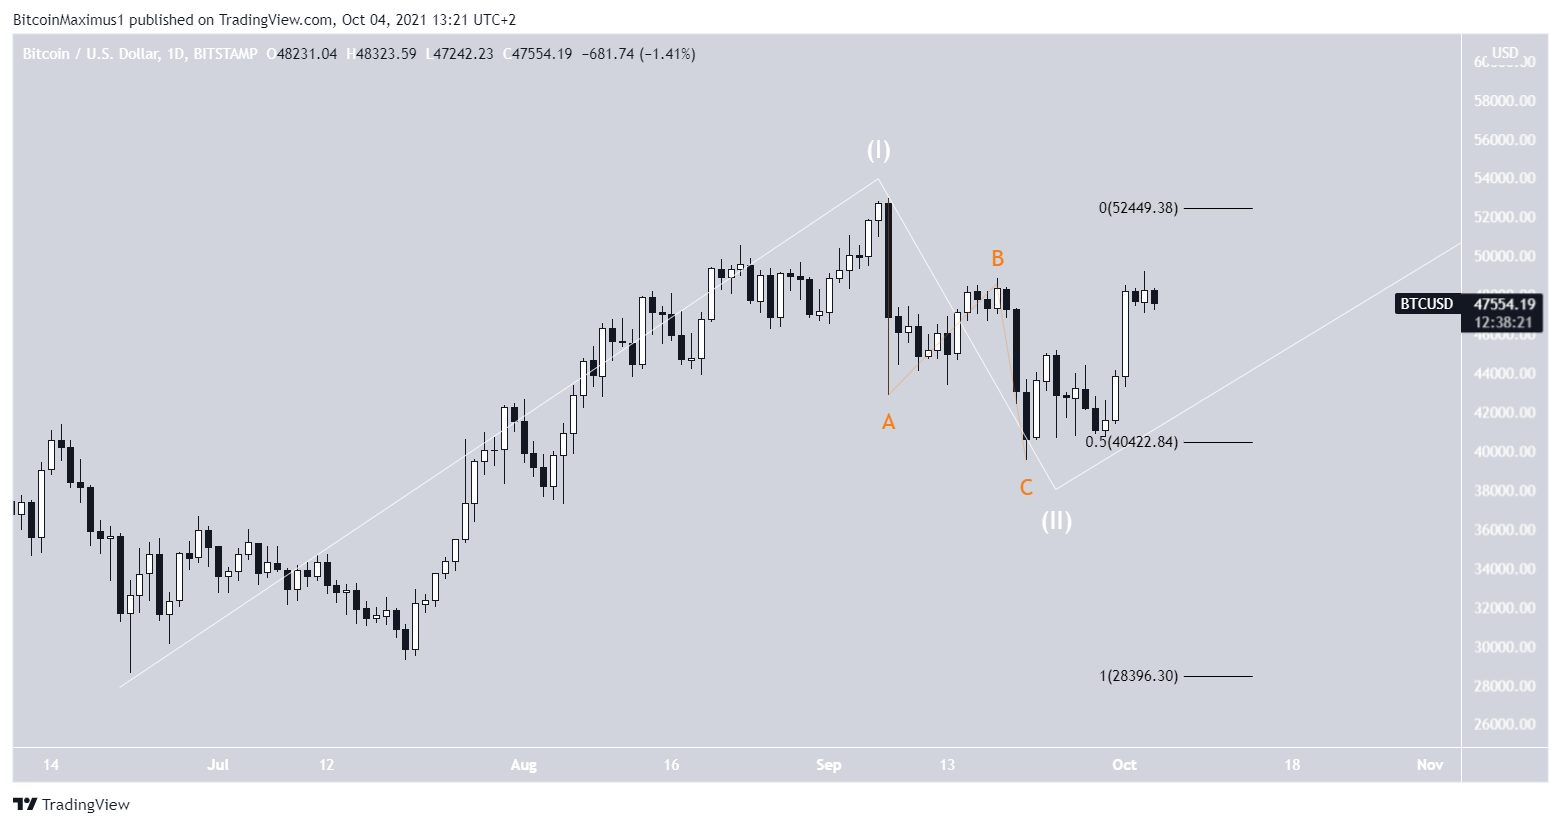
In this case, it has just completed wave two with its Sept 21 bounce at $37,573, which reached the 0.5 Fib retracement support level when measuring the entire upward movement.
So, BTC could be in wave three of this new bullish impulse. For the previous wave count analysis, click here.
Future movement
Cryptocurrency trader @TheTradinghubb outlined a bullish wave count, in which BTC has begun a new bullish impulse.
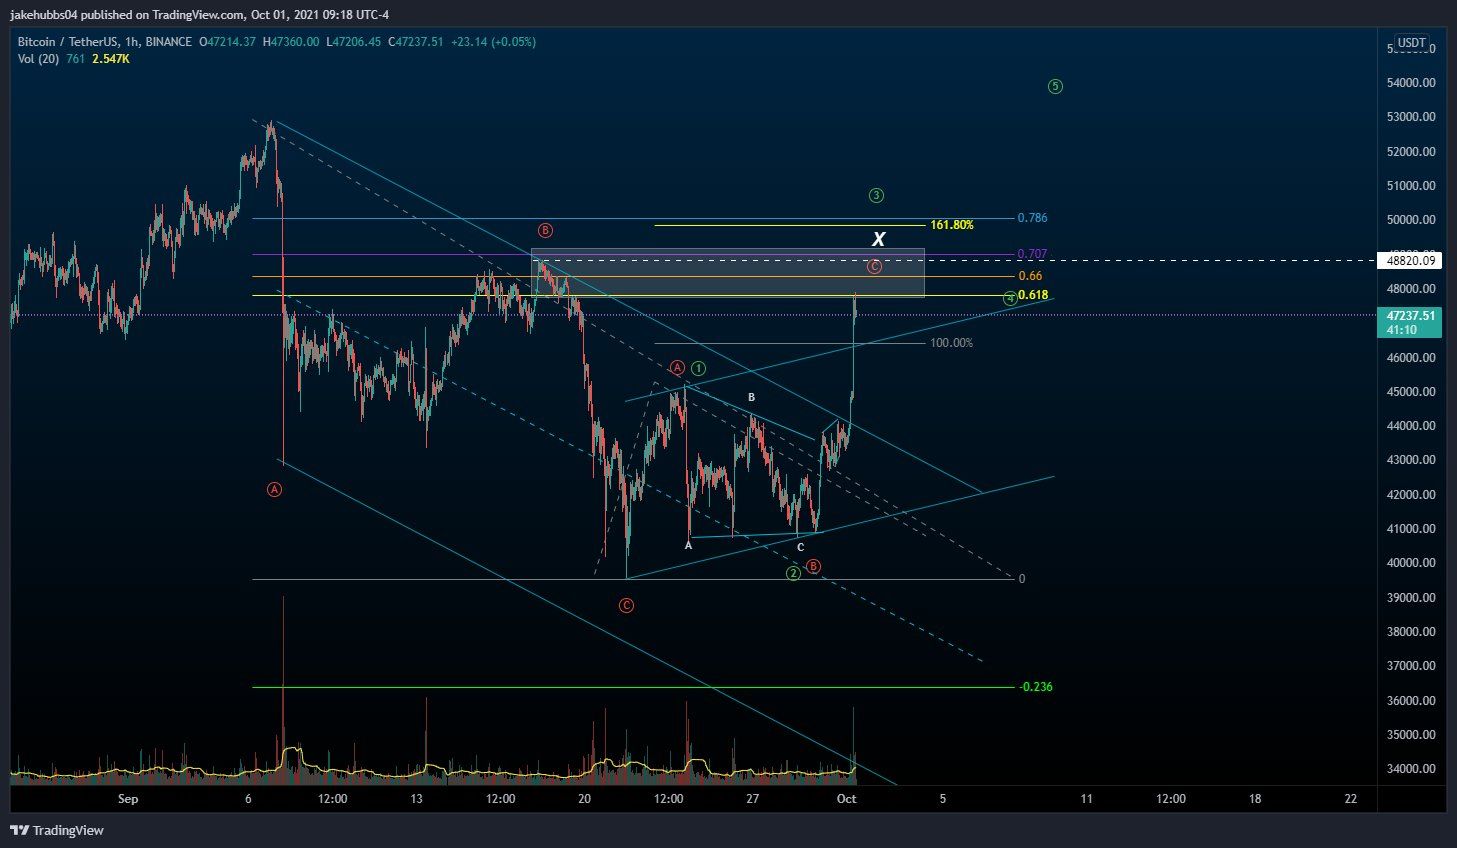
The completed A-B-C corrective structure was confirmed with the breakout from the descending parallel channel.
Therefore, it is possible that BTC is now in sub-wave one of the new upward movement.
The minor sub-wave count is given in black.
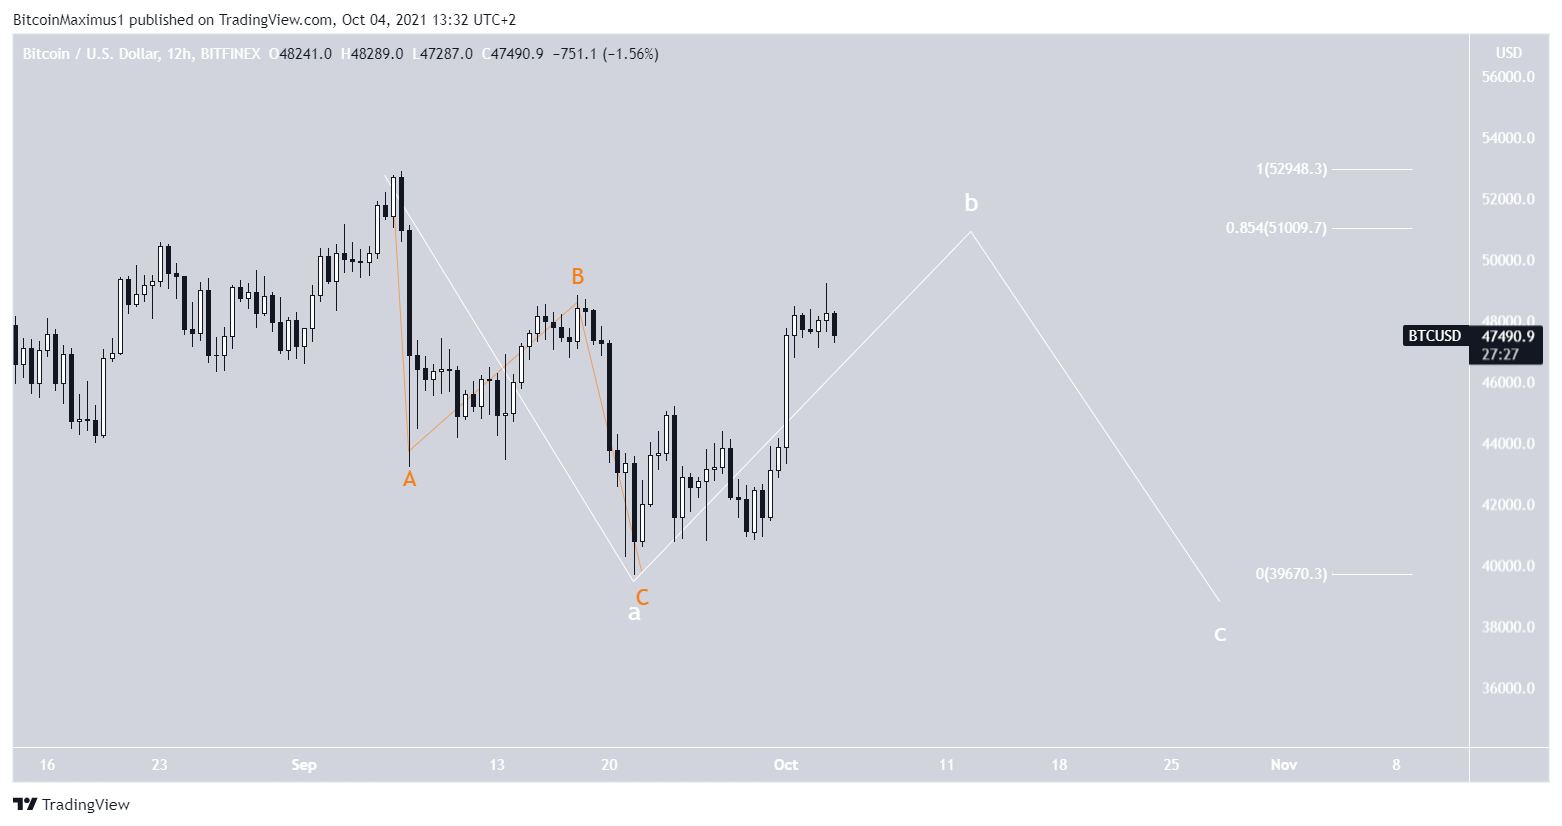
Bearish BTC count
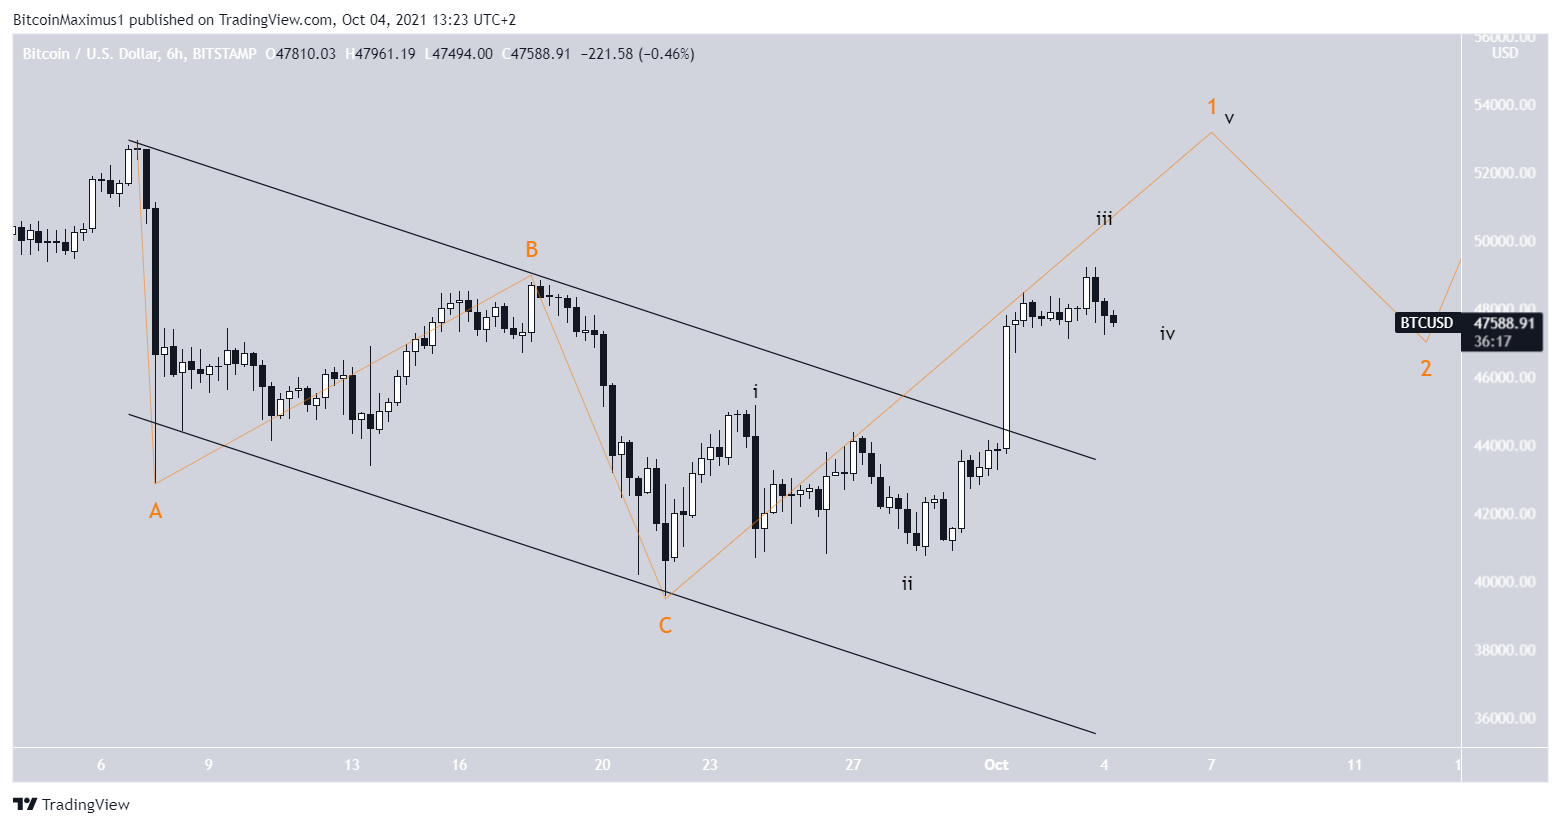
Both the long-term and short-term movement is the same even in the bearish count. However, the medium-term movement differs.
In this case, BTC is still in wave two of the bullish impulse, since the current A-B-C decrease (orange) was only wave A (white) of the correction.
Since the movement is a flat correction, BTC would be expected to increase to at least $51,000 before falling once more towards the Sept 21 lows. Afterwards, the upward movement would be expected to continue.
For BeInCrypto’s latest Bitcoin (BTC) analysis, click here.
What do you think about this subject? Write to us and tell us!


