

The Bitcoin (BTC) price consolidated on Feb. 9 after breaking out to a new all-time high the day prior.
While the possibility of a short-term drop remains, Bitcoin is expected to continue increasing in the near future.
Current Bitcoin Movement
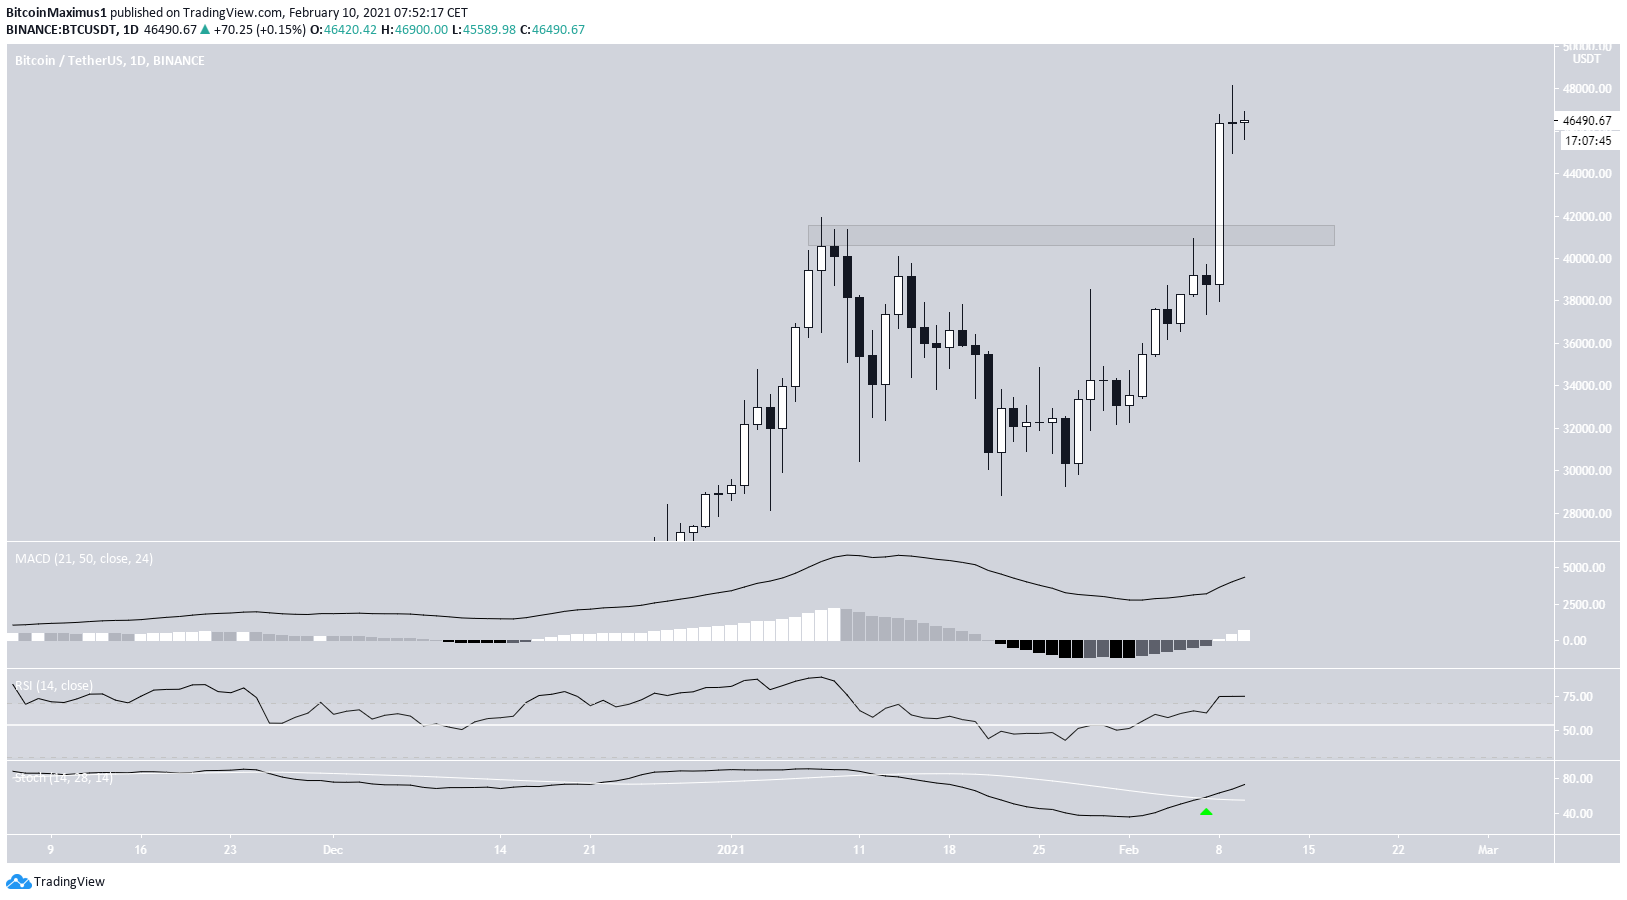
After breaking out amid a massive bullish candlestick on Feb. 8, BTC consolidated the next day, creating a Doji candlestick in the process. This is normally a sign of indecision.
Despite this, technical indicators are decisively bullish. The RSI has crossed above 70, the MACD is moving higher, and the Stochastic oscillator has just made a bullish cross (green arrow).
The main support area is found at $41,300.
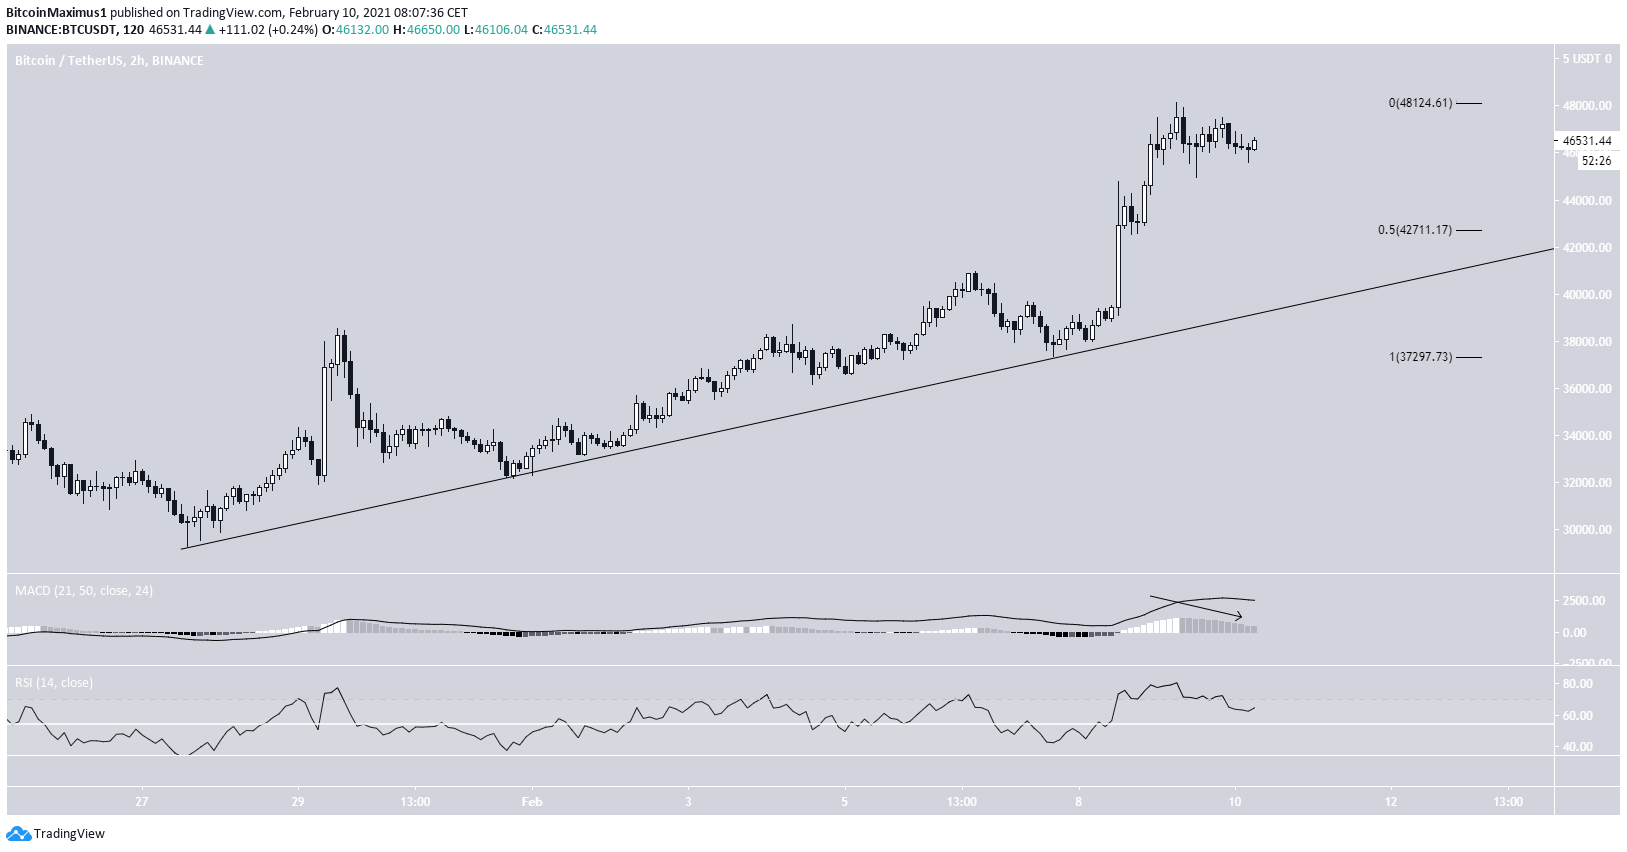
The two-hour chart shows that BTC is following an ascending support line, which is currently near $42,000.
The most recent portion of the movement has not yet retraced. If it does, there is strong support at $42,711. Technical indicators are slightly bearish, suggesting that such a drop could potentially transpire.
Nevertheless, the longer-term trend is clearly bullish, suggesting that even if a short-term drop occurs, BTC will eventually keep moving higher.
BTC Wave Count
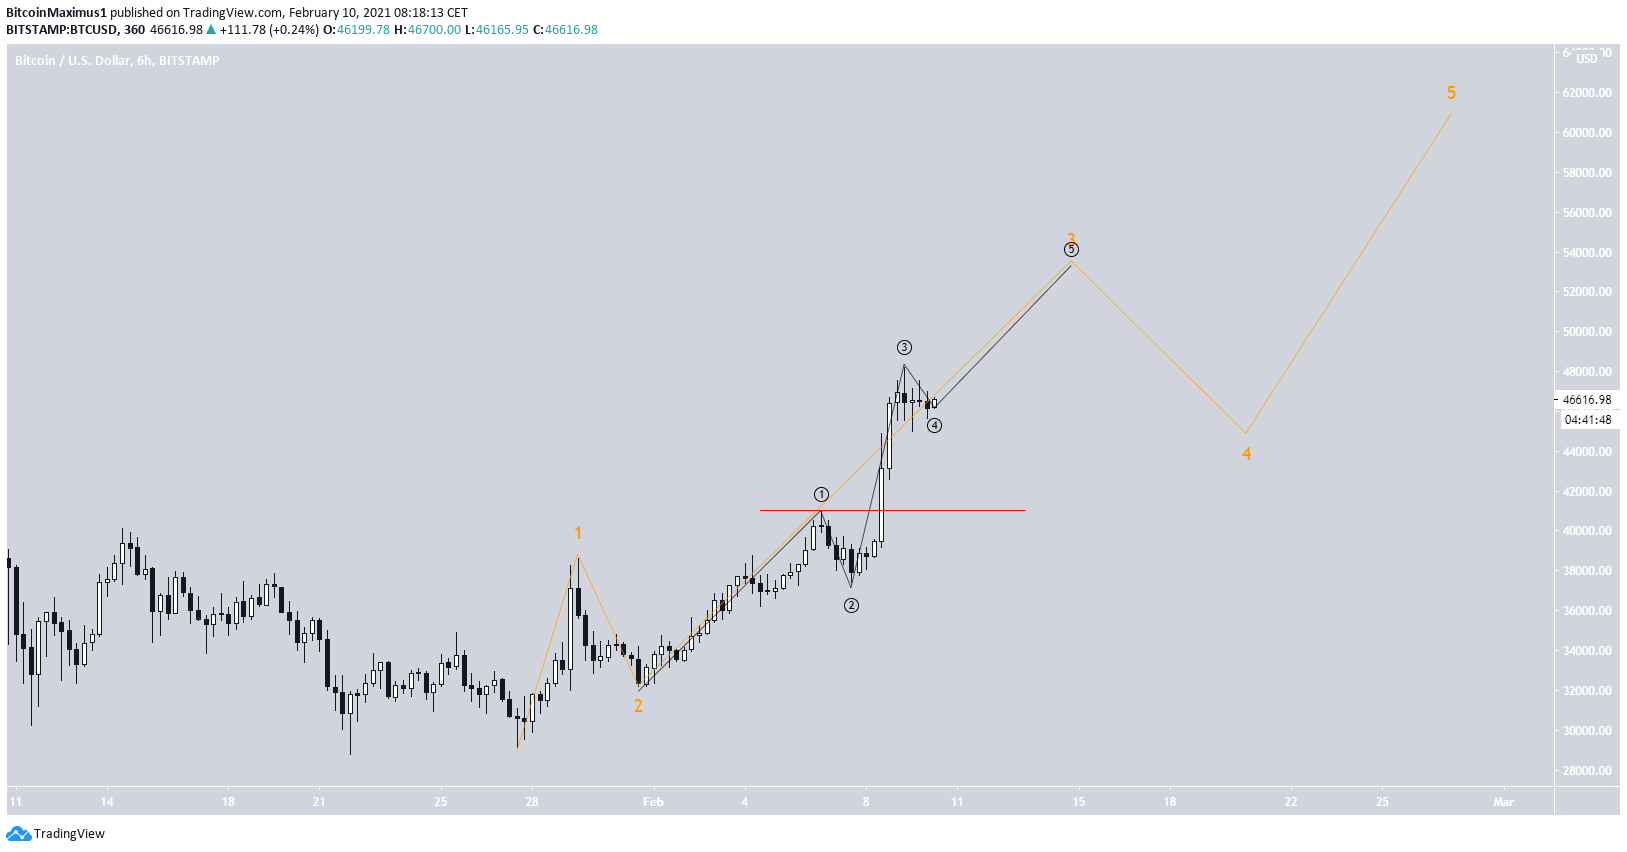
The short-term wave count suggests that BTC is in wave three (orange) of a bullish impulse that began on Jan. 28.
The sub-wave count is shown in black and appears to indicate that BTC is in sub-wave 4.
A decrease below the sub-wave one high at $41,025 would invalidate this particular wave count.
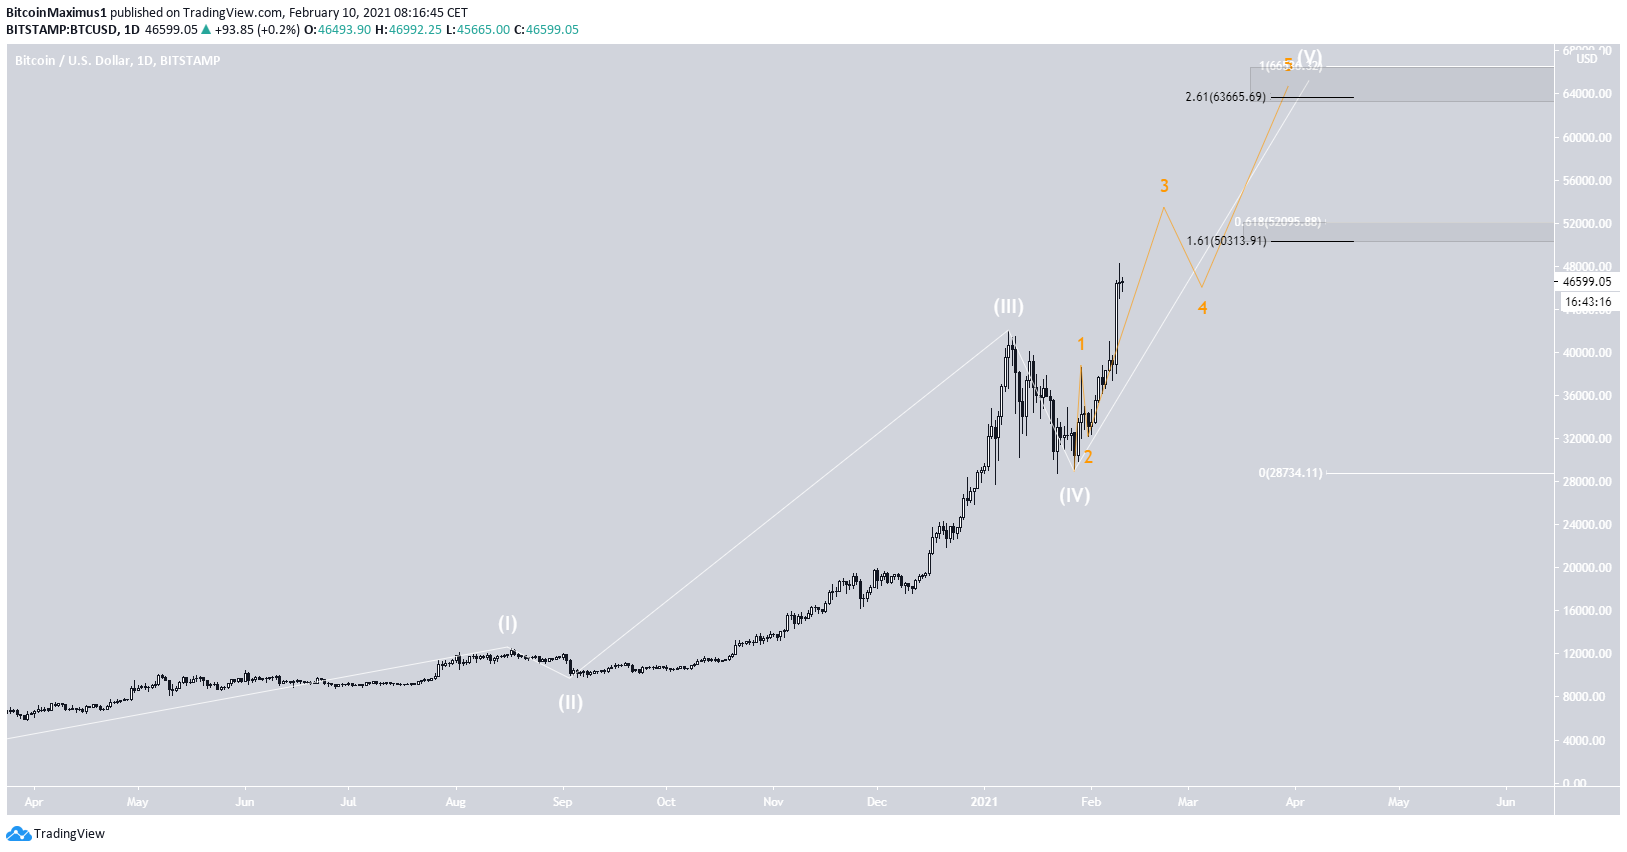
The longer-term count (white) indicates that BTC is in wave five of a bullish impulse that began in March 2020.
The most likely targets for the top of the move are found between $50,300-$52,000 and $63,600-$66,000. These target ranges were found using a Fib projection and external retracement respectively.
Due to the shape of the current movement, the higher target range seems more likely.
Conclusion
Bitcoin is in a long-term bullish trend that is expected to take it towards $52,000 and possibly $64,000. However, a short-term drop could occur prior to the upward move developing.
For BeInCrypto’s previous Bitcoin (BTC) analysis, click here
Disclaimer
In line with the Trust Project guidelines, this price analysis article is for informational purposes only and should not be considered financial or investment advice. BeInCrypto is committed to accurate, unbiased reporting, but market conditions are subject to change without notice. Always conduct your own research and consult with a professional before making any financial decisions. Please note that our Terms and Conditions, Privacy Policy, and Disclaimers have been updated.
