


Bitcoin (BTC) is approaching a crucial resistance level created by a confluence of Fib resistances between $46,800-$47,800.
Multiple short-term time frames are showing weakness, suggesting that BTC might be approaching a top.
BTC approaches resistance
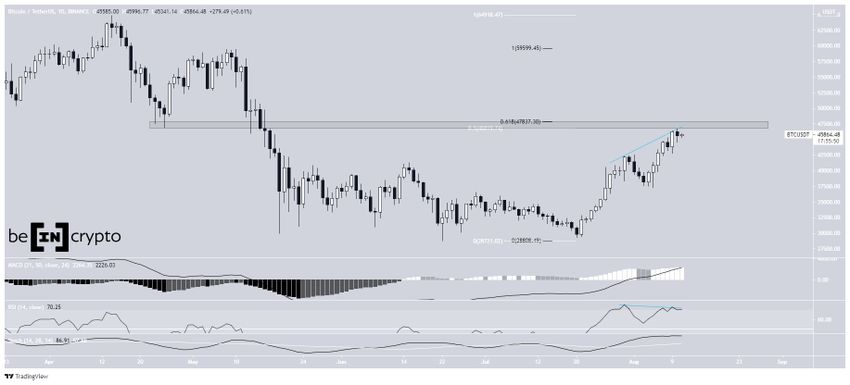
BTC has been increasing since July 20 after it reached a local low of $29,278. It created a higher low on Aug 5 and resumed its ascent after.
So far, it has managed to reach a high of $46,700 on Aug 10.
It’s approaching a very significant resistance level between $46,800 and $47,800. The resistance is created by the long-term 0.5 Fib retracement level (white), the short-term 0.618 Fib retracement level (black), and a horizontal resistance area.
Reclaiming this level would go a long way in indicating that the trend is still bullish. However, while the Stochastic oscillator and the MACD are bullish, the RSI has a generated bearish divergence (blue).
Short-term weakness
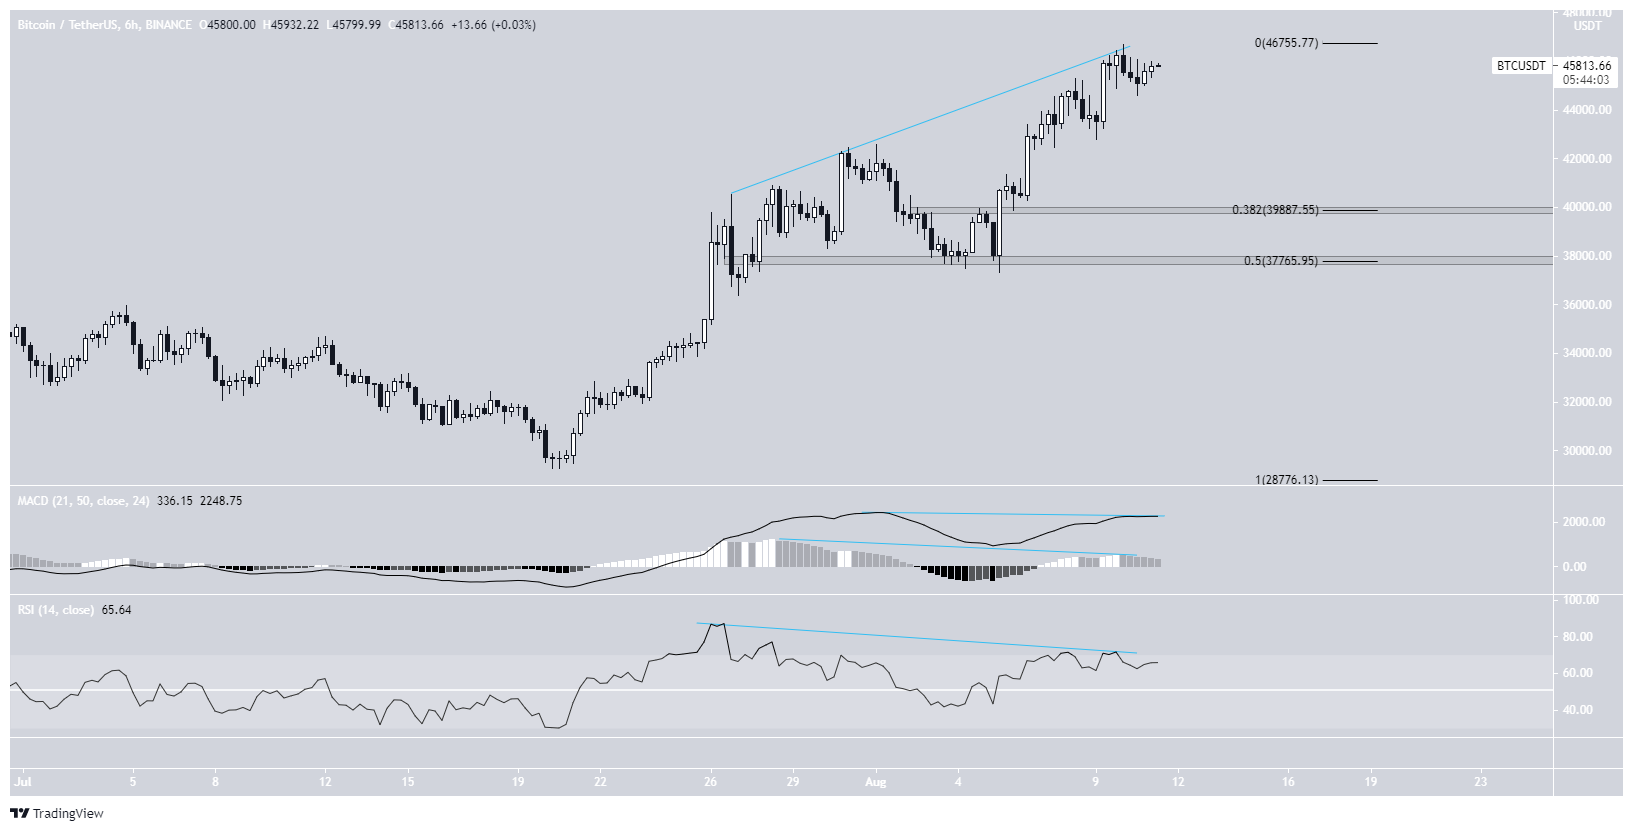
The six-hour chart shows similar weaknesses. Both the RSI and MACD have generated multiple bearish divergences.
If a decrease occurs, the closest support levels would be found at $39,900 and $37,770. These are the respective 0.382 and 0.5 Fib retracement support levels.
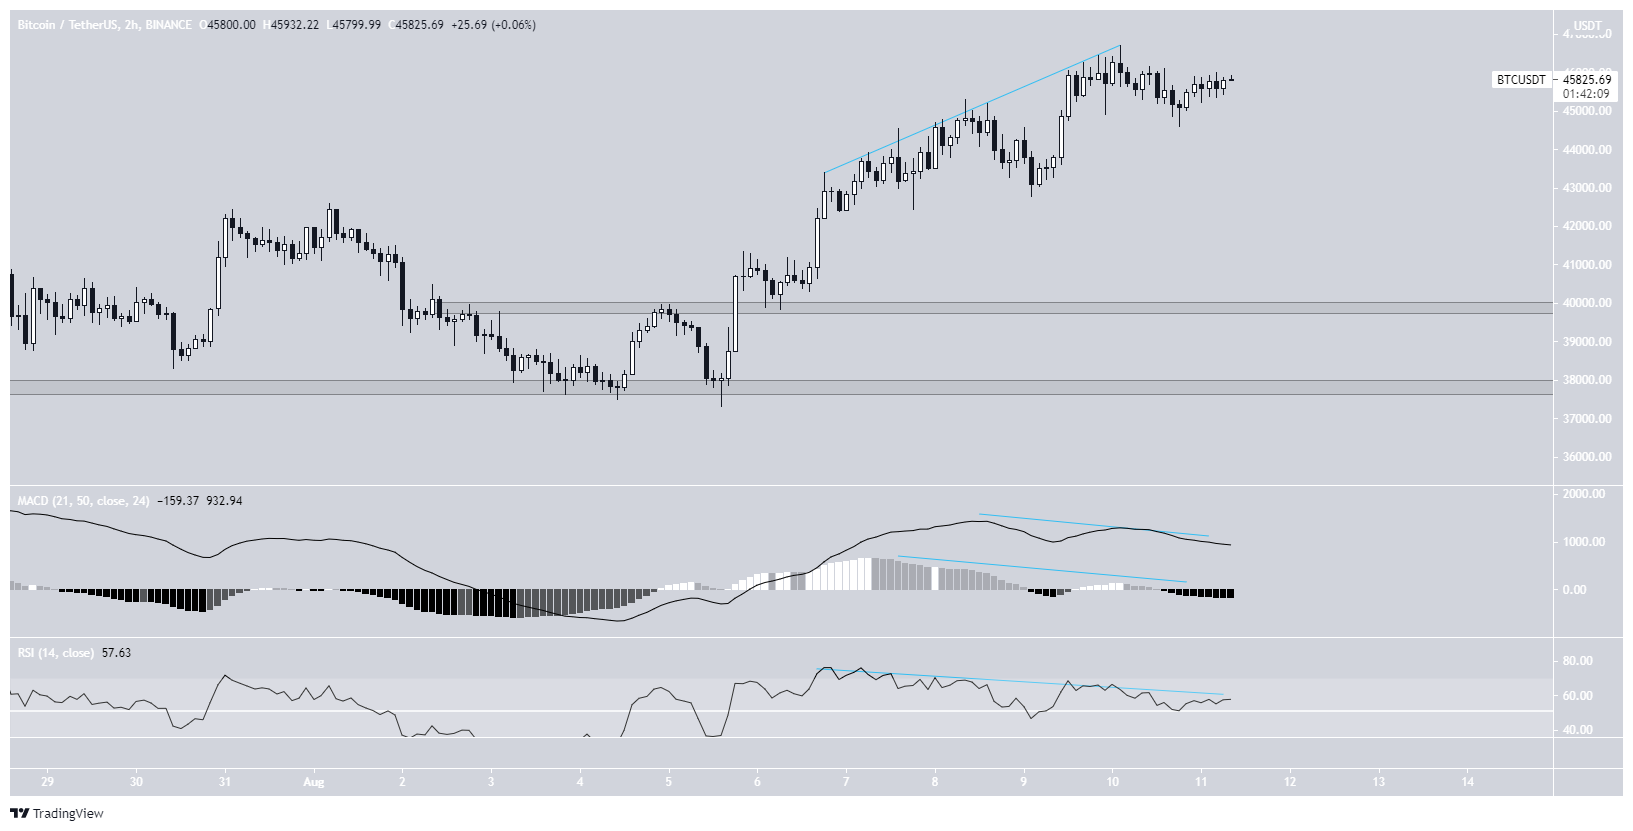
The two-hour chart provides an almost identical reading, with the same divergences visible in the MACD and RSI.
Therefore, it would make sense for BTC to reach a top somewhere inside the aforementioned $46,800-$47,800 resistance area.
Wave count
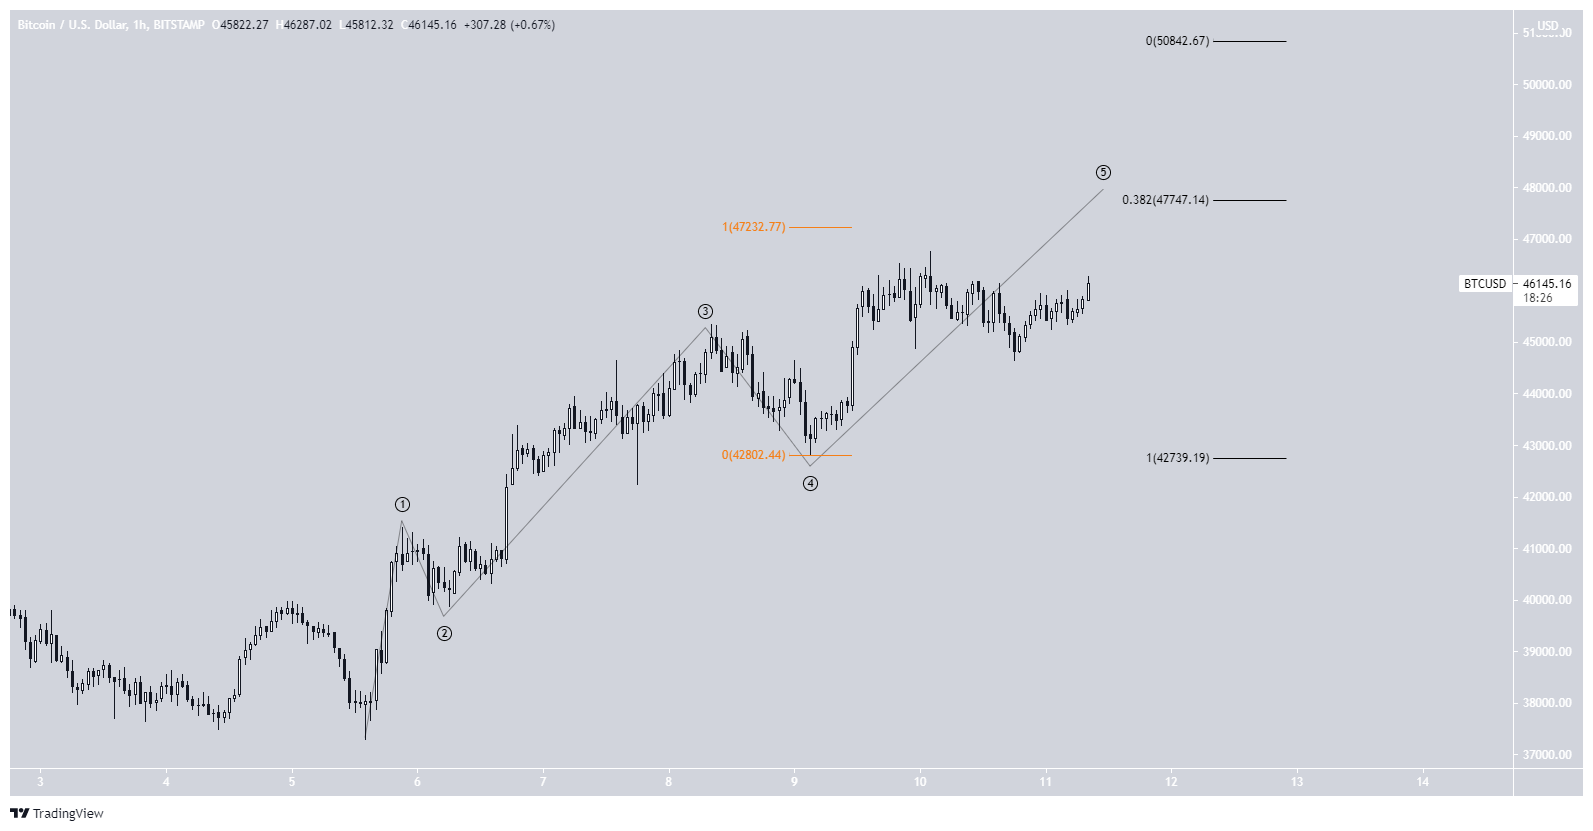
While the long-term wave count is not entirely clear, the short-term count indicates that BTC is likely in wave five of a bullish impulse (black).
Projecting the lengths of waves 1-3 (black) gives a target of $47,750 while using the length of wave 1 gives a target of $47,250 (orange).
For BeInCrypto’s previous bitcoin (BTC) analysis, click here.



