
While the price of Bitcoin (BTC) has been hovering around $50,000 for several weeks, cryptocurrency analysts are trying to determine where the market is at in the cycle. In recent days, several colored charts of Bitcoin have been published on Twitter, with some interesting indicators superimposed on the price of the largest cryptocurrency.
BeInCrypto looks at several indicators for which Bitcoin’s colored charts may shed more light on the current state of the cryptocurrency market. These include the Fear and Greed Index, the funding rate of perpetual futures and the change in position of long-term BTC holders. It turns out that they all give moderate readings and generally indicate a neutral sentiment in the market, which is waiting for the next big move in the Bitcoin price.
Fear and Greed Index still in fear territory
The Fear and Greed Index for Bitcoin has been below 50 (blue line) since November 22. Moreover, it has even been below 30 (red line) for most of the recent period, indicating a strong fear and apprehension of further declines in the BTC price.
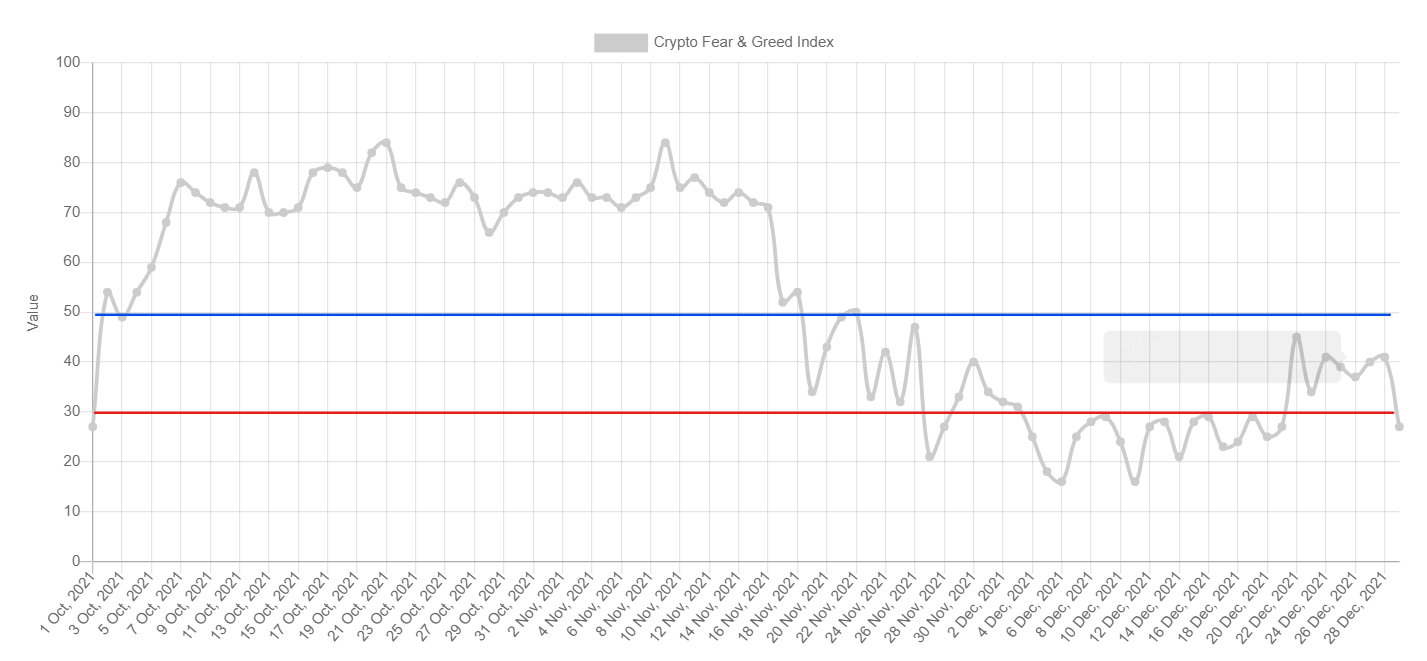
The recent breakout of Bitcoin price above the falling resistance line and reclaiming of the $50,000 area on December 23 sent the index up near 40. However, yesterday’s drop of more than 6% has brought fear back into the market, with the Fear and Greed Index showing 27 today.
Cryptocurrency analyst @dilutionproof tweeted a chart of BTC going back to 2018, in which the colors correspond to the Fear and Greed Index readings. The resulting color chart of Bitcoin shows at which moments of price action the sentiment of market participants was maximally greedy, neutral or experiencing maximum fear.
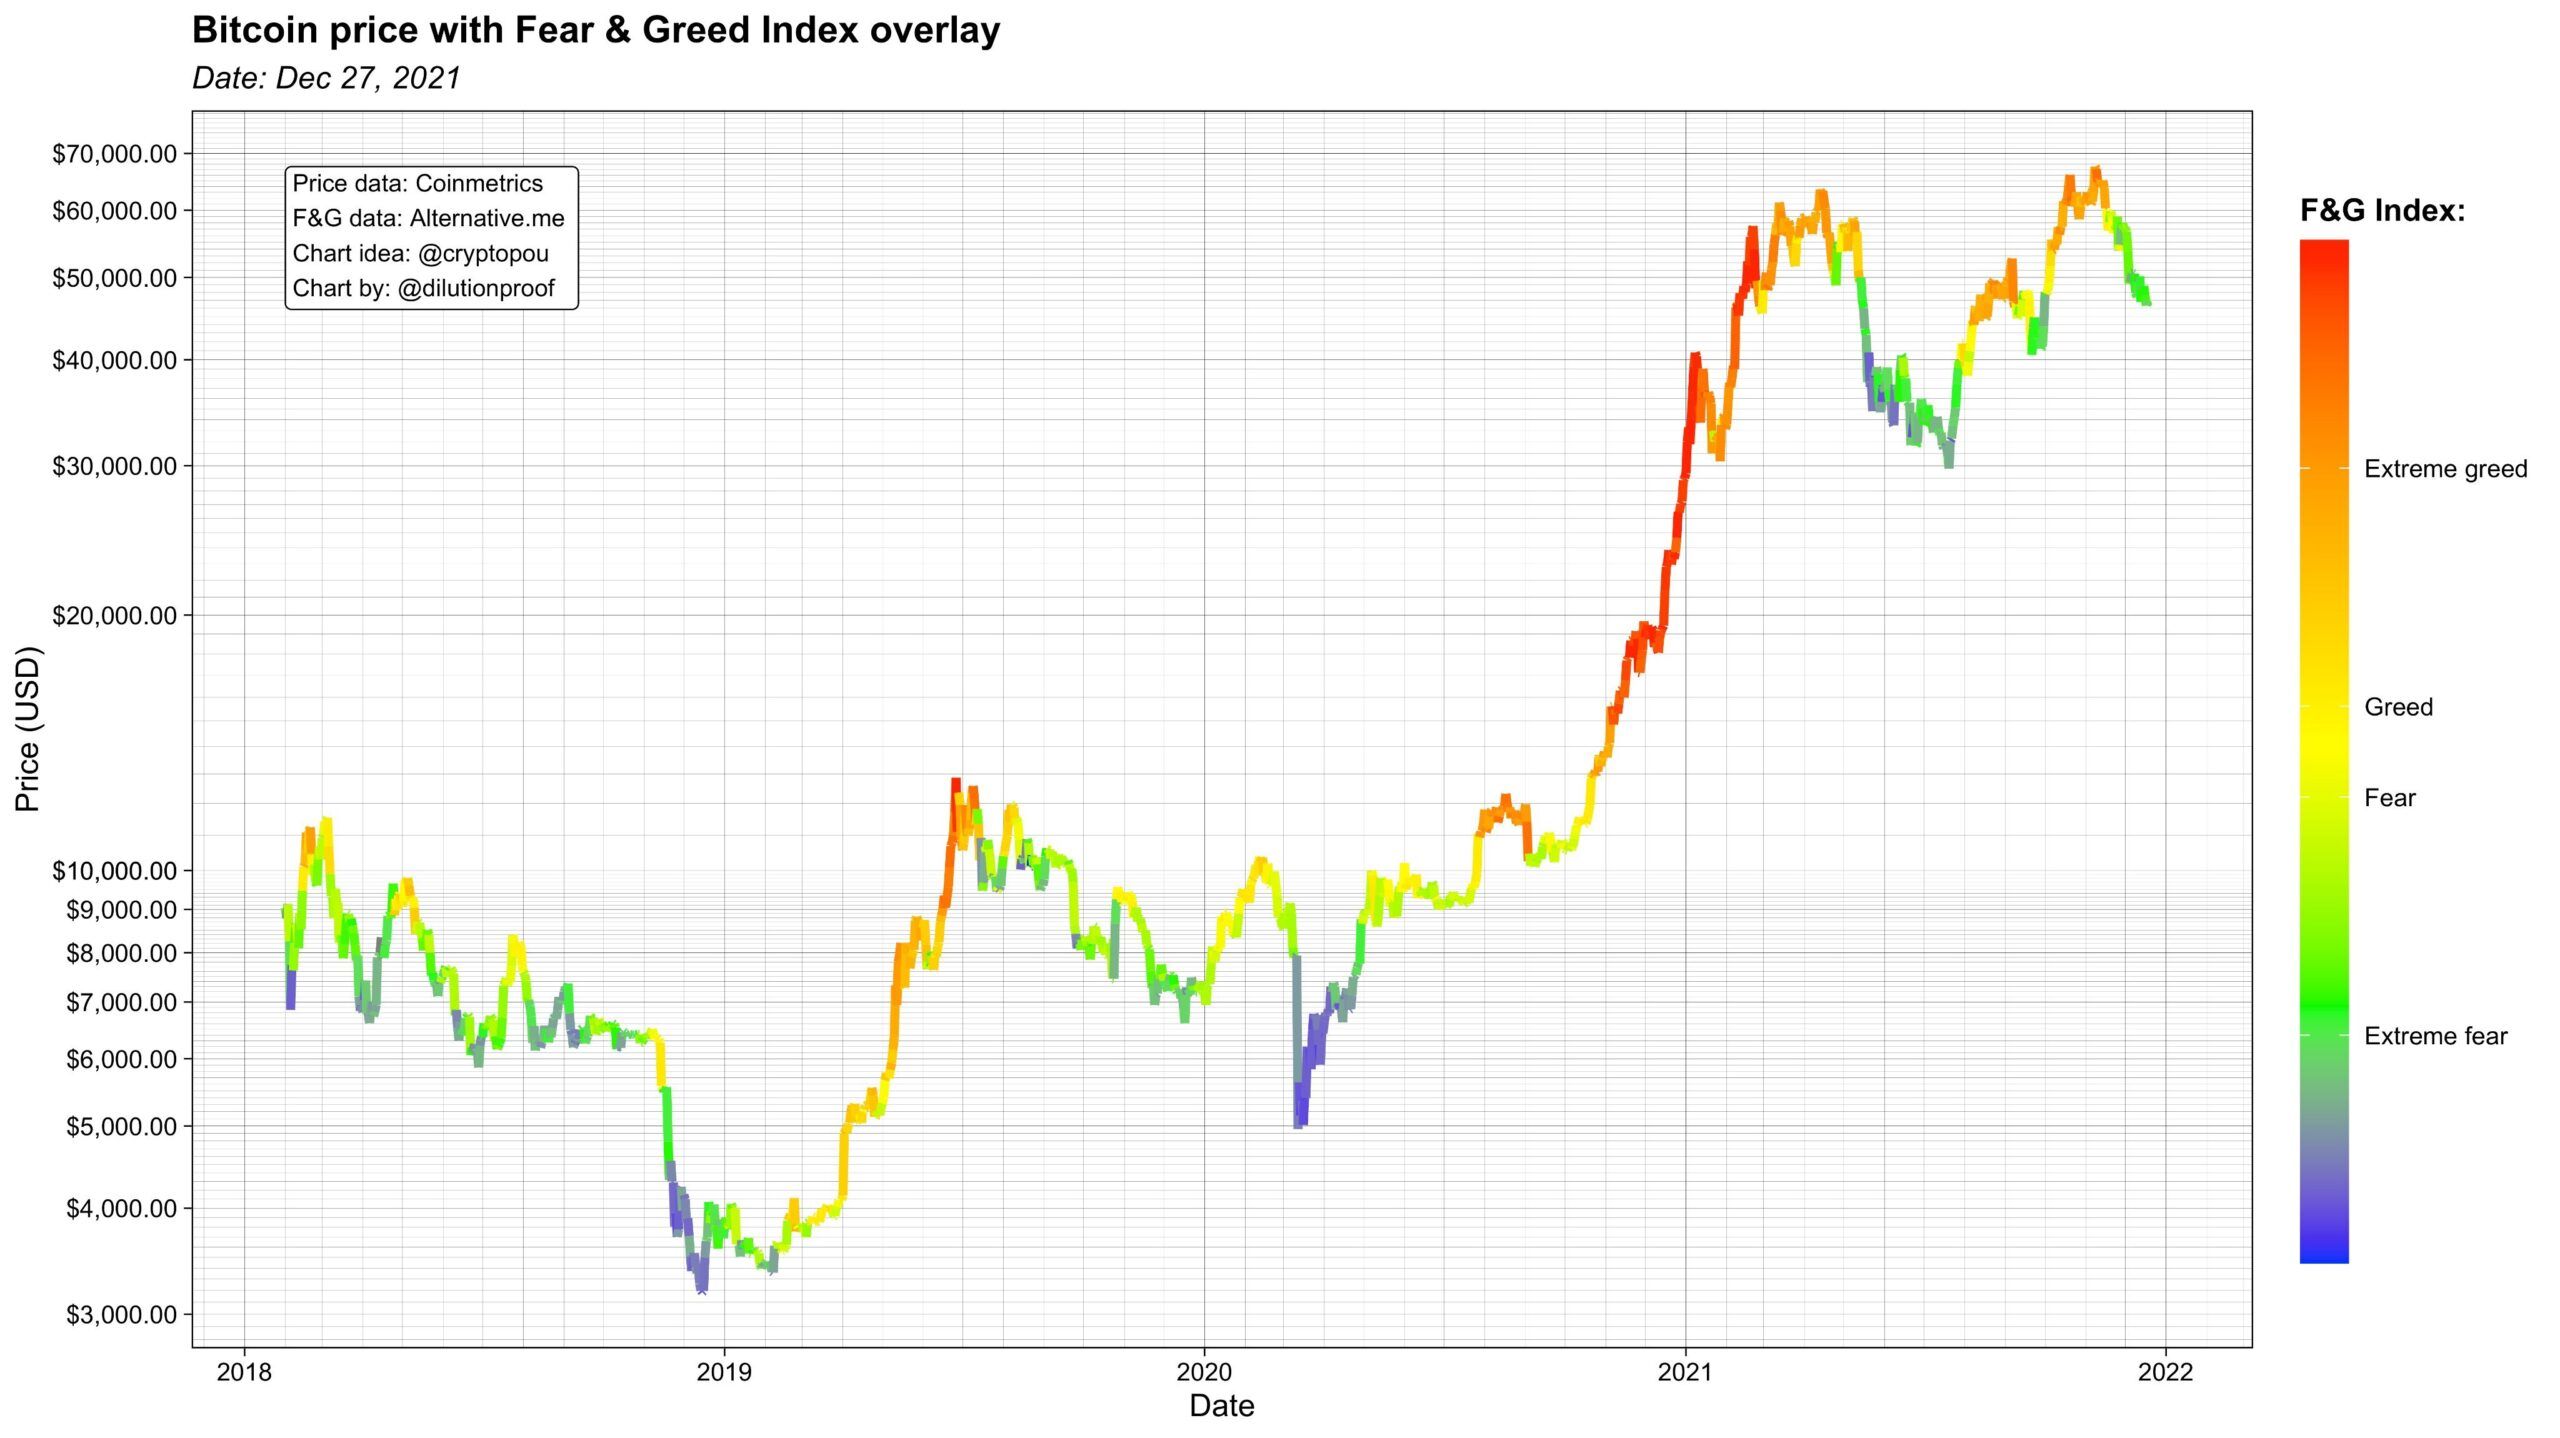
It turns out that the Fear and Greed Index works quite well as a proxy for local peaks (maximum greed, red) and local lows (maximum fear, blue). Comparing current with historical readings, we see that the market today is in a rather neutral position that leans slightly towards fear.
This in turn means that there is a higher probability for an upward move. However, due to the lack of extremes, there is still a chance for the decline to continue and reach maximum fear.
Funding rate slightly positive
The funding rate of perpetual futures contracts is another interesting indicator of market health. When it is positive, holders of long positions periodically pay a small amount to holders of short positions. Conversely, when the rate is negative, short positions periodically pay long positions.
In other words, a positive funding rate for futures contracts signals that most market participants expect the price to rise. Therefore, they are willing to pay to maintain their long position. With a negative rate, most market participants expect declines to continue.
Over the last month, the funding rate has been slightly positive, staying in the 0.004-0.009% range for most of the time. This is a very small positive value, which mostly indicates a completely neutral sentiment of the BTC market.
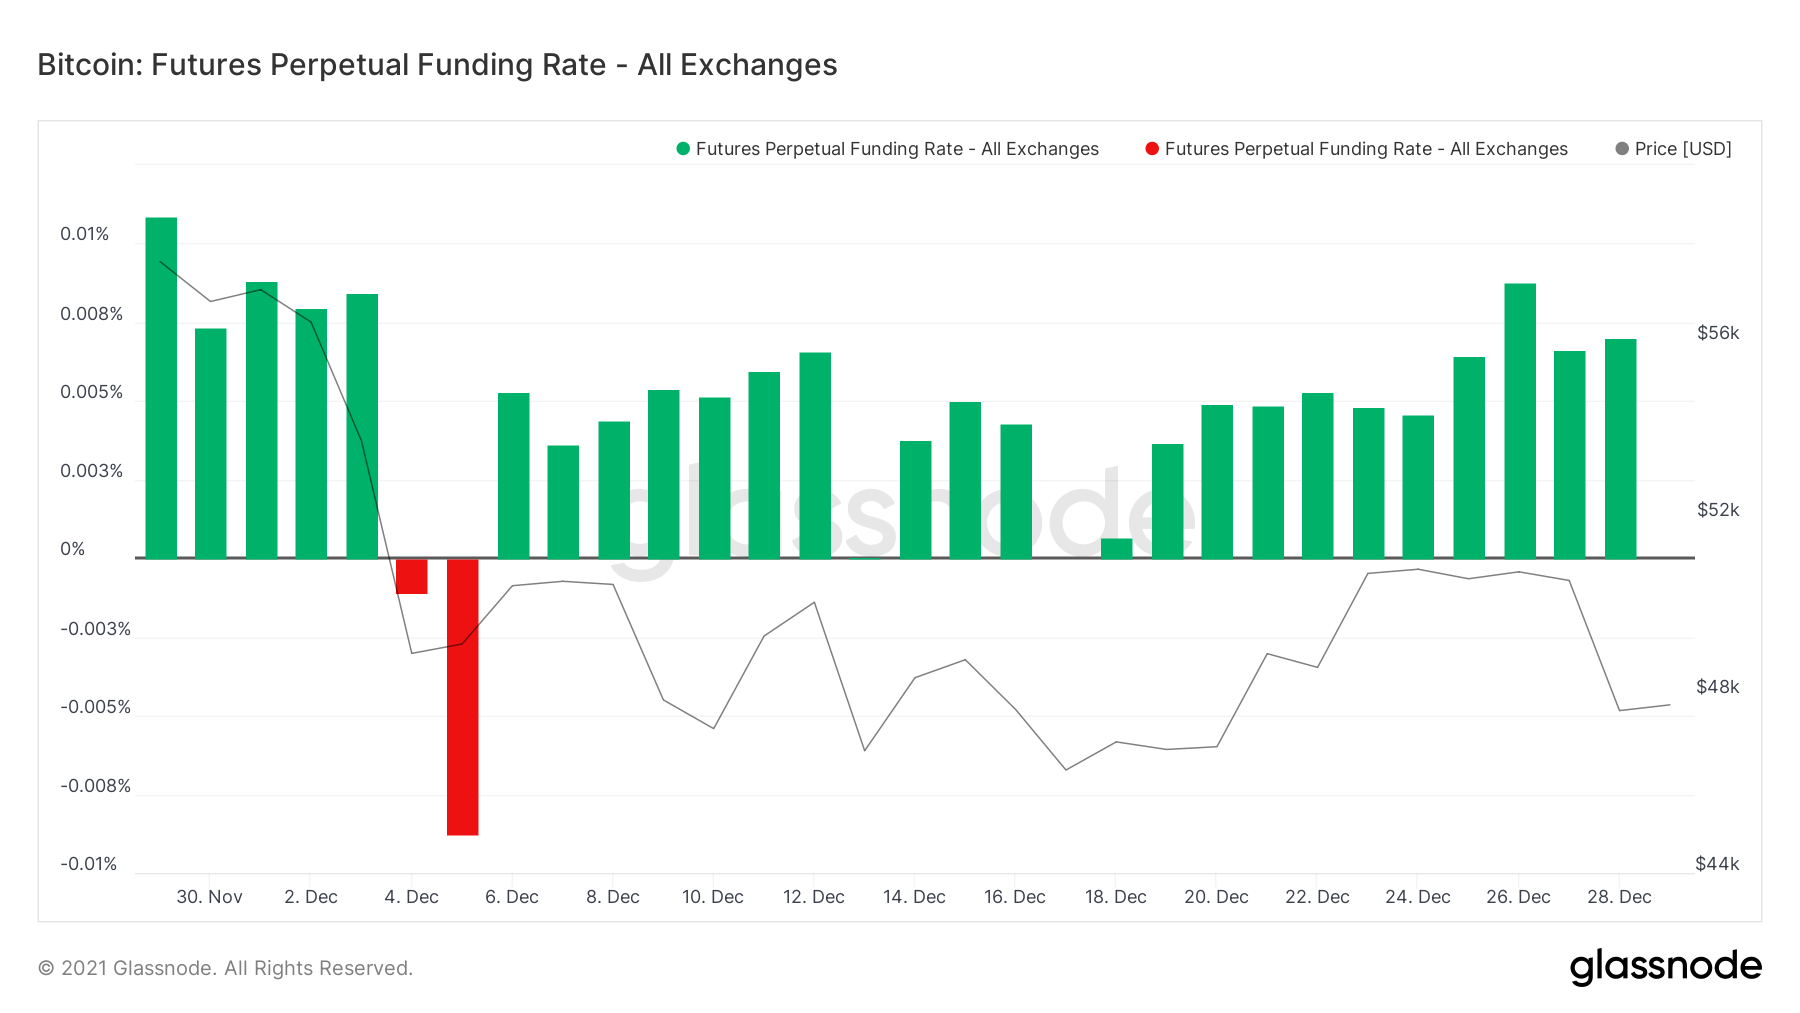
We can also see that during the last few days, the funding rate was close to 0. On the other hand, on December 3-4, it fell to negative values with a bottom at -0.009%. It is interesting to note that the Bitcoin price decline continued after December 4, but the funding rate did not return to negative values.
On-chain analyst @DylanLeClair_ tweeted another colored chart of Bitcoin, where the price has been colored according to the value of the funding rate. The long-term perspective, which he calls a “fantastic view,” shows that a negative funding rate has very often been the determinant of a bottom in the BTC price (red).
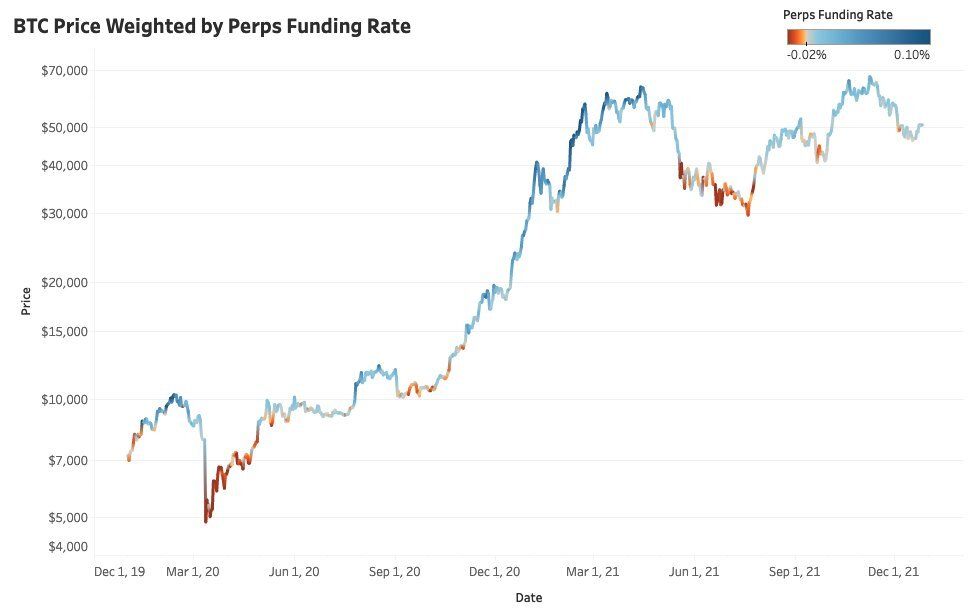
At the same time, very high positive readings, reaching the vicinity of 0.1%, were signals for local tops. Today’s funding rate values are neutral, despite the fact that the price is still correcting. Again, this can be interpreted as a moderate bullish signal, which however still leaves some room for further decline.
Long-term hodlers await
Finally, the last color chart of Bitcoin uses an on-chain indicator that analyses the behavior of long-term hodlers (LTH). Historical analysis shows that periods of LTH accumulation have coincided with declines and consolidation in the Bitcoin price. In contrast, strong increases in the BTC price were combined with strong distribution and sales of LTH to short-term market participants.
Cryptocurrency market analyst @samjrule tweeted yet another color chart of Bitcoin, in which he used the LTH behavior indicator. Specifically, he overlaid the 30-day change in LTH supply on Bitcoin price over the past two years.
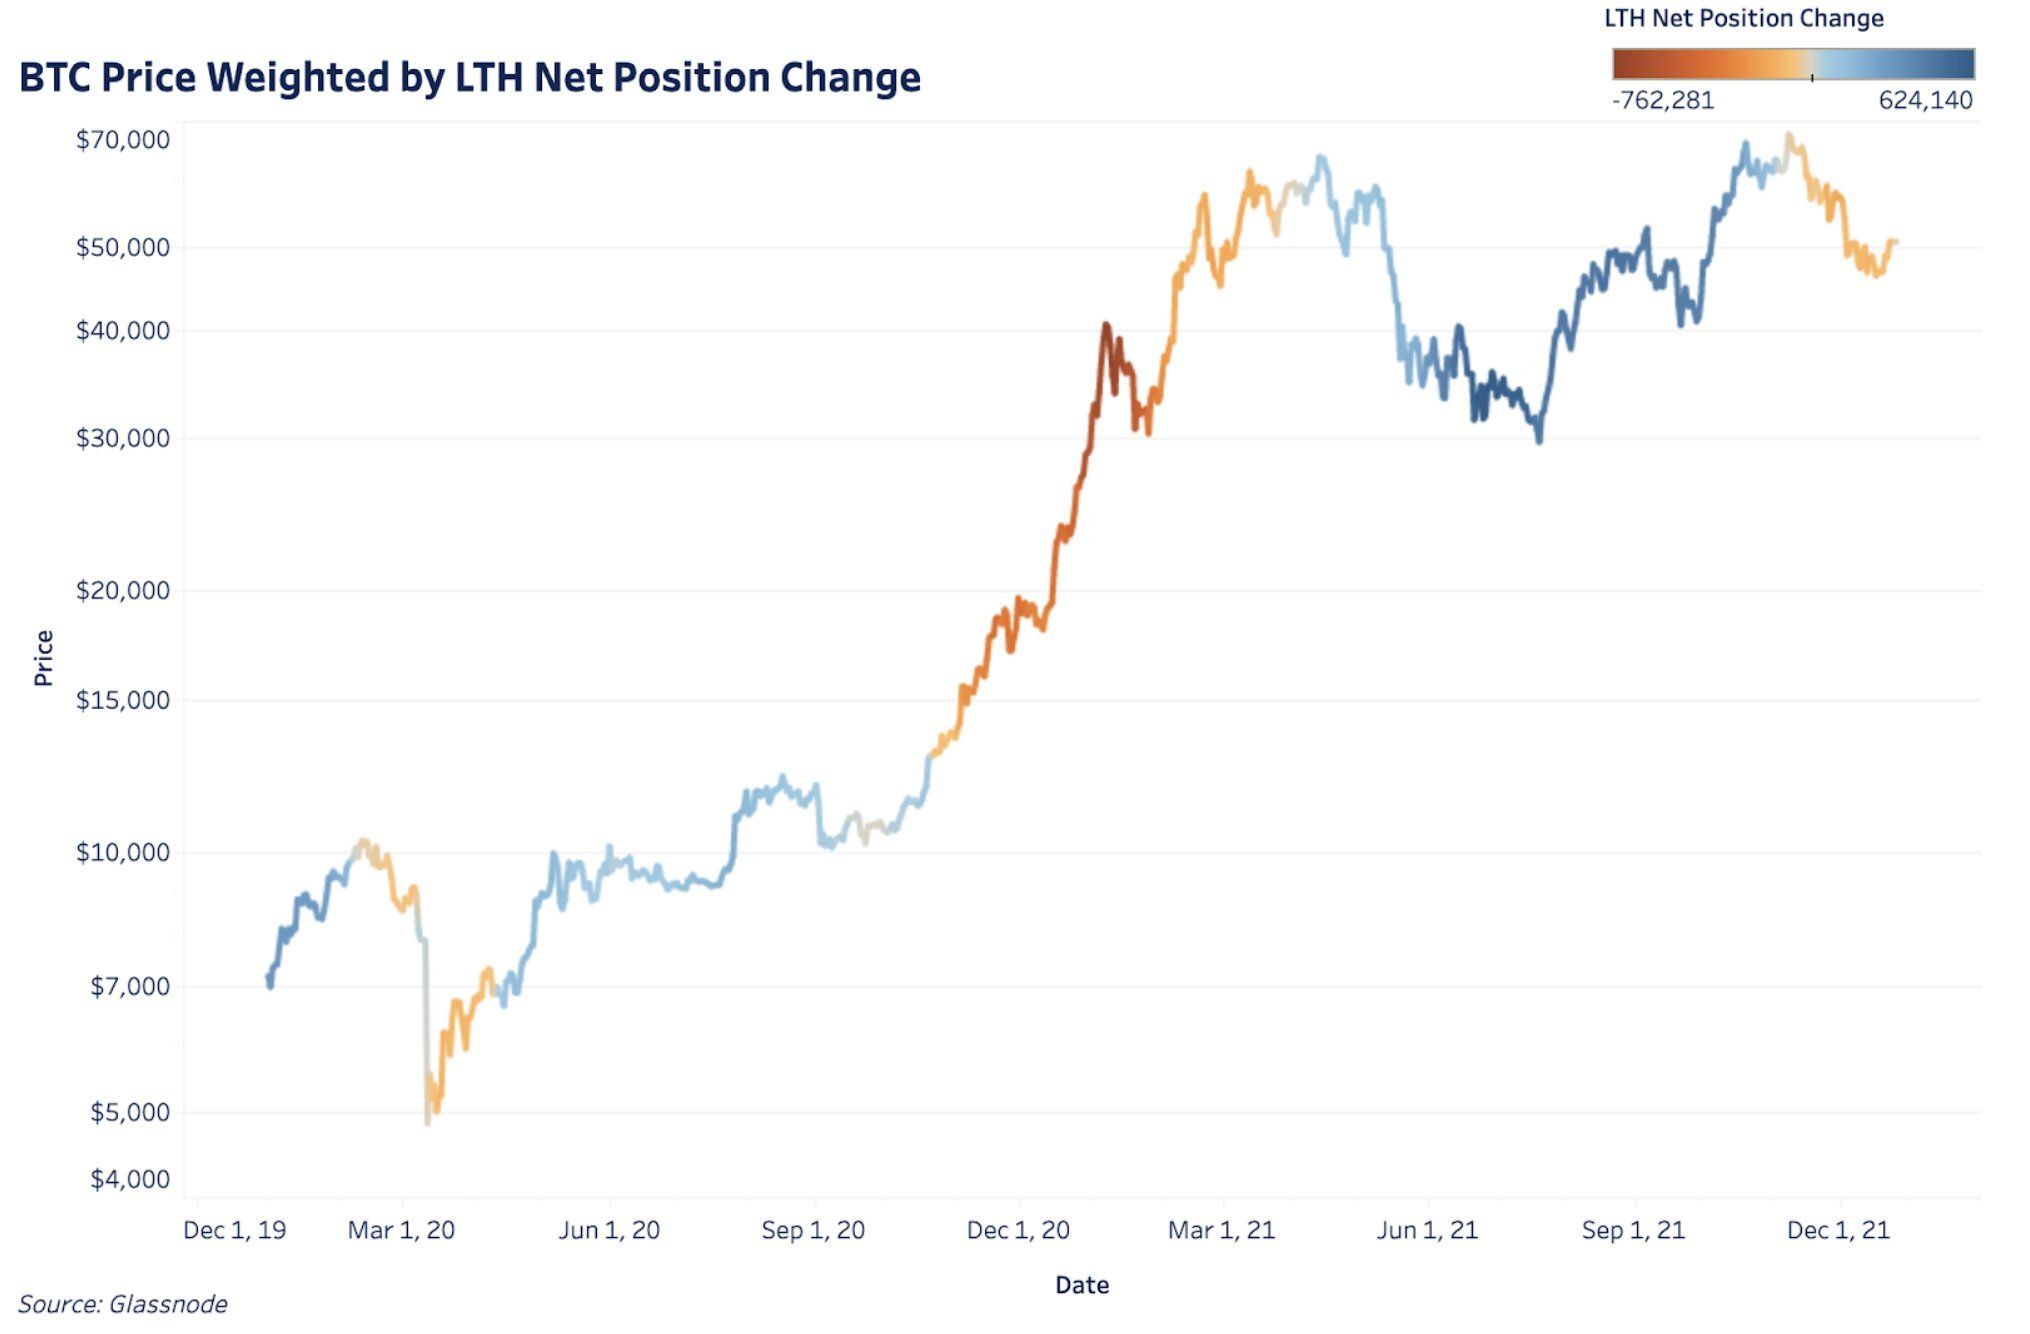
When the chart colour was turning dark red, LTHs were experiencing a strong distribution. On the contrary, when it was turning dark blue, LTHs were going through a wave of strong accumulation.
Today, we see that despite Bitcoin’s falling price, LTHs are not accumulating aggressively. Moreover, they are not selling off their supply either. Their net position change indicator is in slightly negative territory (light orange).
This means that the sentiment of long-term hodlers is cautious. They are slightly reducing their exposure to BTC and not buying more coins. However, their behaviour is far from aggressive selling, so the overall sentiment remains neutral. LTHs are patiently waiting for the next big move in the Bitcoin price.
For BeInCrypto’s latest Bitcoin (BTC) analysis, click here.
