


Bitcoin (BTC) is showing several long-term bullish reversal signs and is attempting to create a short-term higher low.
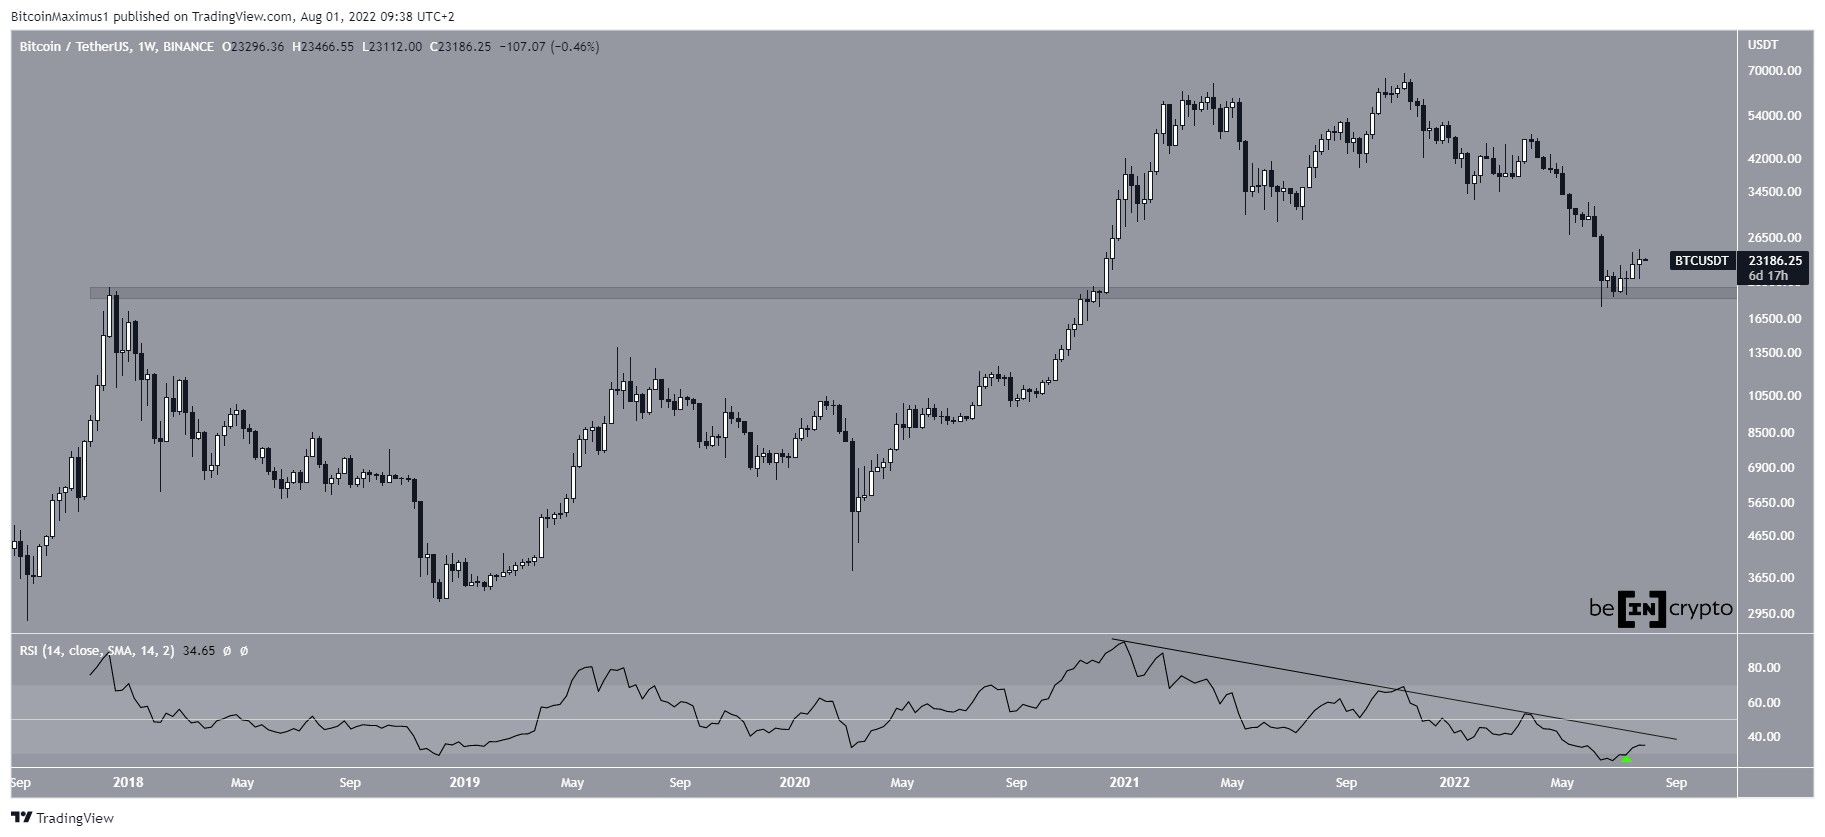
BTC has been falling since reaching an all-time high price of $69,000 in Nov. The downward movement has so far led to a low of $17,622 in June. Bitcoin has been moving upwards since and so far has reached a high of $24,668.
The weekly RSI provides a bullish outlook, since the indicator has moved outside its oversold region (green icon) and is currently at 36. However, it is still following its same bearish divergence trend line that has been in place since the all-time high. Its breakout is necessary in order for the bullish reversal to be confirmed.
Finally, Bitcoin has bounced at the $19,200 horizontal area, validating it as support. The area had previously acted as the all-time high resistance.
Ongoing breakout
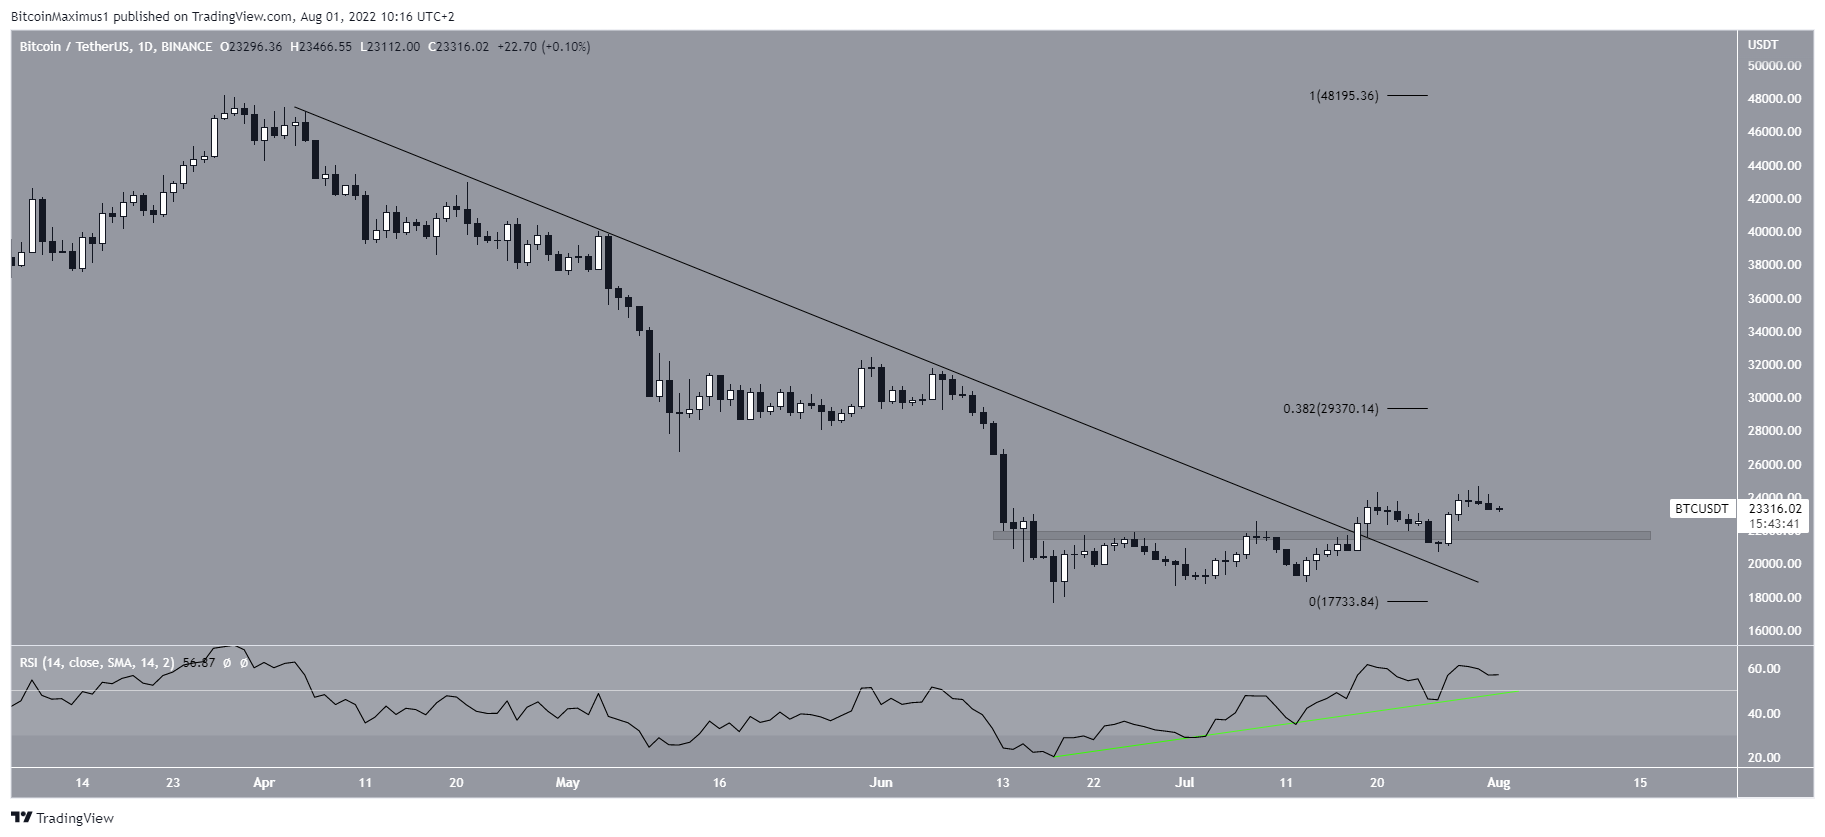
The daily chart provides a more decisively bullish outlook, since BTC has broken out from a descending resistance line that had been in place since the end of March.
Moreover, it has broken out from the $21,750 horizontal area and validated it as support afterwards.
Finally, the daily RSI has moved above 50 and bounced at its ascending support trend line (green line).
If the upward movement continues, the closest resistance area would be at $29,370, created by the 0.382 Fib retracement resistance level.
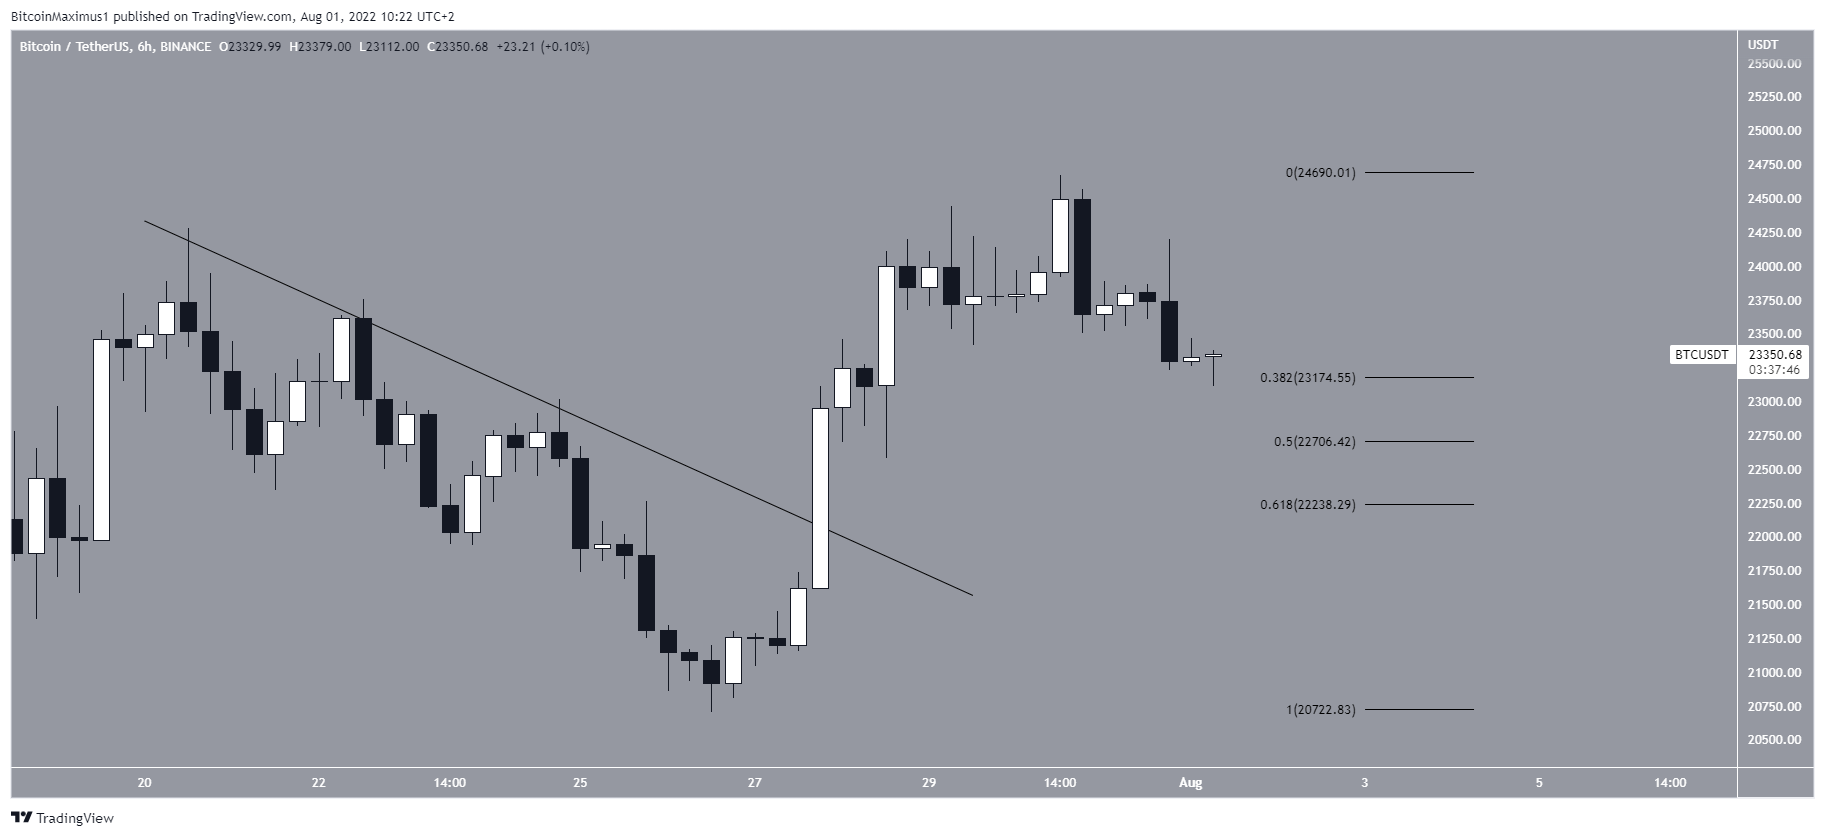
The six-hour chart aligns with this assessment, since it shows a breakout from a shorter-term descending resistance line.
Currently, BTC is attempting to find support above the 0.382 Fib retracement support level at $23,175. It remains to be seen if the area will initiate a reversal or if Bitcoin will fall towards the 0.5 and 0.618 Fib retracement support levels at $22,700 and $22,240, respectively.
BTC wave count analysis
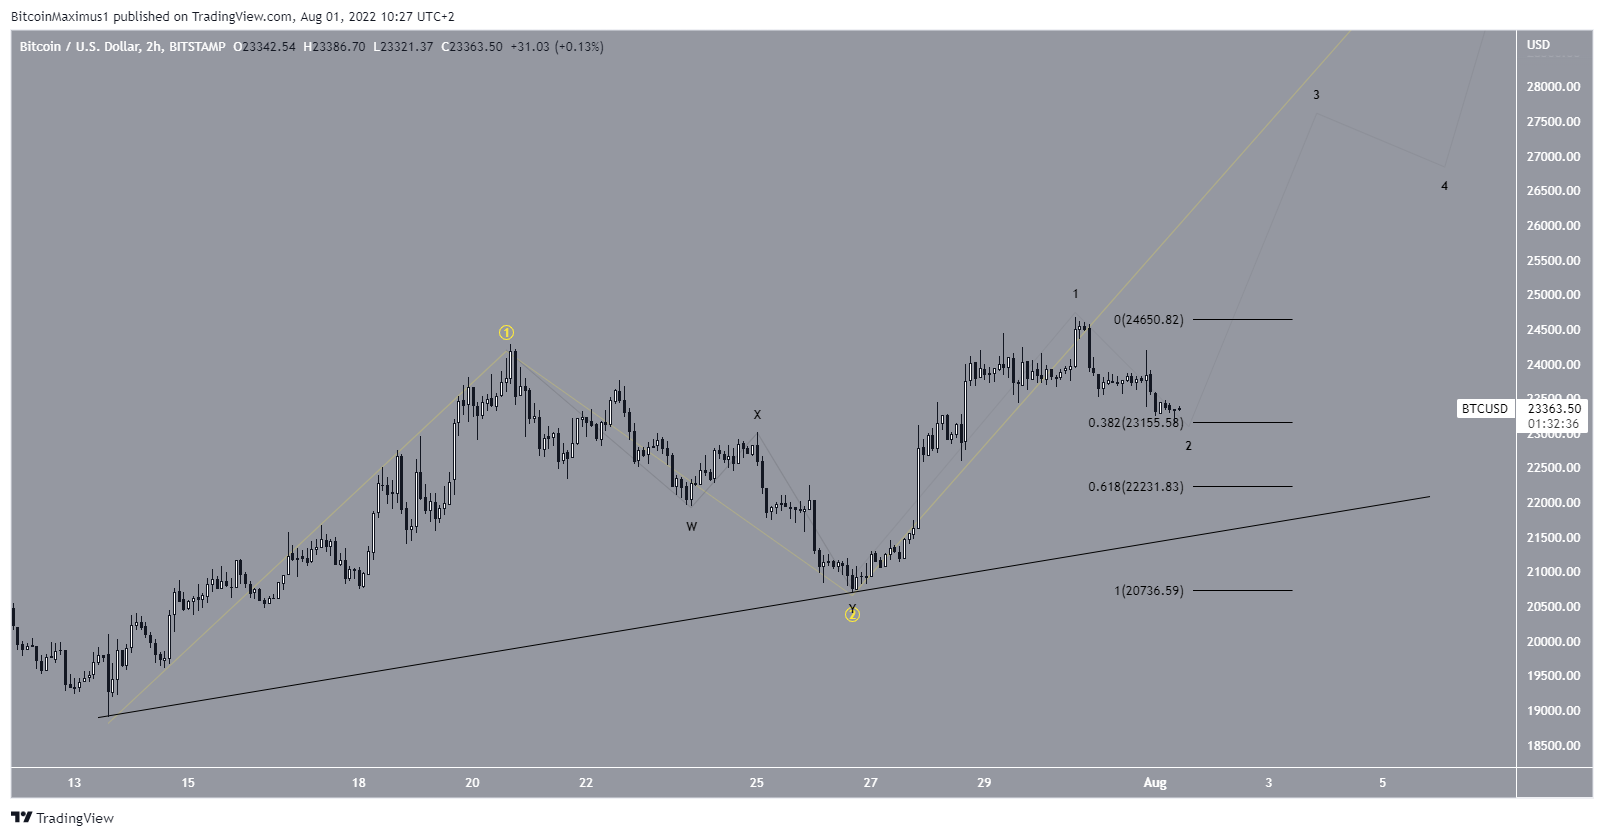
The most likely short-term wave count suggests that BTC has begun wave three of a five-wave upward move (yellow). Wave three is usually the sharpest and largest out of the five, therefore a considerable increase is expected.
The sub-wave count is shown in black and suggests that the price is completing sub-wave two, after which a sharp increase would follow.
Since this seems to be a 1-2/1-2 wave formation, a decrease below the ascending support line and the 0.618 Fib retracement support level at $22,230 would invalidate this count.
For Be[in]Crypto’s previous Bitcoin (BTC) analysis, click here


